
Catalyst Center: design, policy, provision, assurance, and the AI-powered workflows
Cisco DNA Center is now Catalyst Center: a central management dashboard over a controller layer. The controller layer automates devices with NETCONF and YANG, SNMP and SSH, collects data such as NetFlow for assurance, and uses ISE for identity and policy. The dashboard is organised around four workflows: design, policy, provision and assurance.
By Arif, founder of Daveth · Updated
The full 8 min walkthrough is in Daveth Pro (Network). See what the plan opens
What this page answers
What is Cisco Catalyst Center?
The new name for Cisco DNA Center: a centralised management dashboard over a controller layer that automates devices, collects data for assurance, and works with ISE for identity and policy. Read it in “4.1 What Catalyst Center is”
What are the Catalyst Center workflows?
Four: design, policy, provision and assurance. The lesson also covers its AI-powered workflows and what a health score or an AI answer does and does not prove. Read it in “4.1 What Catalyst Center is”
4.1 What Catalyst Center is
A user says the Wi-Fi failed last Tuesday at 3 p.m. What can you do today? Section 4.3 answers it.
Cisco DNA Center is now Catalyst Center: "we are changing the name of Cisco DNA Center to Catalyst Center in this release" (2.3.7). The guide, written earlier, uses the old name and its screenshots show it. Cisco's FAQ, a marketing page, calls it "a powerful management system that leverages AI to connect, secure, and automate network operations"; the guide describes it more plainly as a centralised management dashboard over a controller layer. You can think of it as the network's head office: plans are drawn, rules are written and work orders go out from one place, and reports come back to the same place.
The guide describes it in layers. The controller layer does the work: in the guide's terms, the Network Control Platform automates and configures devices using "NETCONF/YANG, Simple Network Management Protocol (SNMP), SSH/Telnet, and so on" (YANG and NETCONF: 09-5, 09-6); the Network Data Platform collects and correlates data (NetFlow, SPAN and more) for assurance; and Cisco ISE provides identity and policy. The management layer is the dashboard, organised around four workflows: design, policy, provision and assurance. Figure 23-8 shows NETCONF, SNMP and SSH going out to the devices and HTTPS, NetFlow and syslog coming back. If you've ever run a building where the front desk hands out keys, the guard checks who's allowed in and a logbook records who came and went, that's the controller layer's split: automation, ISE's identity and policy, and data collection. Figure 23-8 also shows ISE's AAA, RADIUS and EAPoL links to the fabric (AAA and RADIUS: 08-2; 802.1X and EAPoL host authentication: 08-7).
Around it sit APIs: "Intent APIs, which enable continuous network alignment to the changing needs of IT and business", and "Integration APIs" for Cisco and third-party systems (09-3 calls them and reads their responses). Beyond the fabric workflows, the guide's list of capabilities includes configuration templates, software image management and Plug and Play, other ways configuration reaches devices. The guide's quiz credits Assurance's open APIs with pulling in context, such as users and groups from ISE.
Cisco renamed DNA Center to Catalyst Center, so the product finally shares a name with the switches it spends all day configuring.
The guide lists the tools in each workflow:
| Workflow | Tools | For |
|---|---|---|
| Design | Network Hierarchy, Network Settings, Image Repository, Network Profiles | sites and floors; DNS, DHCP, AAA, credentials, IP pools, wireless settings; software images and compliance; LAN, WAN and WLAN profiles |
| Policy | Dashboard, Group-Based Access Control, IP-Based Access Control, Application, Traffic Copy, Virtual Network | SGACLs with ISE; ACLs; QoS by application; ERSPAN copies (07-6); virtual networks and their groups |
| Provision | Devices, Fabrics, Fabric Devices, Host Onboarding | placing devices in sites, checking images, pushing the underlay; fabric domains and roles; how hosts authenticate and which pools they use |
| Assurance | Dashboard, Client 360, Devices 360, Issues | health; per-client and per-device views; open issues and trends |
The guide's quiz answer adds a fifth component, Platform, without describing it; the four above are the ones this lesson uses. It works like a house being built: the architect draws it (Design), the rulebook says who may enter which room (Policy), the builder puts it up (Provision), and the inspector keeps checking it afterwards (Assurance).
Predict before D1: stopping contractors reaching the HR servers. Which workflow?
D1
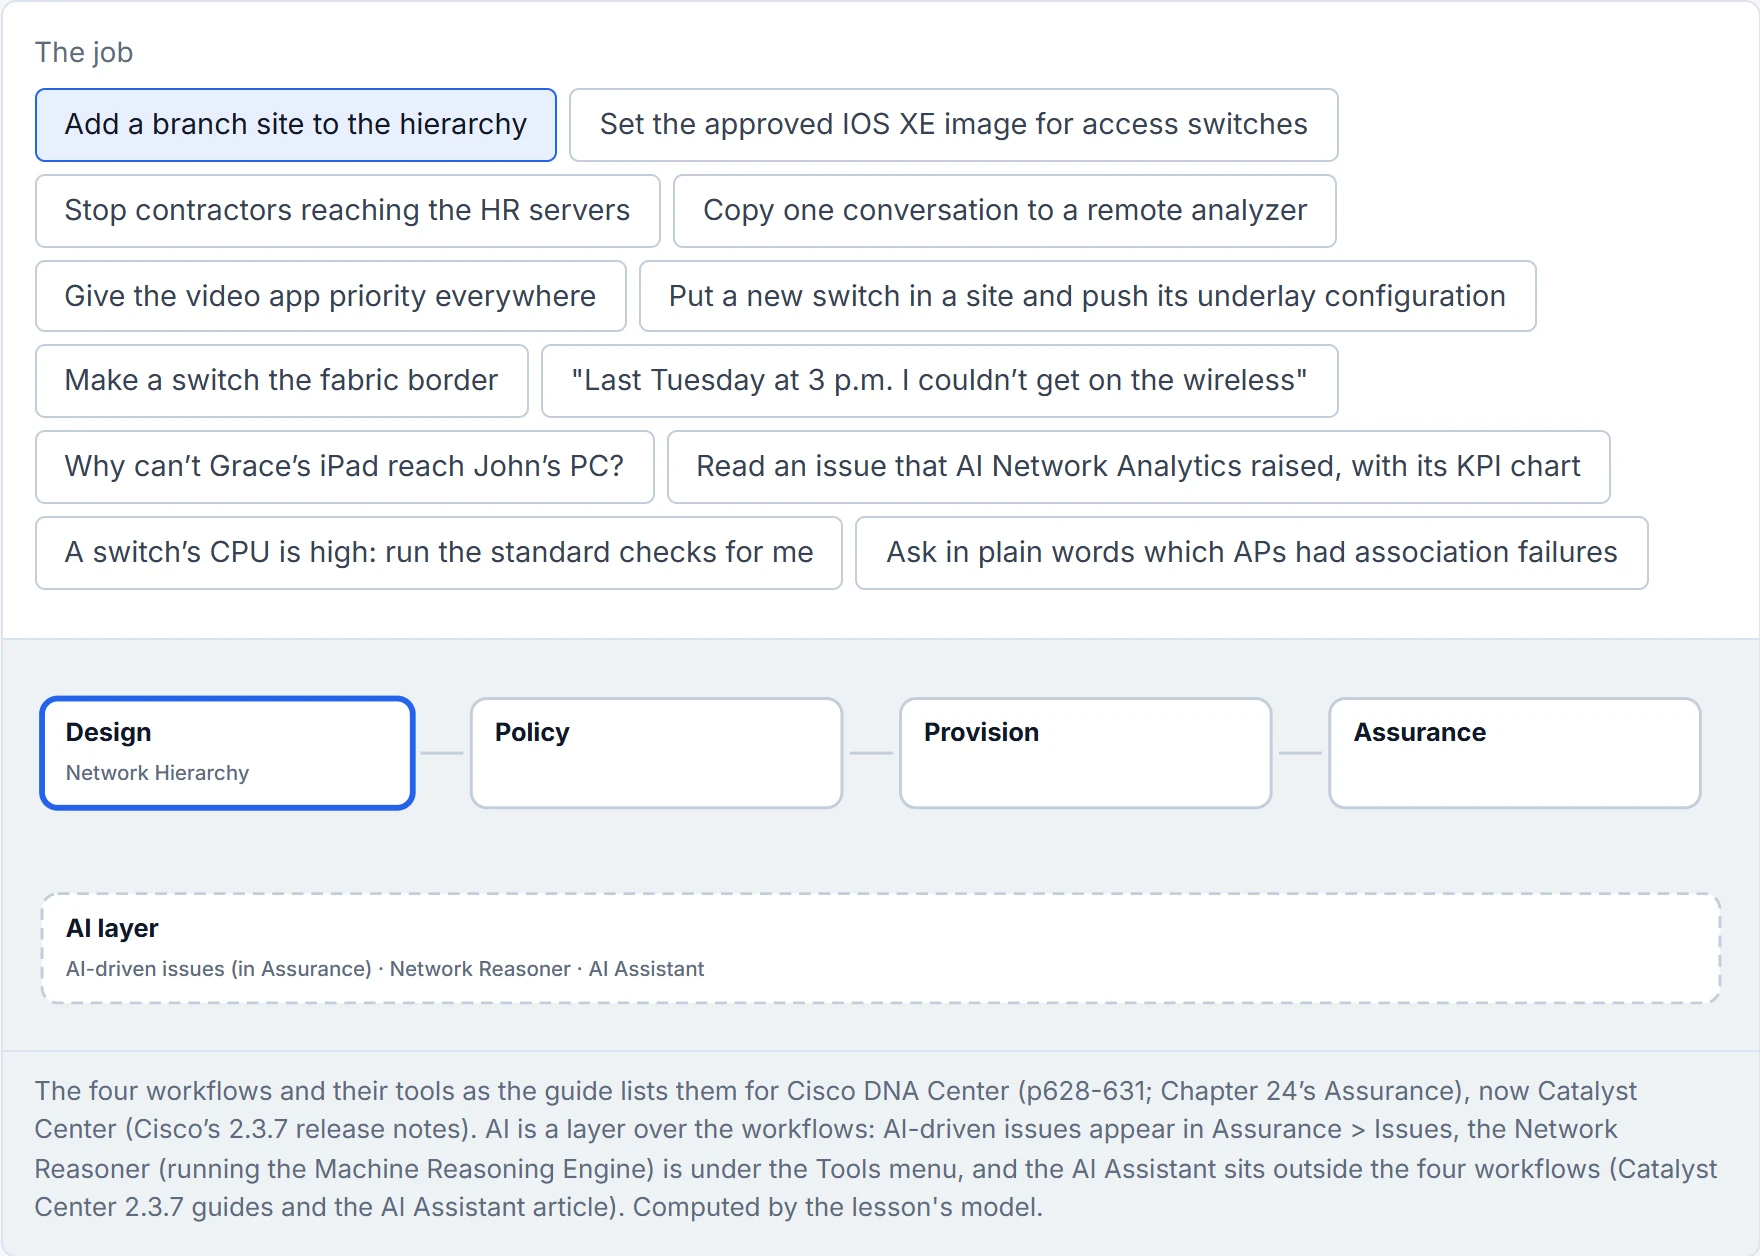
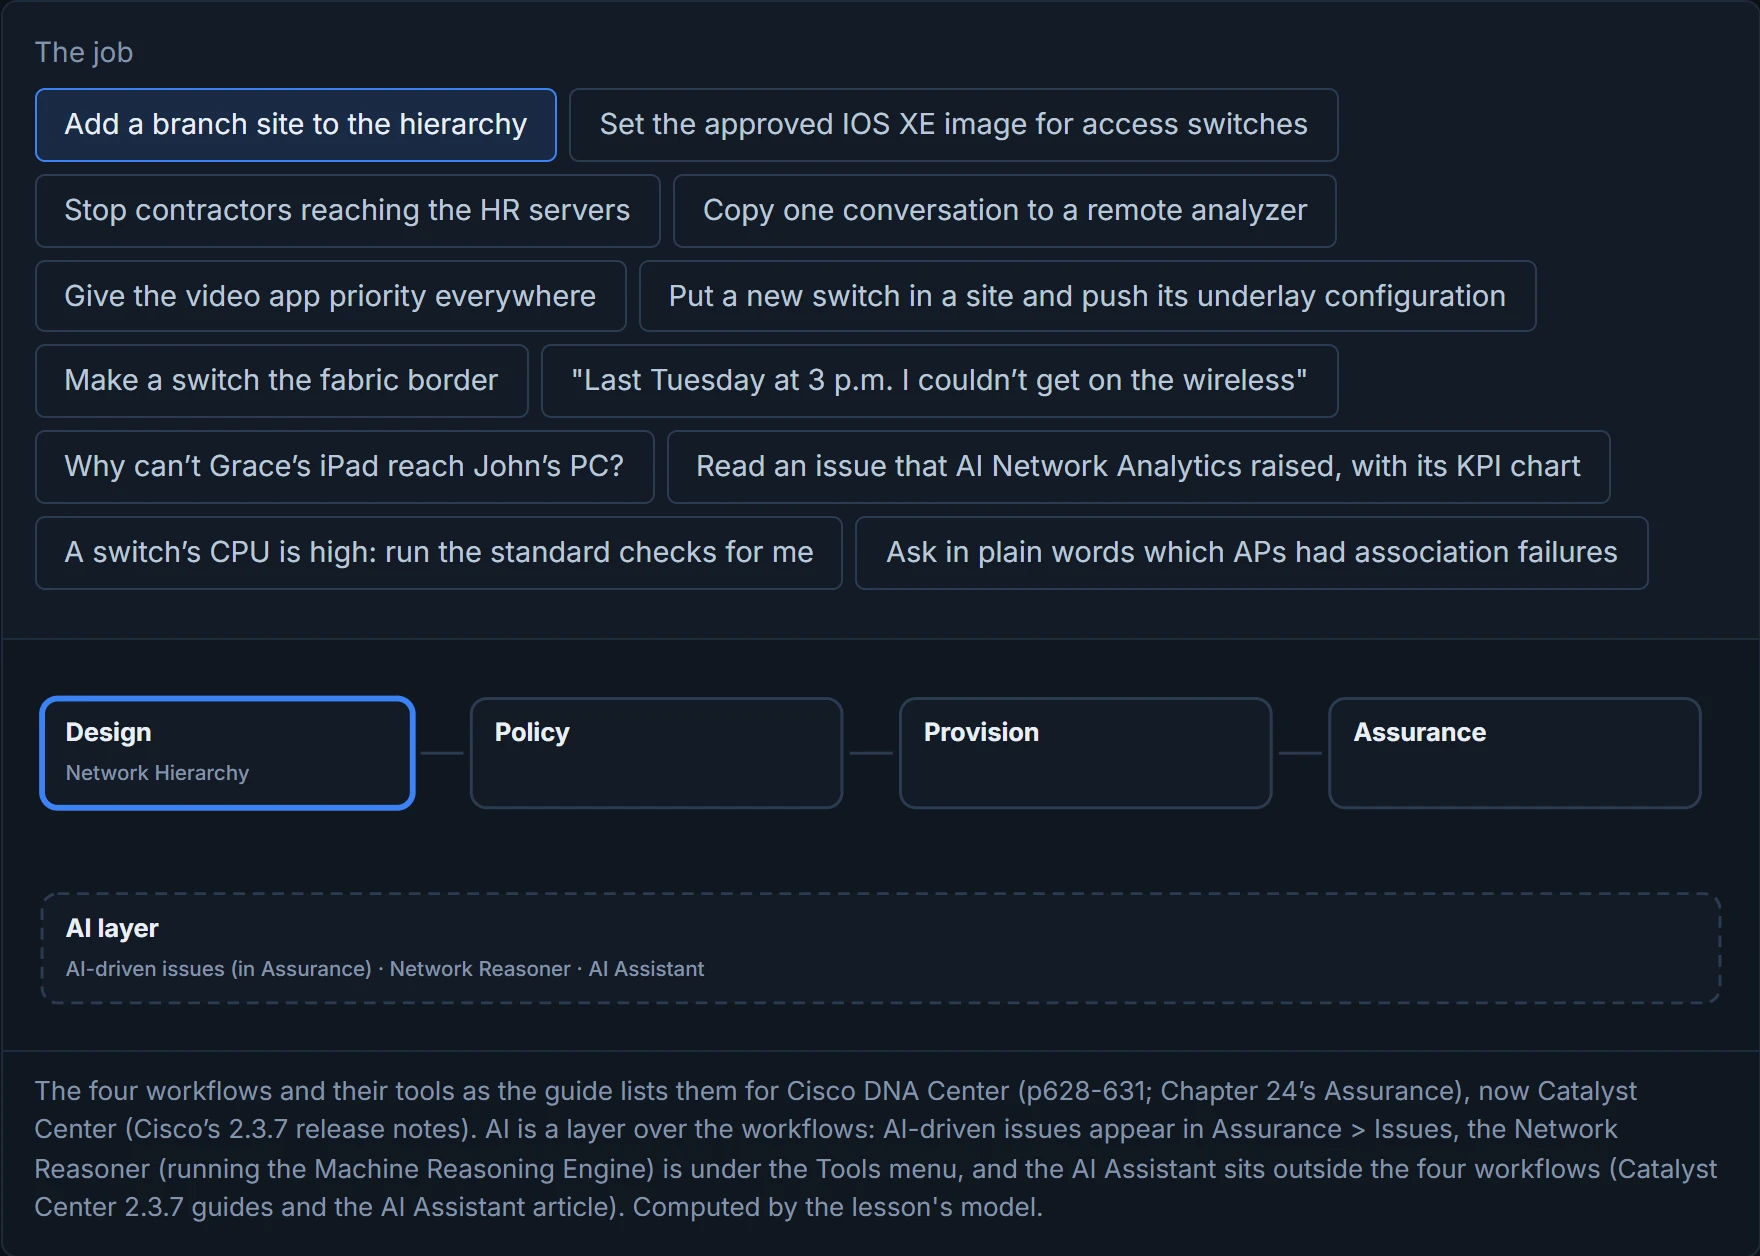
Policy, with Group-Based Access Control: the SGACLs Catalyst Center builds with ISE. SGACLs are the group-based policies you met in 06-4, filtering by group tag rather than IP address; TrustSec itself is 08-7. The approved image (Design, Image Repository, with Provision > Devices then updating each device) and the fabric border (Provision, Fabric Devices) take the same device through all four workflows in its life. Consider it your order of work: design before policy, policy before provisioning, and assurance for as long as the network runs.
The Policy workflow's Traffic Copy tool will set up ERSPAN for you, which saves typing monitor session 1 type erspan-source and all ten lines that follow it.
The guide starts with a familiar problem: by the time a ticket reaches the network team, the issue has gone, or the user reports something from last week. Assurance's answer is Network Time Travel, which "acts as a digital video recorder (DVR) for the network": it records the environment with streaming telemetry and plays back what happened, shows the present, and uses sensors for predictive analytics. That answers section 4.1: search for the user, open Client 360, and move the timeline back to Tuesday. It's like a dashcam: the moment you need is already on the recording.
What you see: overall health scores for devices and wired and wireless clients, and the top issues; Client 360, found by searching a user's name, showing their devices, type, OS, MAC, IPv4 address, VLAN, status, what they're connected to, the SSID and the last location, with a timeline of issues; Path Trace, "a visual traceroute and diagnostic tool" that "can be run periodically or continuously, with a specific refresh interval", and in the guide's example between two wireless clients reports an ACL on the edge switch (ACL 120 on Vlan120, result DENY) in the path from Grace's iPad to John's PC (how an ACL on an interface filters: 08-3); and issue pages with the problem, its impact and guided remediation steps. The guide says Assurance "uses machine learning to diagnose issues" and gives guided remediation; section 4.4 says what Cisco's current documentation means by that. Picture yourself at a garage where the mechanic plugs a reader into your car and shows you last month's fault codes: that's the idea.
The issues in the guide's screens are fixed-threshold issues: "Network Latency for Application 'WebEx' is Above the Threshold Value of 262ms", and "Onboarding took 123.4 seconds (expected time should be less than 10.0 seconds)". They fire when a measurement crosses a set line. Section 4.4 is about the other kind.
Network Time Travel means "it was broken last Tuesday" is finally a sentence the network team can't dismiss.
The v1.2 blueprint adds the AI layer. Cisco documents several features:
| Feature | What it does | Needs |
|---|---|---|
| AI Network Analytics | machine learning in a cloud platform builds a baseline of what's normal for your network, detects anomalies and trends, and compares you with peers | Advantage licence; HTTPS to the Cisco cloud; network events are "deidentified" before they're sent |
| AI-driven issues | issues "triggered based on deviations from the predicted baseline for your specific network environment" | AI Network Analytics; they arrive after cloud batch processing, up to 5 hours |
| Machine Reasoning Engine and Network Reasoner | "a network automation engine that uses artificial intelligence (AI) to automate complex network operation workflows", used from issues for Layer 2 loops, PoE and wired client problems; the Network Reasoner runs its checks (CPU, power supply, interface down, ping, and more) when you start them | the Machine Reasoning package and up-to-date knowledge packs; "a cloud-hosted knowledge base" |
| AI Assistant | "a conversational AI interface designed to help optimize network management and promote troubleshooting" | all licence tiers, with features following the tiers they use; registration to Cisco's cloud |
| AI-Enhanced RRM | "uses historical AI insights to adjust the wireless environment automatically" | not in the sources read |
| AI Endpoint Analytics | identifies endpoints for security | not in the sources read |
The difference that matters is between a fixed threshold and a baseline. A threshold says "more than 10 seconds is bad" wherever it's applied. A baseline learns "what is the normal (baseline) behavior for that specific network", so the same value can be normal at one hour of the week and abnormal at another. Think of it as a doctor who knows your usual blood pressure, against a chart on the wall with one number for everyone.
Predict before D2: onboarding slows from 1 to 6 seconds between midnight and 06:00 on Thursday. Which method notices?
D2
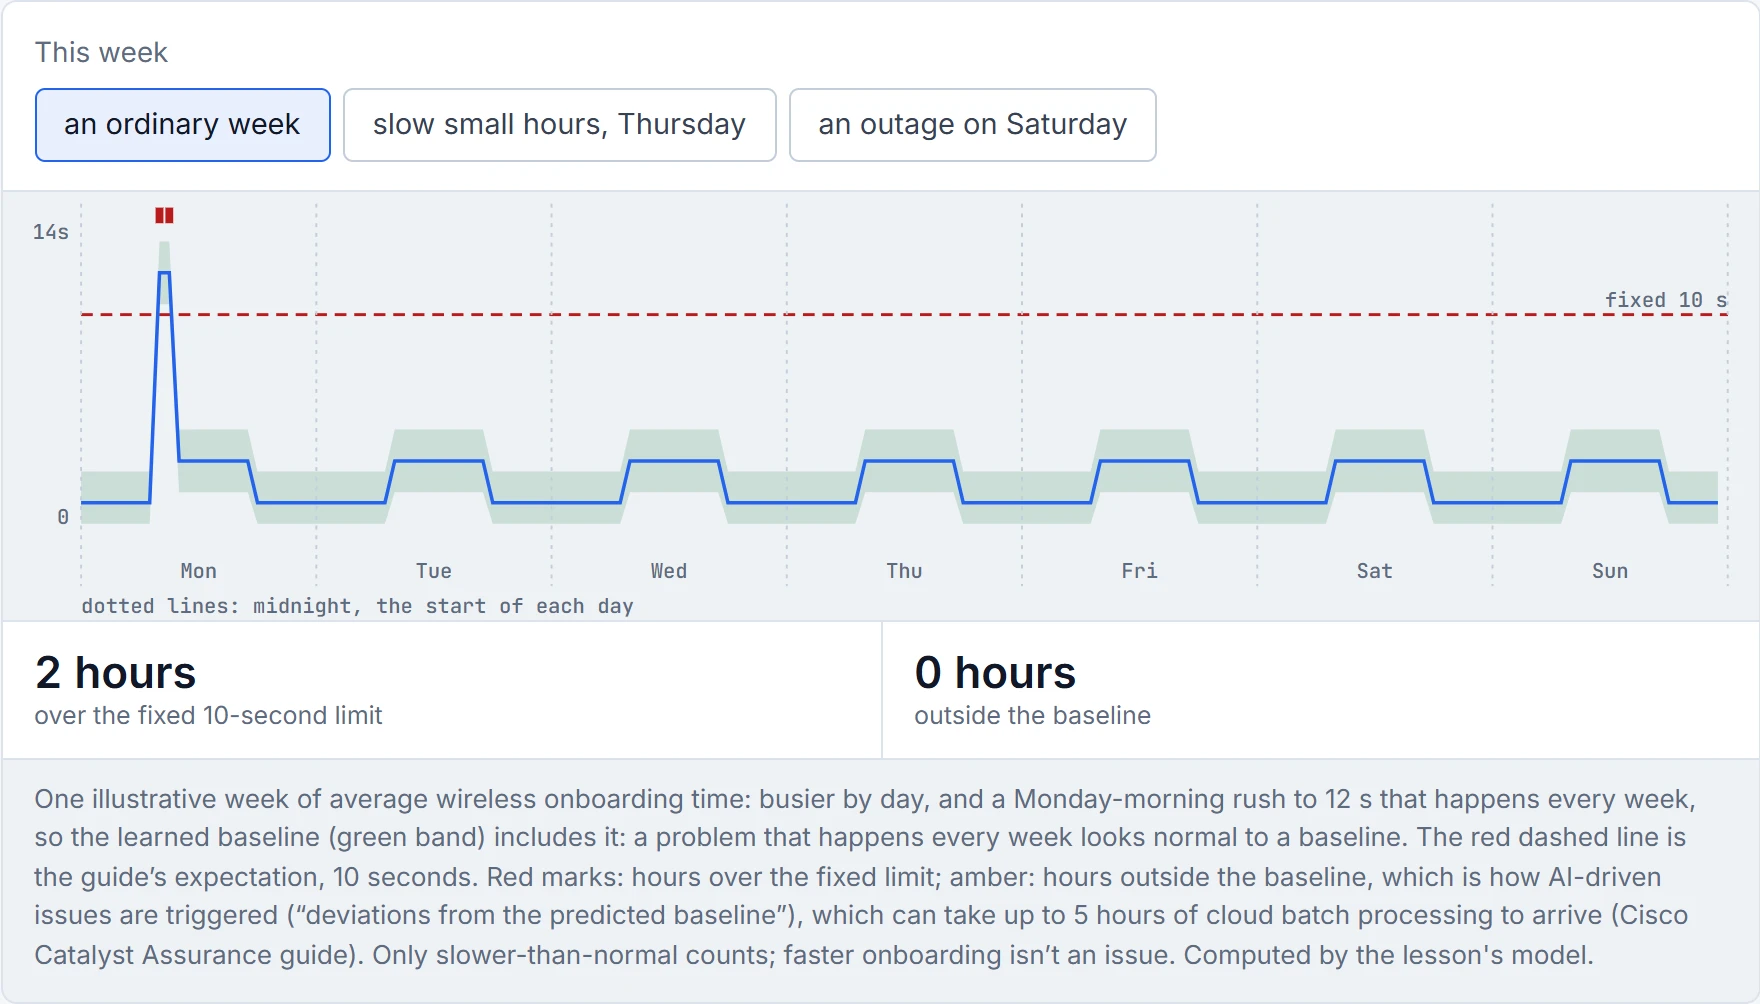
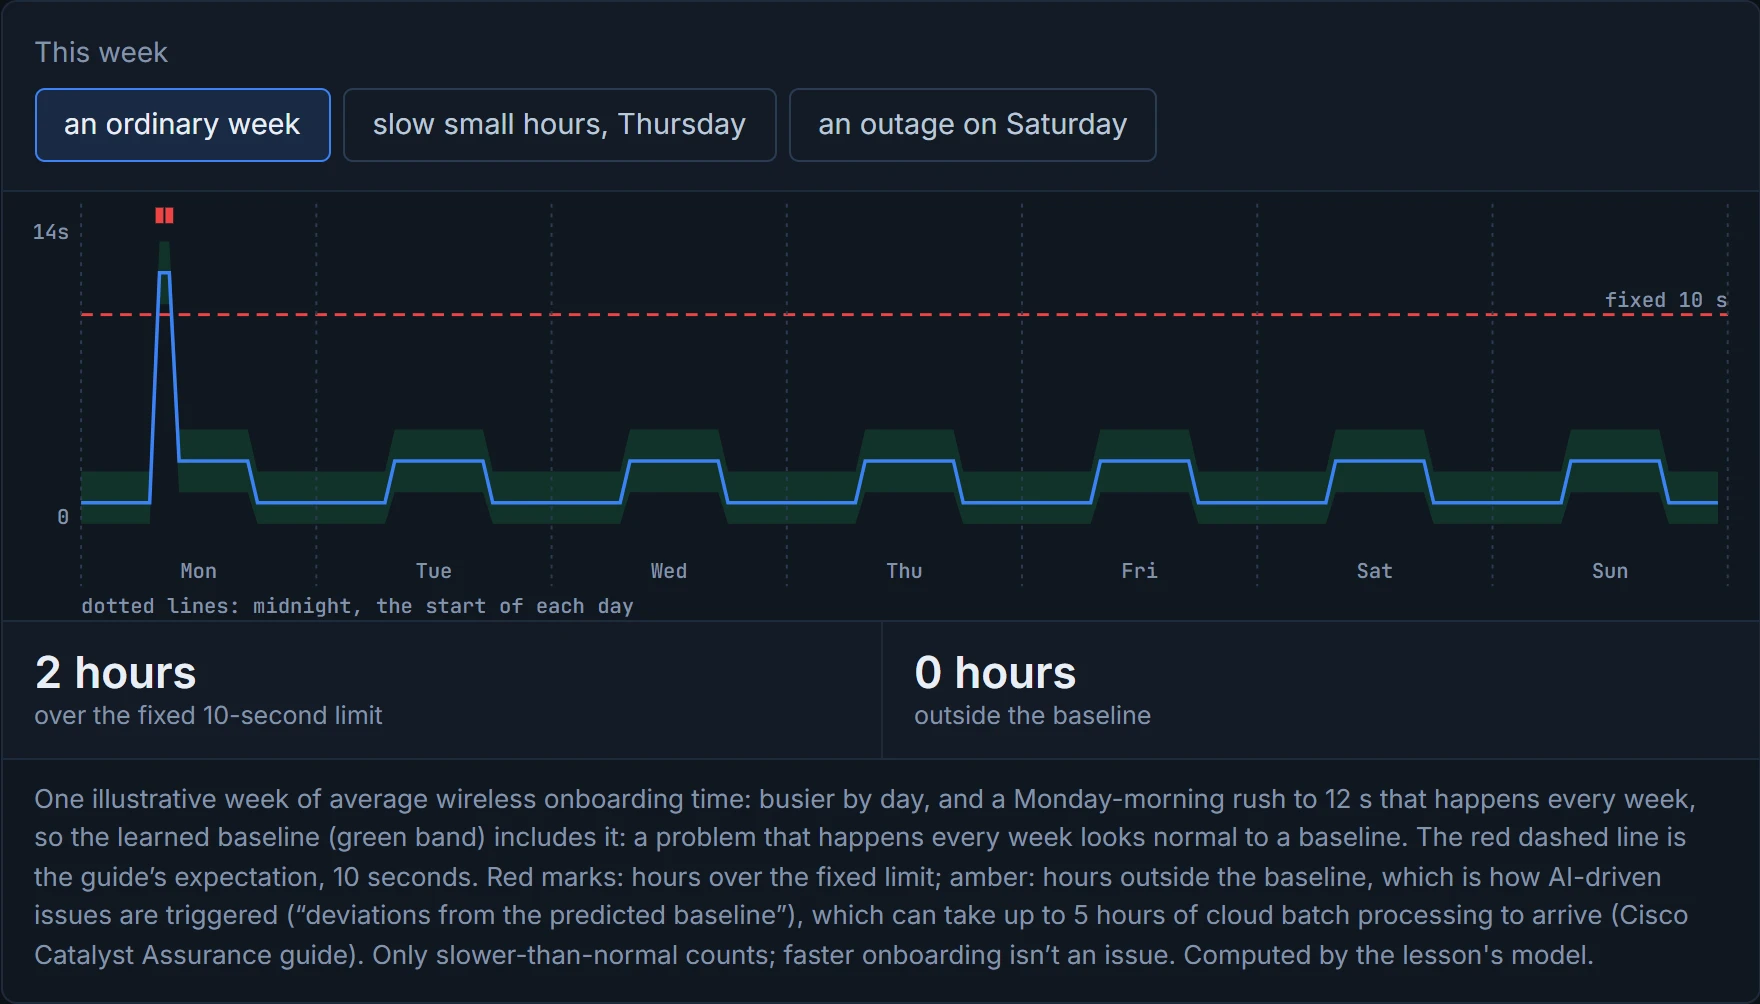
Only the baseline: 6 seconds is nowhere near the fixed 10, but it's far outside the band learned for that hour. Now look at Monday: users really wait 12 seconds every Monday morning, and the fixed limit says so every week, while the baseline has learned the rush and stays quiet. A baseline treats a problem that repeats as normal. That's why Catalyst Center keeps both kinds of issue: neither replaces the other. Both catch the outage; the AI issue can take up to 5 hours to arrive.
The AI Assistant comes with its own warning: "we recommend that you validate its suggestions and actions, especially for critical configurations or troubleshooting". The Network Reasoner runs only when you start it: "From the main menu, choose Tools > Network Reasoner", and it appears under Tools once the Machine Reasoning package is installed. The AI features advise and assist; you still decide. It's like a well-read new colleague: quick with an answer, worth listening to, and worth checking before you act on it.
Continue the lesson
The whole lesson, with its drawings and its questions. The rest of this section and 9 more after it.