
Debugs and conditional debugs
A debug is a running commentary: the router prints a message each time the code you switched on does something. It is not free: debugging can disrupt a busy router, and console output is prioritised ahead of other work. Pick the debug, and the end of the link, that will name the fault, narrow noisy debugs with an access list or a condition, and stop them with undebug all.
By Arif, founder of Daveth · Updated
The full 9 min walkthrough is in Daveth Pro (Network). See what the plan opens
What this page answers
Is it safe to run debug on a Cisco router?
Carefully. Cisco warns that debugging can disrupt router operation, especially under heavy load, and that console output is prioritised ahead of other functions, so excessive debugs to the console can hang it. Stop them with undebug all. Read it in “4.1 What a debug costs”
How do you limit debug output?
With an access list, as debug ip packet 100 prints only the packets list 100 permits, or with a conditional debug, which keeps a noisy debug quiet. Each filter has its own blind spots, and the lesson shows what each cannot show you. Read it in “4.1 What a debug costs”
4.1 What a debug costs
show commands give you a snapshot. A debug gives you a running commentary: the router prints a message each time the code you switched on does something. The guide uses them to find OSPF adjacency faults in seconds that would take a while to spot by reading configurations on several routers.
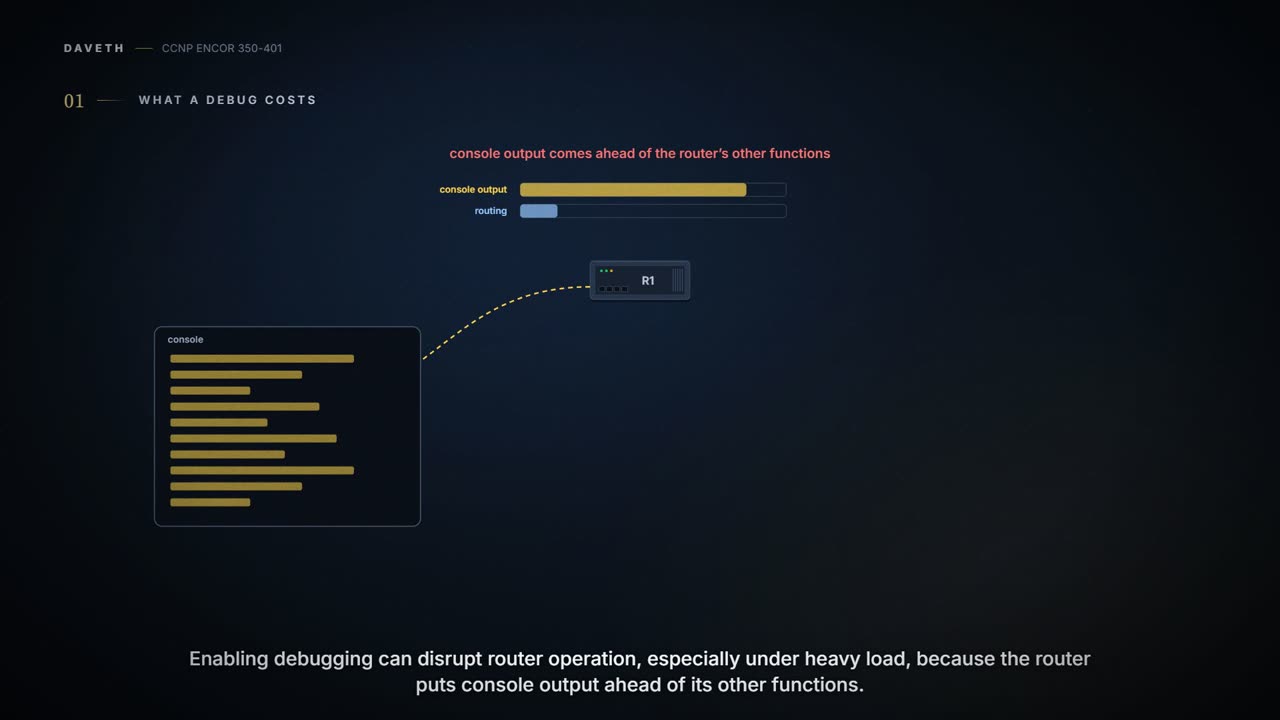
The commentary isn't free. Cisco's warning: "Enabling debugging can disrupt router operation, especially when the network is under heavy load", and because "the router automatically prioritizes console output ahead of other router functions", excessive debugs to the console can hang it. It's like a chef reading every order aloud to the whole restaurant while trying to cook them: the reading wins, and dinner waits. The guide adds the history (older boxes with less memory and CPU could become unresponsive or crash, even cause an outage, especially with several debugs running at once) and the habit: practise a debug in a test environment before you run it in production.
So run it the careful way:
- Keep debug messages off the console: Cisco recommends
no logging consoleunder normal conditions, andlogging bufferedcopies messages to an internal buffer instead. You can think of it as writing in a notebook instead of shouting through a megaphone. (Where messages go, and at what level, is 07-4.) - Timestamp them to the millisecond:
service timestamps debug datetime msec. The guide's outputs carry exactly those timestamps (19:20:42.559). - Stop it:
undebug all(orno debug all), and check withshow debug. The guide'sun allis the same command, abbreviated.
The console gets priority over routing, which makes a debug on a busy router the only commentary that can stop the match.
The guide's three faults all sit on the R1-R4 link in Figure 24-2: MTU issues, "incorrect interface types" (a network type mismatch, which shows up as mismatched hello timers) and an improperly configured mask. From R1 they look different, and none of them says why: with the MTU fault show ip ospf neighbor has R4 flicking between INIT and EXCHANGE, with the mask fault it's stuck in INIT, and the guide doesn't show R1's table for the timer fault. That's what show ip ospf neighbor proves: the adjacency isn't FULL, not why. The debug that names the cause depends on the fault, and so does the router you run it on.
MTU. debug ip ospf adj shows the adjacency messages. On R1: "Rcv DBD from 4.4.4.4 ... mtu 1400 state EXCHANGE" and "Nbr 4.4.4.4 has smaller interface MTU"; on R4 the mirror image, "Nbr 1.1.1.1 has larger interface MTU", with R4 stuck in EXSTART retransmitting its DBD. The rule behind it: a router rejects a Database Description packet whose Interface MTU is larger than it can accept on that interface without fragmentation. So R4, the smaller side, is the one refusing. MTU isn't carried in a hello, so debug ip ospf hello shows a healthy neighbour here.
Hello timers (the guide's "incorrect interface types"). debug ip ospf hello on R1 looked normal: hellos sent to 224.0.0.5 every 10 seconds. On R4 the fault was named in one line: "Mismatched hello parameters from 192.168.14.1", "Dead R 40 C 120, Hello R 10 C 30", R for received, C for configured. show ip ospf interface on R4 explained why: its Ethernet0/1 was point-to-multipoint, whose timers differ from broadcast's. That's what show ip ospf interface proves: this side's network type and timers, not the neighbour's:
| Network type | Hello (s) | Dead (s) |
|---|---|---|
| Broadcast | 10 | 40 |
| Non-broadcast | 30 | 120 |
| Point-to-point | 10 | 40 |
| Point-to-multipoint | 30 | 120 |
By default the dead interval is four times the hello. ip ospf network broadcast on R4 brought the adjacency to FULL. Why did R1 see nothing? R4 sends a hello every 30 seconds and the guide's capture on R1 lasted about 15, so it may simply have missed one. Just like when you phone a friend who only checks messages every half hour: fifteen seconds of silence tells you nothing about them.
Subnet mask. With both debugs on, R1 showed only a hint: "No more immediate hello for nbr 4.4.4.4, which has been sent on this intf 2 times". R4 named it: "Dead R 40 C 40, Hello R 10 C 10 Mask R 255.255.255.0 C 255.255.255.248". Timers matched; the mask didn't. OSPF checks the mask, hello and dead interval in every hello and drops the packet on any mismatch, except that point-to-point links and virtual links ignore the mask. Changing R4's mask to /24 fixed it. The adjacency debug printed nothing in this case: the hellos never got far enough to start one.
Before D2, work it out from the hello-timer case above: which router, and which debug, names the mismatch?
D2
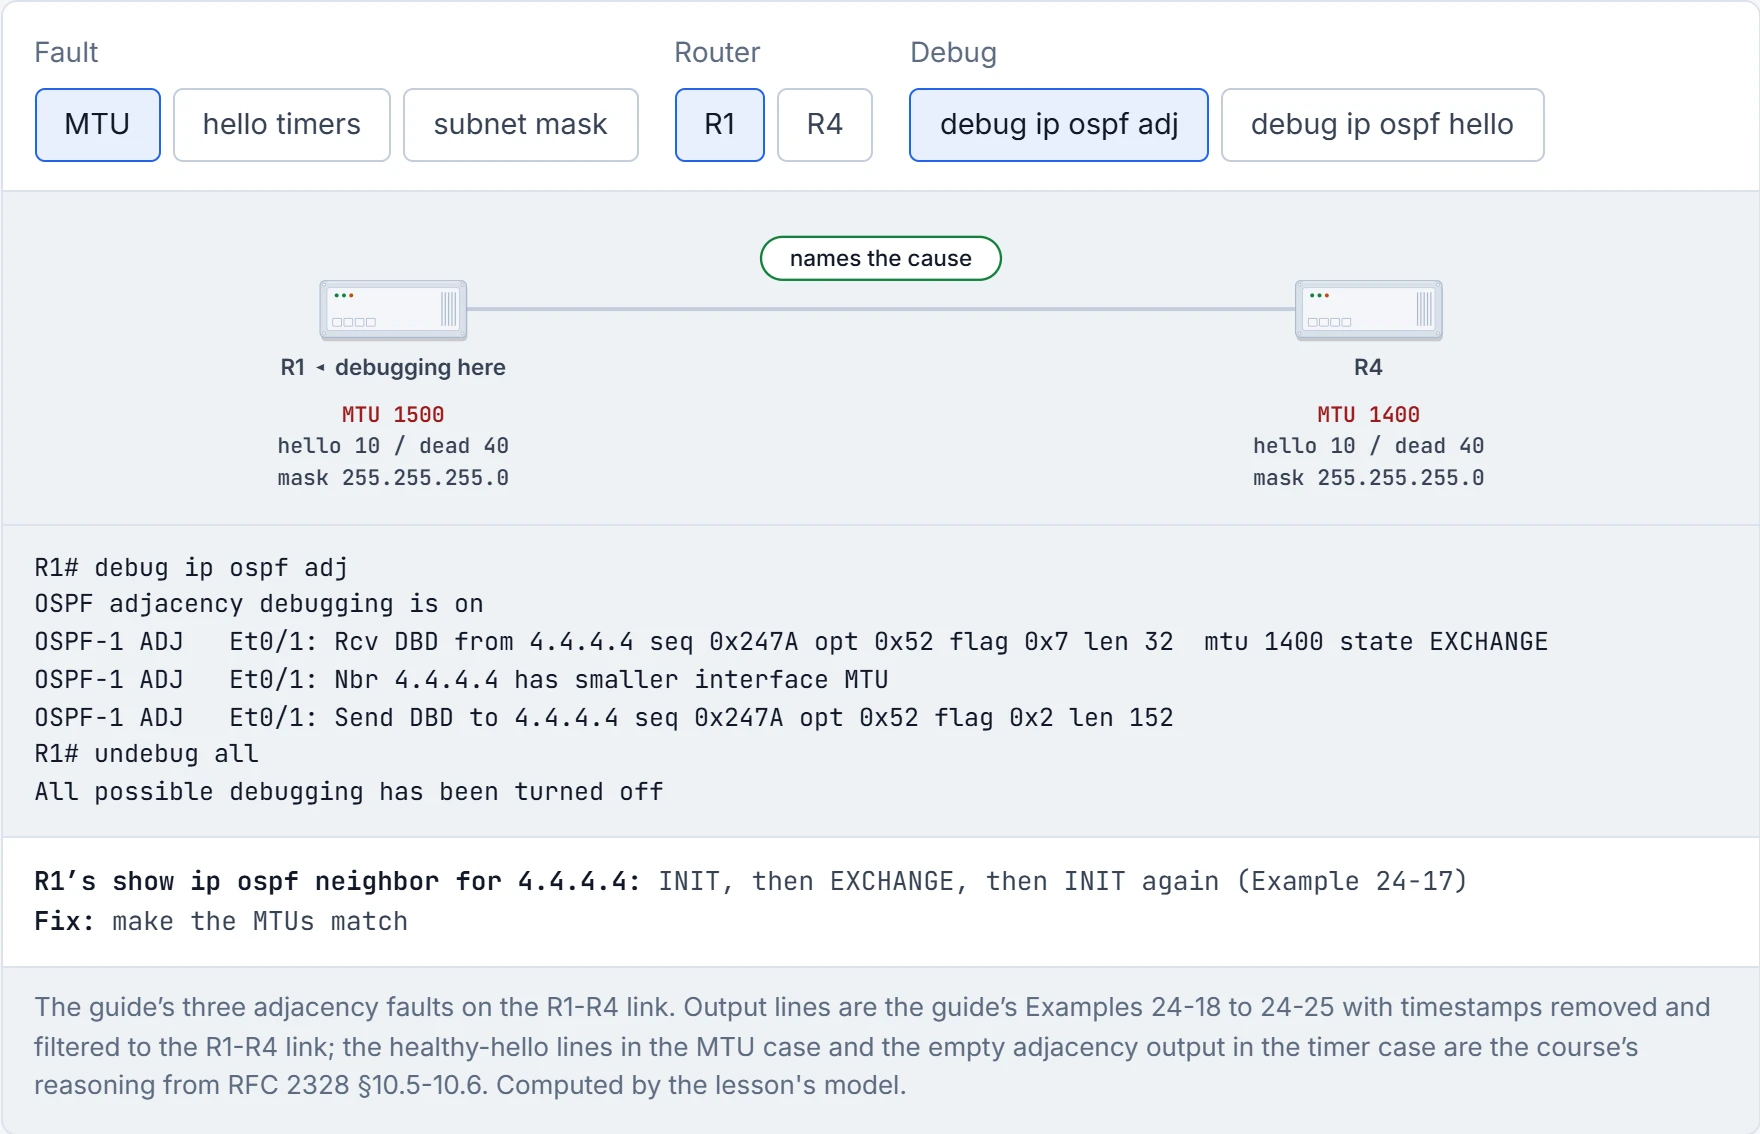
R4 with debug ip ospf hello: the receiving side of the bad hello is the side that complains. Consider it your rule of two ends: when one end's debug looks clean, run it on the other before you believe it.
R1 listening to hellos for fifteen seconds and declaring the link healthy is like checking the post at six in the morning and concluding nobody ever writes to you.
Some debugs are noisy by nature. debug ip packet prints IP packets, and on a production router that can be "a tremendous number of messages". Two things narrow it.
An access list. debug ip packet 100 prints only the packets list 100 permits. The guide's list permits anything to or from 192.168.14.0/24, in two lines, one per direction. Cisco calls this the best way to limit the output. The guide calls list 100 a "standard access list", but lists 100 to 199 are extended (numbered ACLs: 02-12); the guide lists the ranges <1-199> and <1300-2699> for the command. It's a bit like a bouncer with a guest list: only the names on the list get in, and everyone else is simply not announced.
A condition. debug interface Loopback0 (the guide's form; the command reference documents debug condition interface, so check in the lab which your release accepts) answers "Condition 1 set". With a condition set, the router prints debug messages only "for packets entering or leaving the router on a specified interface". Set two and the rule is OR: "output is displayed if at least one condition matches". Picture yourself watching a building's security cameras: a condition picks which doors you watch, and anyone who never passes one of those doors never appears on screen.
show debug shows both: "IP packet debugging is on for access list 100" and "Condition 1: interface Lo0 (1 flags triggered)". With both in place, R1's ping from 192.168.14.1 to 4.4.4.4 prints and the OSPF chatter on the same subnet doesn't.
Reading the lines: s= and d= are the source and destination, with the interface in brackets; (local) marks a packet the router generated itself; rcvd one it received; sending broad/multicast a multicast it sent, such as an OSPF hello to 224.0.0.5; and in Example 24-28, routed via RIB and stop process pak for forus packet show the ping arriving for the router's own address.
Two traps. First, undebug all turns the debugging off but leaves the condition behind; you remove it with undebug interface loopback0. Removing the last condition asks for confirmation, with the warning "Removing all conditions may cause a flood of debugging messages to result, unless specific debugging flags are first removed", because once no condition is left, debugging output resumes for all interfaces. Second, debug ip packet shows process-switched packets: "fast-switched and Cisco Express Forwarding (CEF)-switched packets are not displayed", and Cisco's other note says CEF traffic doesn't appear "unless forwarding is forced into the process-switching path". So traffic passing through on the fast path is normally invisible to it, whatever your filter says; what you do see is mostly traffic to and from the router itself.
Before D1, work it out from this section: ACL 100 and a Loopback0 condition, six packets arriving at or leaving R4. How many print?
D1
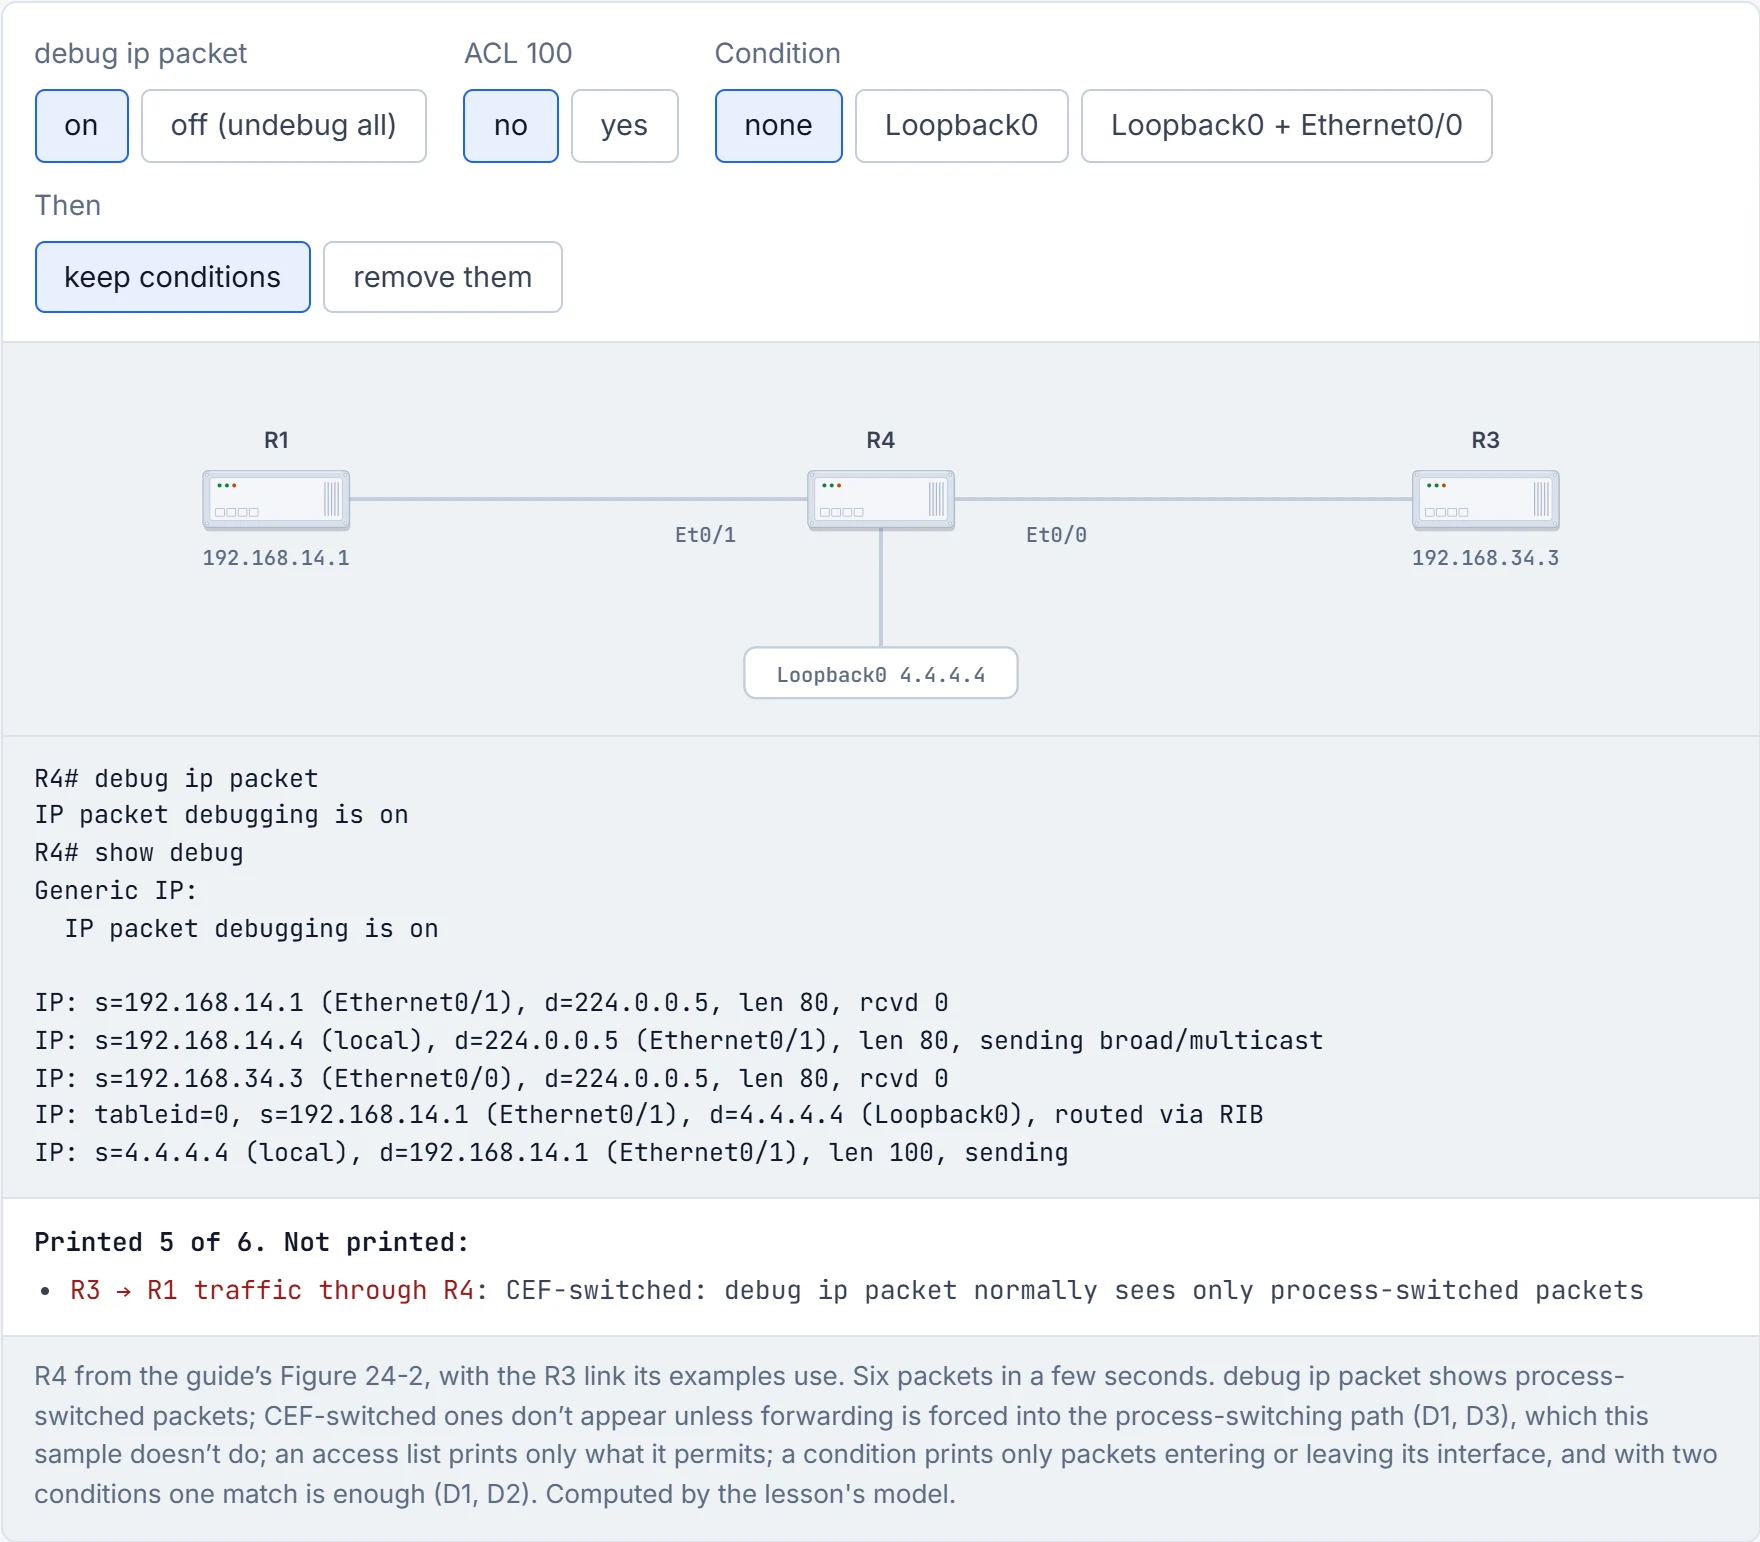
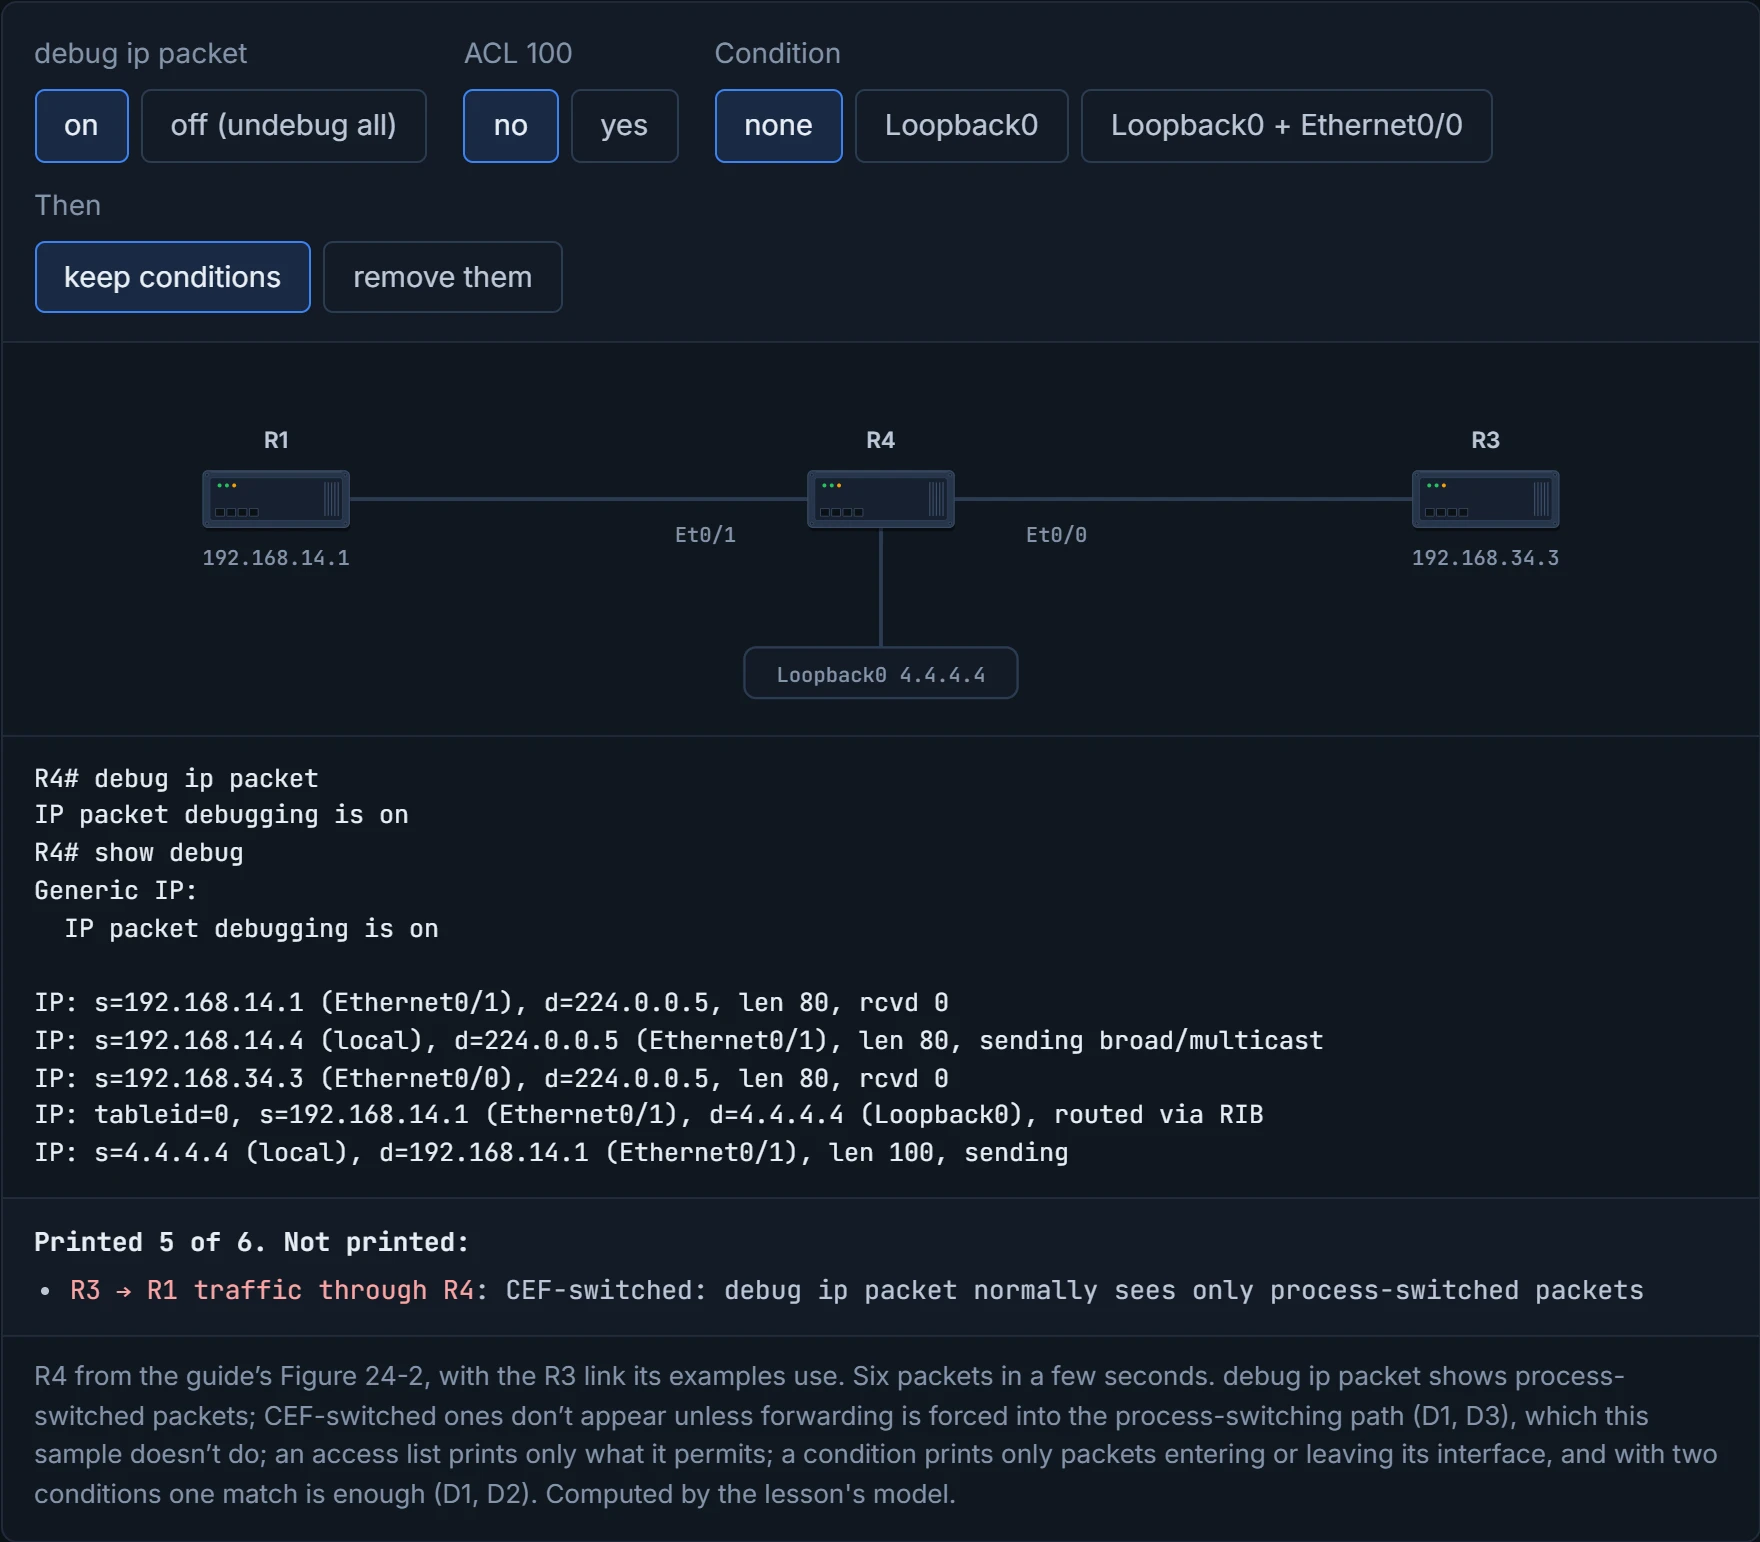
One: the ping arriving for 4.4.4.4, the guide's result. The echo reply leaves by Ethernet0/1, not Loopback0, so the condition doesn't match it. Now take away the ACL, set both conditions, then choose "remove them" with debugging still on: every process-switched packet comes back, and the transit traffic still doesn't show.
undebug all switching off every debug but keeping the conditions is the router's way of saying "I've stopped talking, but I'm still listening at the door".
IOS XE Catalyst switches have their own version. Cisco's 9300 guide for 17.9: conditional debugging lets you "selectively enable debugging and logging for specific features based on the set of conditions you define", a condition being "a feature or identity, where identity could be an interface, IP Address, or a MAC address". It acts kind of like a tracking number on a parcel: you name one thing and follow it everywhere it goes.
The catch is in the note: "MAC address is the only supported condition" on that platform and release. The supported features are narrow too: IGMP snooping and Layer 2 multicast. You set it with debug platform condition mac and debug platform condition start (and stop to end it), watch it with show platform condition and show platform software trace, and clear it with clear platform condition all. Radioactive tracing is the engine underneath: it "provides the ability to stitch together a chain of execution for operations of interest across the system, at an increased verbosity level ... across threads, processes and function calls". The output goes to trace files, not the console, and only control-plane tracing is supported. Radioactive tracing works like the dye a plumber pours in to see where a pipe really runs: add it at one point and follow it everywhere it goes.
On a 9300 running 17.9 you can condition on anything you like, provided what you like is a MAC address.
A debug is evidence from inside the router, which makes it strong and narrow at once. If you've ever had a doctor listen to your chest and pronounce your knee fine, you know the problem:
| Output | Proves | Doesn't prove |
|---|---|---|
show ip ospf neighbor not FULL | the adjacency isn't up | why: that's the debug's job |
show ip ospf interface | this side's network type, timers and state | the neighbour's settings |
a mismatch line in debug ip ospf hello | this router received a hello whose timers or mask differ from its own, and dropped it | which side is misconfigured: "R" and "C" only say which is which here |
a clean debug ip ospf hello capture | nothing arrived that this router objected to, in this window | that the neighbour's hellos are fine: they may not have arrived yet, or the other end may be complaining |
Nbr ... has smaller/larger interface MTU | the DBDs carry different MTUs | that the MTU is the only fault |
no lines from debug ip packet | nothing process-switched matched the ACL and conditions | that no such traffic crossed the router: CEF-switched traffic normally isn't shown |
show debug lists no debug flags | nothing is being debugged | that it's clean: read the Condition lines, which survive undebug all |
undebug interface ... accepted | that condition is gone | that the flags are off: with flags on, removing the last one floods |
no logging console, logging buffered configured | debug messages go to the buffer, not the console | that the buffer is big enough to hold them (07-4) |
show platform condition shows the MAC | the condition is set | that the feature you care about is supported (Cisco's 9300 guide names IGMP snooping and Layer 2 multicast) |
show platform software trace | what radioactive tracing wrote to its trace files for the condition | anything outside the supported features and the control plane: only control-plane tracing is supported |
| a debug that ran cleanly in the lab | the command is safe at lab load | that it's safe on a busy production box |
Continue the lesson
The whole lesson, with its drawings and its questions. The rest of this section and 9 more after it.