
IP SLA
IP SLA is built into IOS and monitors the network with active traffic on a schedule you set: delay, jitter, loss, connectivity, the path per hop and download time. Unlike a provider's SLA, it runs end to end from your device to your destination. An operation is defined with ip sla and a number, then scheduled with ip sla schedule.
By Arif, founder of Daveth · Updated
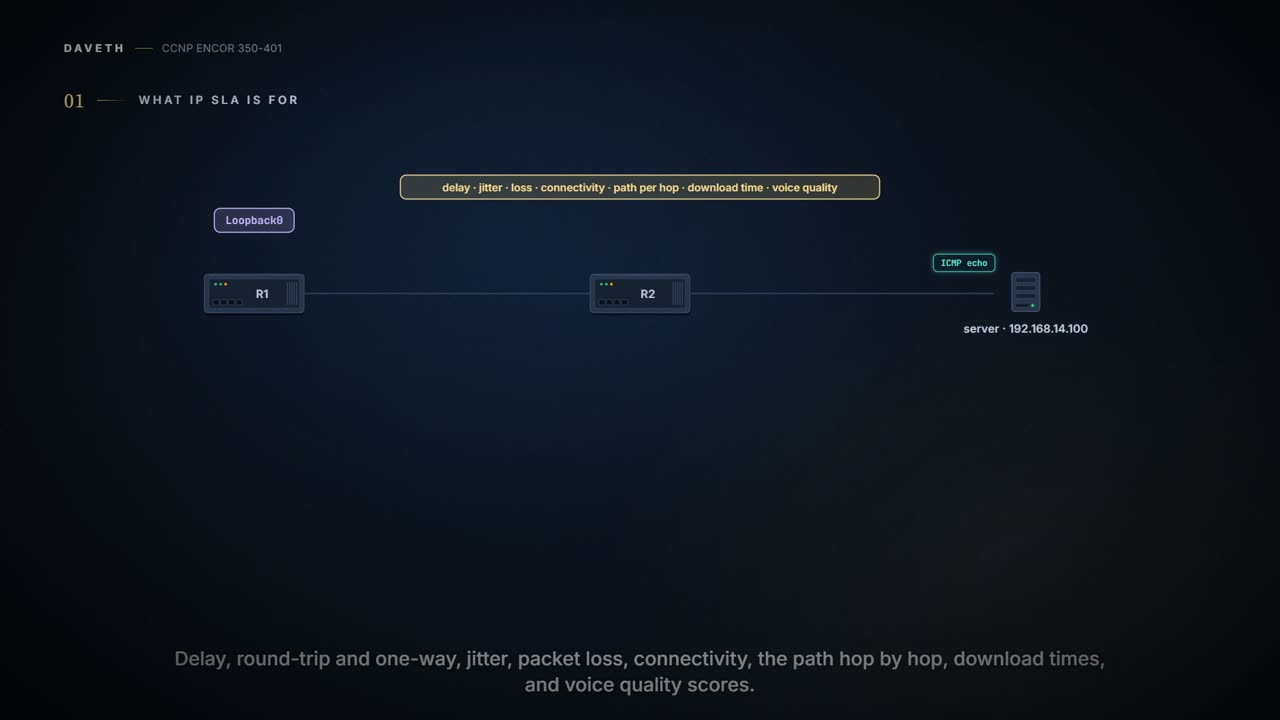
The full 7 min walkthrough is in Daveth Pro (Network). See what the plan opens
What this page answers
How do you configure IP SLA on Cisco IOS?
ip sla operation-number, then the operation, such as icmp-echo with a target, a source interface and a frequency in seconds; then ip sla schedule operation-number life forever start-time now. Read it in “4.1 What IP SLA is for”
What can IP SLA measure?
Round-trip and one-way delay, jitter, packet loss and connectivity, packet sequencing, the path per hop, server or website download time, and voice quality scores, end to end from your device. Read it in “4.1 What IP SLA is for”
4.1 What IP SLA is for
IP SLA has pinged the server every 5 minutes for a day: 288 successes, 0 failures. Did the path ever go down? Keep that one for section 4.4.
IP SLA is built into IOS and monitors the network on a schedule you set: delay (round-trip and one-way), jitter, packet loss and connectivity (each directional), packet sequencing, the path per hop, server or website download time, and voice quality scores. Cisco's own definition: it "uses active traffic monitoring--the generation of traffic in a continuous, reliable, and predictable manner--for measuring network performance". A provider's SLA covers only its own network; IP SLA runs from your device to your destination, end to end. It's like posting a parcel to yourself instead of trusting the courier's report on its own depot-to-depot leg: you test the whole trip, door to door.
The target can be another Cisco device or any IP device, a server for instance. Some operations work better with a responder on a Cisco target: it time-stamps a probe when it arrives and again when it leaves, "eliminating the processing time", though it isn't needed for every operation. One-way measurements need both ends on NTP, synced to the same source. The guide's ICMP echo can't give one-way delay at all: it measures the round trip ("Round Trip Time (RTT)" in its statistics). You can think of it as two stopwatches: a one-way time is only as good as their agreement.
IP SLA is the network's way of checking on itself every few minutes, like a nervous parent at a sleepover, and just as blind to what happens in between.
The guide's operation pings the server at 192.168.14.100 from R1's Loopback0 every 300 seconds:
ip sla 1
 icmp-echo 192.168.14.100 source-interface Loopback0
 frequency 300
ip sla schedule 1 life forever start-time now
ip sla operation-number enters IP SLA configuration; a device can run many operations, each with its own number. icmp-echo {destination-ip-address | destination-hostname} [source-ip ... | source-interface ...] names the target and the source, and frequency seconds how often it runs. Nothing happens until it's scheduled: ip sla schedule operation-number [life {forever | seconds}] [start-time {... | pending | now | after hh:mm:ss}] [ageout seconds] [recurring]. Cisco describes the operation as measuring "end-to-end response time between a Cisco router and any devices using IP", and it works for IPv6 targets too. Optional settings include threshold, timeout, tos (or traffic-class for IPv6) and vrf. The operation number works like a label on a separate alarm clock: each operation has its own, set and started on its own, and they all ring independently.
The frequency is a choice with consequences. Consider it your night watchman's rounds: a burglar who comes and goes between two rounds leaves nothing in the logbook.
Predict before D1: at the guide's 300 seconds, is a 4-minute outage caught?
D1
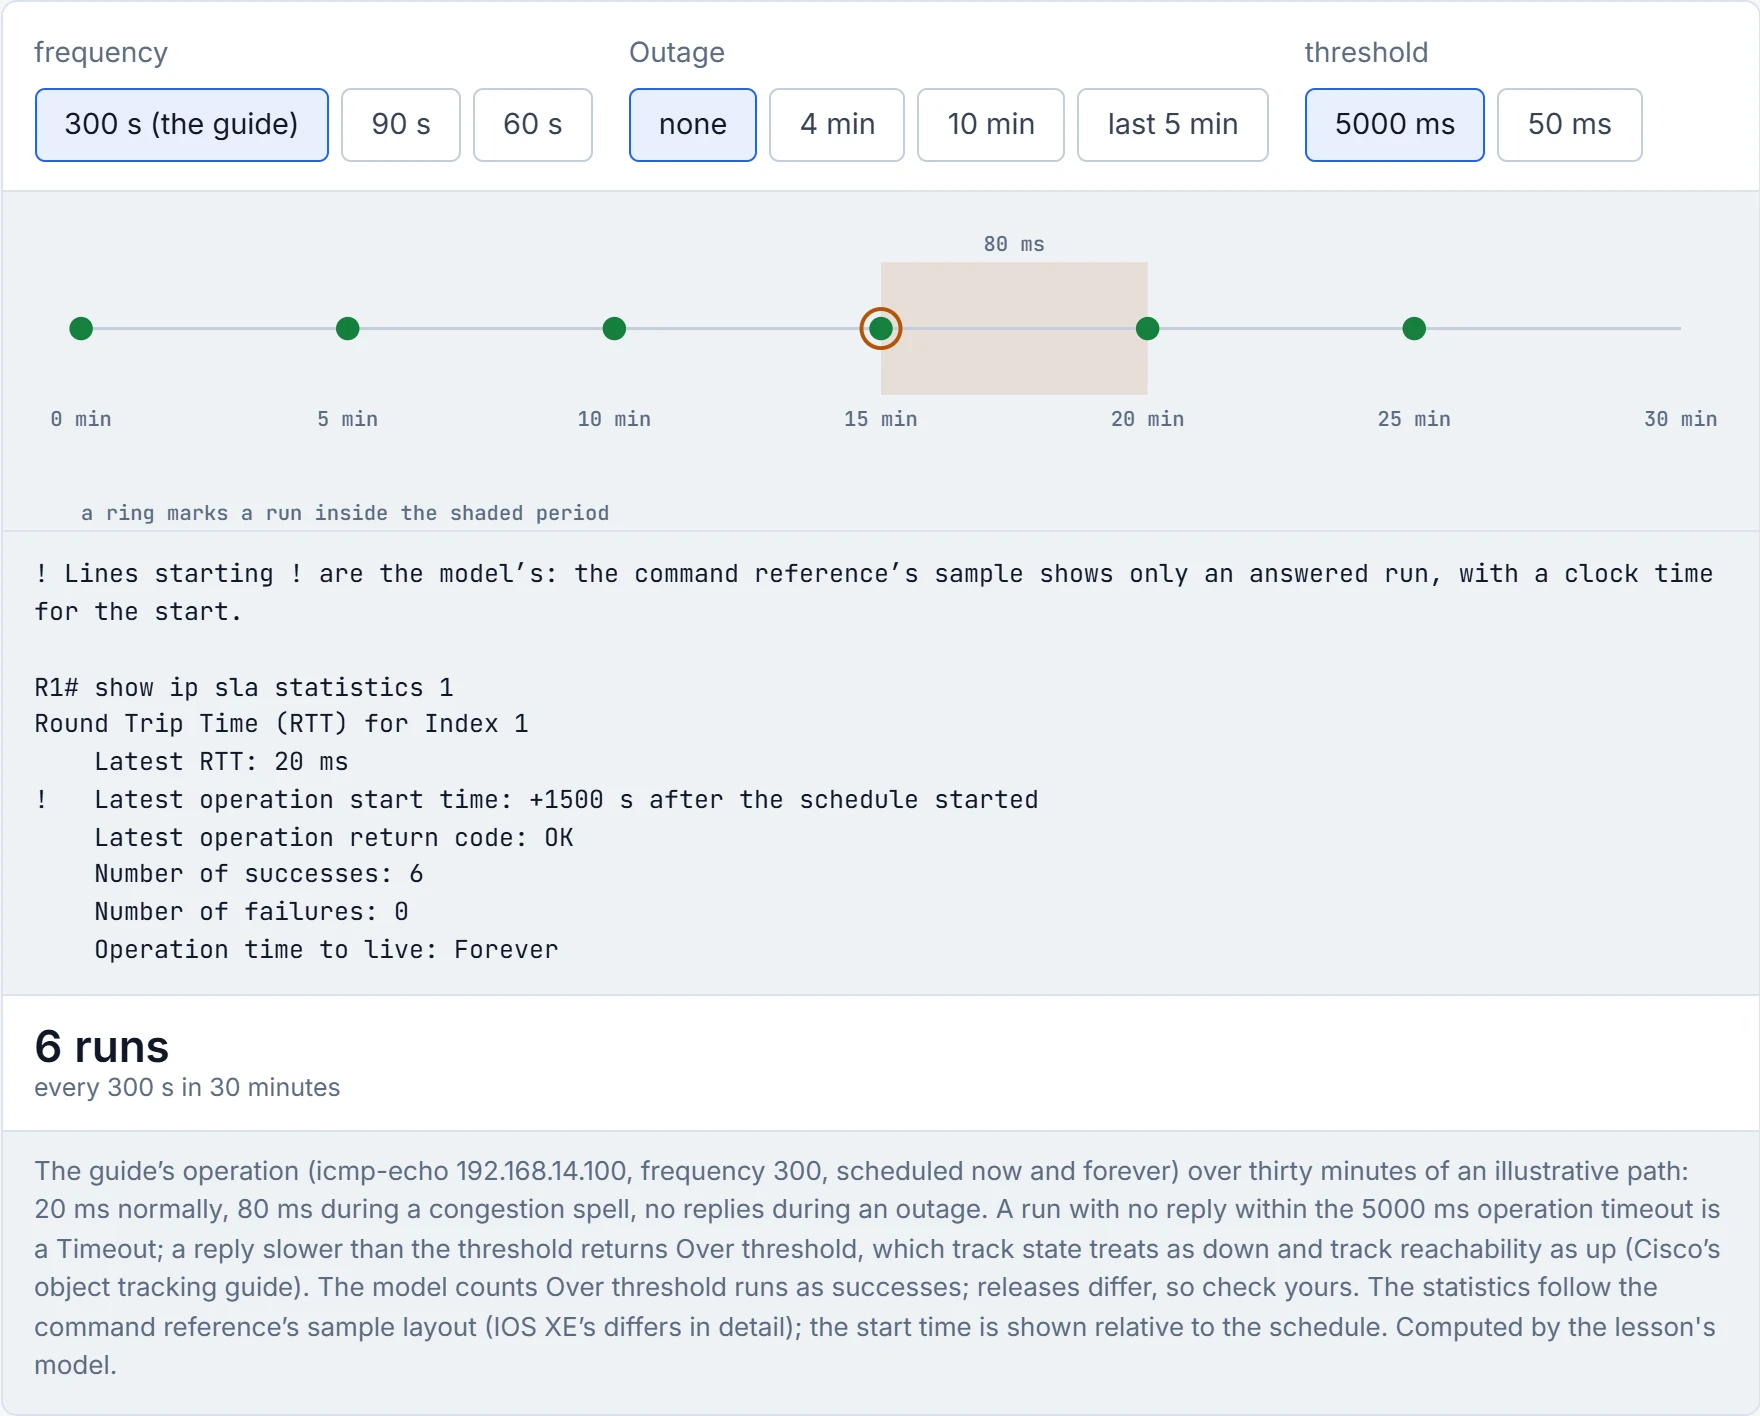
Not this one: the runs at 5 and 10 minutes fall either side of it, and the statistics show only successes. At 60 seconds it's caught four times. The 10-minute outage is caught even at 300, because it spans two runs. The general rule: an outage at least as long as the frequency always catches a run; a shorter one is caught with a chance of about its length over the frequency (240 s against 300 s: 80%), so this example shows the unlucky fifth. The reverse also happens: one lost probe is a failure though the path never went down.
An IP SLA operation without ip sla schedule is the most reliable monitor on the network: it has never once reported a problem.
To check a web server rather than a path, the guide uses HTTP GET:
ip sla 2
 http get http://192.168.14.100
 frequency 90
ip sla schedule 2 start-time now life forever
The general form is http {get | raw} url [name-server ip-address] [version version-number] [source-ip ...] [source-port port-number] [cache {enable | disable}] [proxy proxy-url], scheduled the same way. It's like the difference between knocking on a shop door and actually asking for a loaf of bread: the second tells you the shop is open for business, not just that the building is there.
show ip sla configuration 2 then reports an http operation to port 80, HTTP version 1.0, and an operation timeout of 60000 ms, against 5000 ms for the guide's ICMP echo. If you've ever waited on hold for a call centre, you know why a whole web request gets a longer timeout than a ping. A successful HTTP GET proves the server answered an HTTP request in time; it doesn't prove the page's content is right, or how much of the time was the network rather than the server.
The HTTP operation's 60-second timeout is IP SLA's way of admitting that web pages deserve more patience than pings.
The guide verifies with show ip sla configuration, which shows the operation type, target and source, frequency, the schedule ("Life (seconds): Forever", "Status of entry (SNMP RowStatus): Active"), threshold and history settings. Cisco describes it as displaying "configuration values including all default values". It proves what the operation will do. It doesn't show a single result.
The results come from show ip sla statistics:
Round Trip Time (RTT) for Index 1
	Latest RTT: 4 ms
	Latest operation start time: *11:45:27.827 UTC Mon Dec 19 2005
	Latest operation return code: OK
	Number of successes: 1
	Number of failures: 0
	Operation time to live: Forever
That's the command reference's sample, from an older release; IOS XE's layout differs in detail. It's the answer to section 4.1: the counters only count runs, and the return code is only the latest one.
The return code has more than two values. A reply slower than the configured threshold returns Over threshold, which matters the moment the operation feeds object tracking: track object-number ip sla operation-number {state | reachability} treats state as up only on OK, and reachability as up on "OK or OverThreshold". Over threshold works like a traffic light on amber: not stopped, not quite fine, and whether it counts as go depends on who's asking. How releases count Over threshold runs among successes varies; check yours in the lab. Operations that aren't producing statistics can be helped with verify-data, and debug ip sla trace and debug ip sla error show what's going wrong. Results can also be read by SNMP through the CISCO-RTTMON-MIB, and reactions can raise syslog messages that "can also be sent as ... SNMP traps ... using the CISCO-RTTMON-MIB", with ip sla logging traps among the commands. verify-data checks the reply's payload; it doesn't make a failing operation pass. The debugs show why runs fail; they don't show anything between runs.
| Output | Proves | Doesn't prove |
|---|---|---|
show ip sla configuration | what the operation will do and whether it's scheduled | any result |
show ip sla statistics: "Latest operation return code: OK" | the latest run got a reply within the timeout and the threshold | anything about earlier runs, or between them |
| "Latest operation return code: Over threshold" | the latest run got a reply, slower than the threshold | that tracking sees it as up: state doesn't, reachability does |
| a successful HTTP GET | the server answered an HTTP request in time | that the content is right, or how much of the time was the network |
| "Number of failures: 0" | no run failed | that the path never failed: outages between runs leave no trace |
| an RTT above the threshold | that run was slow (Over threshold) | a timeout: an over-threshold reply still arrived |
| a round-trip time | how long the probe took there and back | one-way delay, which needs one-way-capable operations and NTP on both ends |
Continue the lesson
The whole lesson, with its drawings and its questions. The rest of this section and 9 more after it.