
NetFlow and Flexible NetFlow
The internet link is full and someone asks who is using all the bandwidth. Syslog and SNMP cannot say; NetFlow can. It groups packets that share header information into flows, collected per interface and per direction with ip flow ingress or egress, and exports them to a collector only after they expire: idle for 15 seconds, or active for 30 minutes, by default.
By Arif, founder of Daveth · Updated
The full 13 min walkthrough is in Daveth Pro (Network). See what the plan opens
What this page answers
When does NetFlow export a flow?
Only once it expires from the cache: after 15 seconds idle, at its maximum age of 30 minutes, when the cache is full, or when its TCP connection closes or resets. Until then nothing about it has left the router. Read it in “When a flow is allowed to leave”
Why is my NetFlow collector empty?
Check the direction and interface collecting, ip flow ingress or egress, the export destination address and UDP port, ip flow-export destination, and the export source. NetFlow has no standard port, so check the collector's. Read it in “When the collector stays empty”
What is the difference between NetFlow and Flexible NetFlow?
Classic NetFlow defines a flow by fixed fields: addresses, ports, protocol, QoS and ingress interface. Flexible NetFlow lets you choose those and more, built from flow records, monitors and exporters applied to interfaces. Read it in “Flexible NetFlow: records, monitors, interfaces”
Who's using all the bandwidth?
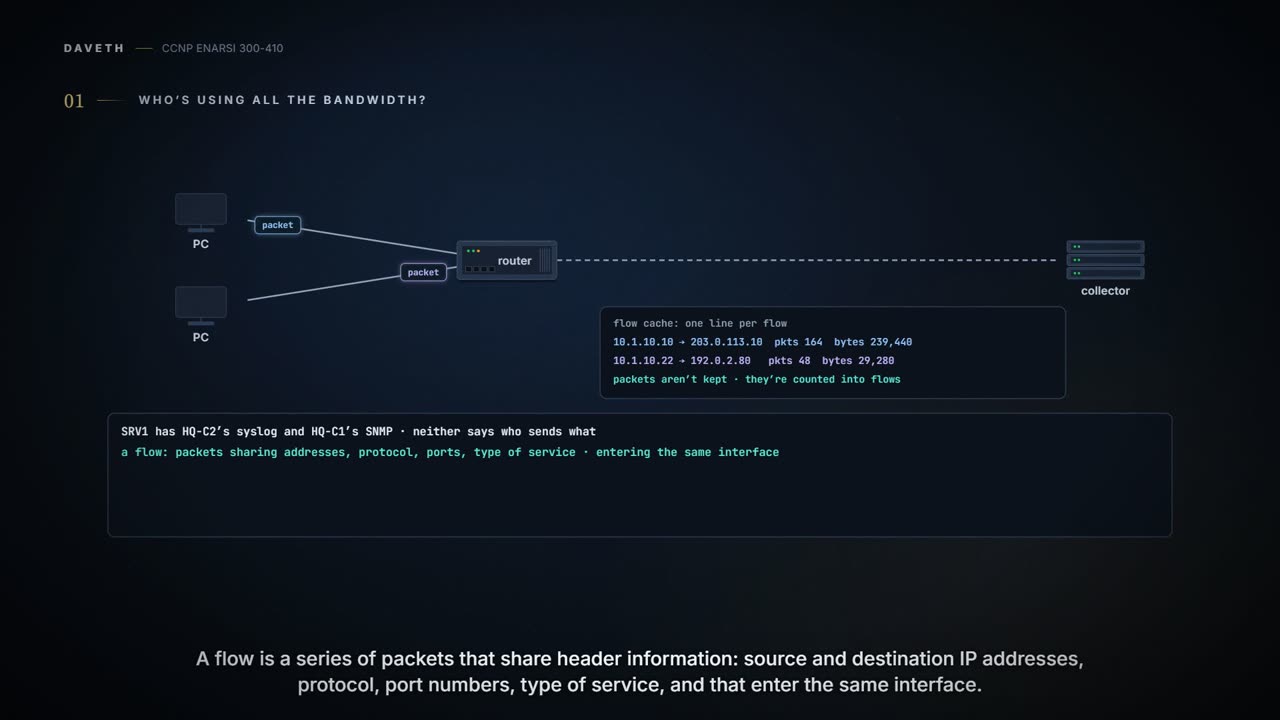
Monday, mid-morning, the internet link is full, and the question every network engineer gets: who's using all the bandwidth? SRV1 already collects HQ-C2's syslog and polls HQ-C1 with SNMP. Neither tells you who's sending what. NetFlow does.
NetFlow can give you tremendous insight into your network's traffic patterns. Several companies sell NetFlow collectors, applications that take the NetFlow information stored in a device's cache and turn it into graphs, charts and tables of traffic patterns.
NetFlow distinguishes traffic flows. A flow is a series of packets that share header information, such as source and destination IP addresses, protocol numbers, port numbers and type of service, and that enter the same interface on the device. NetFlow counts the packets and bytes it sees in each flow, and keeps that in a flow cache in the router's memory. That's the whole trick: it doesn't keep packets, it folds them into flows.
You can run NetFlow standalone on one router and read the cache at the CLI, which is handy for troubleshooting because you can watch flows being created as packets arrive. Or you export the cache's entries to a NetFlow collector, software on a server, and after collecting for a while its analysis software reports traffic statistics.
The router's own cache
Here's R4 with NetFlow on two interfaces and export to a collector:
R4# configure terminal
R4(config)# int fa 0/0
R4(config-if)# ip flow ingress
R4(config-if)# exit
R4(config)# int fa 0/1
R4(config-if)# ip flow egress
R4(config-if)# exit
R4(config)# ip flow-export source lo 0
R4(config)# ip flow-export version 5
R4(config)# ip flow-export destination 192.168.1.50 5000
R4(config)# end
ip flow ingress on Fa0/0 captures traffic arriving on it; ip flow egress on Fa0/1 captures traffic leaving; for both directions on one interface, configure both. Export isn't required; R4 does it anyway. ip flow-export source lo 0 makes every conversation with the collector use Loopback 0. Version 5 is specified, and it has to match the collector: check the collector's documentation. And ip flow-export destination 192.168.1.50 5000 says the collector is 192.168.1.50 on UDP port 5000; NetFlow has no standard port, so check the collector's documentation for that too.
The collector is good for long-term analysis, but show ip cache flow at the router's CLI gives you a summary right now. In R4's, the protocol table counts flows, packets and bytes by type, and under it every flow is a line of source interface, source address, destination interface, destination address and protocol; you can confirm, for example, that traffic flows between 10.8.8.6 and 192.168.0.228. That's "who's talking to whom", from the router, with no collector at all.
When the collector stays empty
When NetFlow doesn't give you what you expect, consider:
- Traffic direction. Collection is enabled interface by interface, and it's one direction:
ip flow ingressfor traffic arriving,ip flow egressfor traffic leaving, both for both. Know which way the traffic you want flows. - Interface. On a router with three interfaces, ingress on one captures only what arrives on it; egress on one captures everything leaving it, wherever it arrived. Pick the interface and the direction from where the traffic goes.
show ip flow interfaceshows which interfaces collect, in which direction. - Export destination. Collection is local by default. To export, the router needs
ip flow-export destination {ip address | hostname} udp-port, with the collector's right address and port. - Export source. If the collector accepts NetFlow only from a particular address, make the router use it with
ip flow-export source interface-type interface-number. - Version. Collectors support different versions; 5 and 9 are the most common, and 9 is now the more popular. The version decides how the information is formatted on the way to the collector.
R3# show ip flow interface
GigabitEthernet2/0
 ip flow ingress
 ip flow egress
R3#
Nothing usable. The formats aren't the same, whichever way round, and collection doesn't succeed; ip flow-export version [5 | 9] sets the router's, and show ip flow export shows it. Version 9 is the template-based one: its records describe their own fields, which is what lets it carry fields like IPv6 addresses.
R3# show ip flow export
Flow export v5 is enabled for main cache
  Export source and destination details :
  VRF ID : Default
    Source(1)        192.168.23.1 (Loopback0)
    Destination(1)  192.168.1.50 (5000)
  Version 5 flow records
  0 flows exported in 0 udp datagrams
  0 flows failed due to lack of export packet
Version 5, source Loopback0 at 192.168.23.1, destination 192.168.1.50 on port 5000. And "0 flows exported in 0 udp datagrams". Everything's configured and nothing has gone. Hold that line until the next section.
When a flow is allowed to leave
Flows are temporary on the router. If they aren't exported, they're removed from the cache at some point to free resources. And they're exported only if you set up export, and only after they expire in the cache. A flow expires, and is exported, when:
- it's been idle, inactive, for 15 seconds by default;
- it has reached its maximum age, 30 minutes by default, the active timer;
- the cache is full, and heuristics age out older flows at once;
- its TCP connection closed (a FIN seen) or was reset (an RST seen).
Here's the question that list sets up.
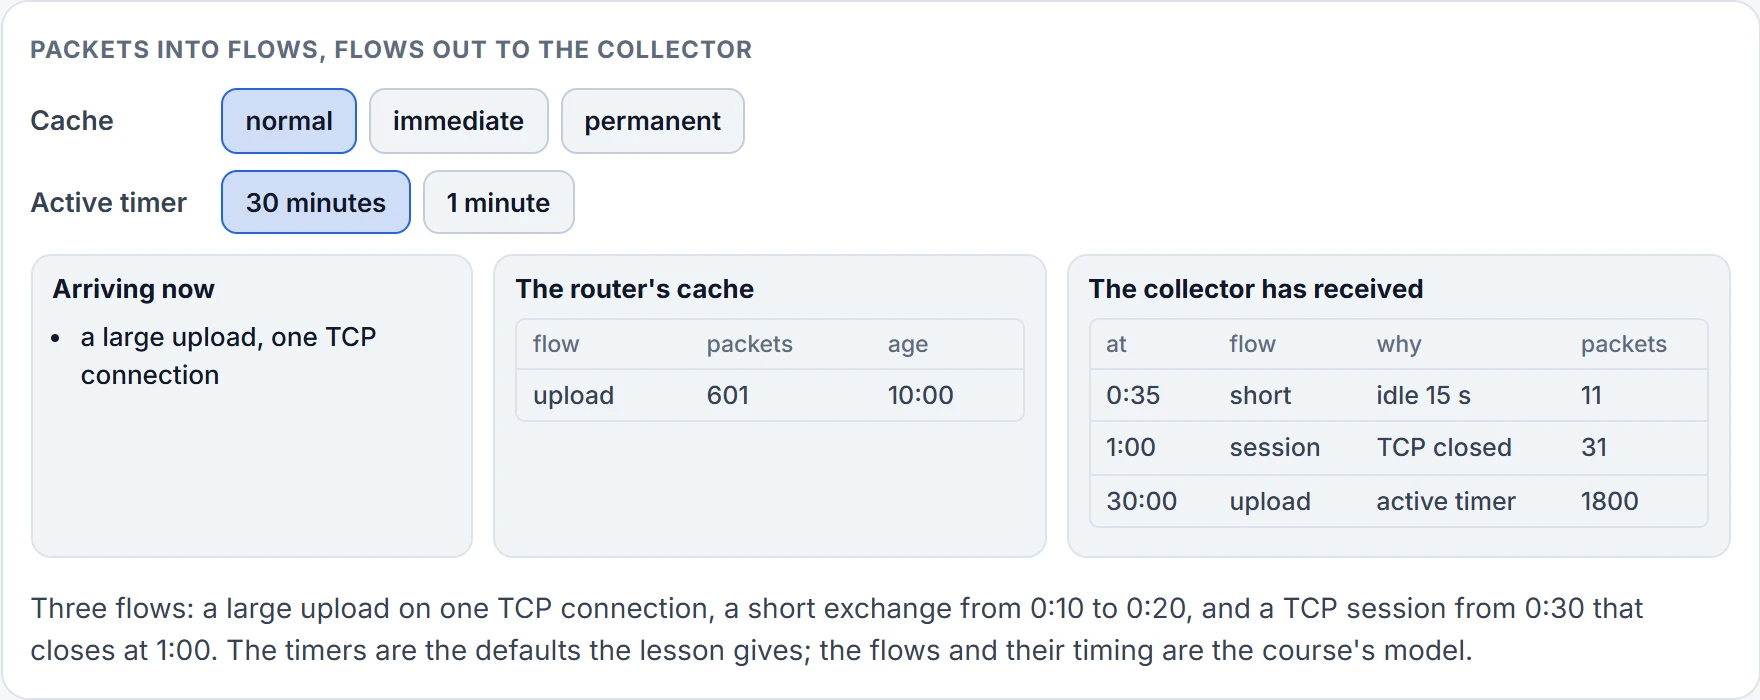
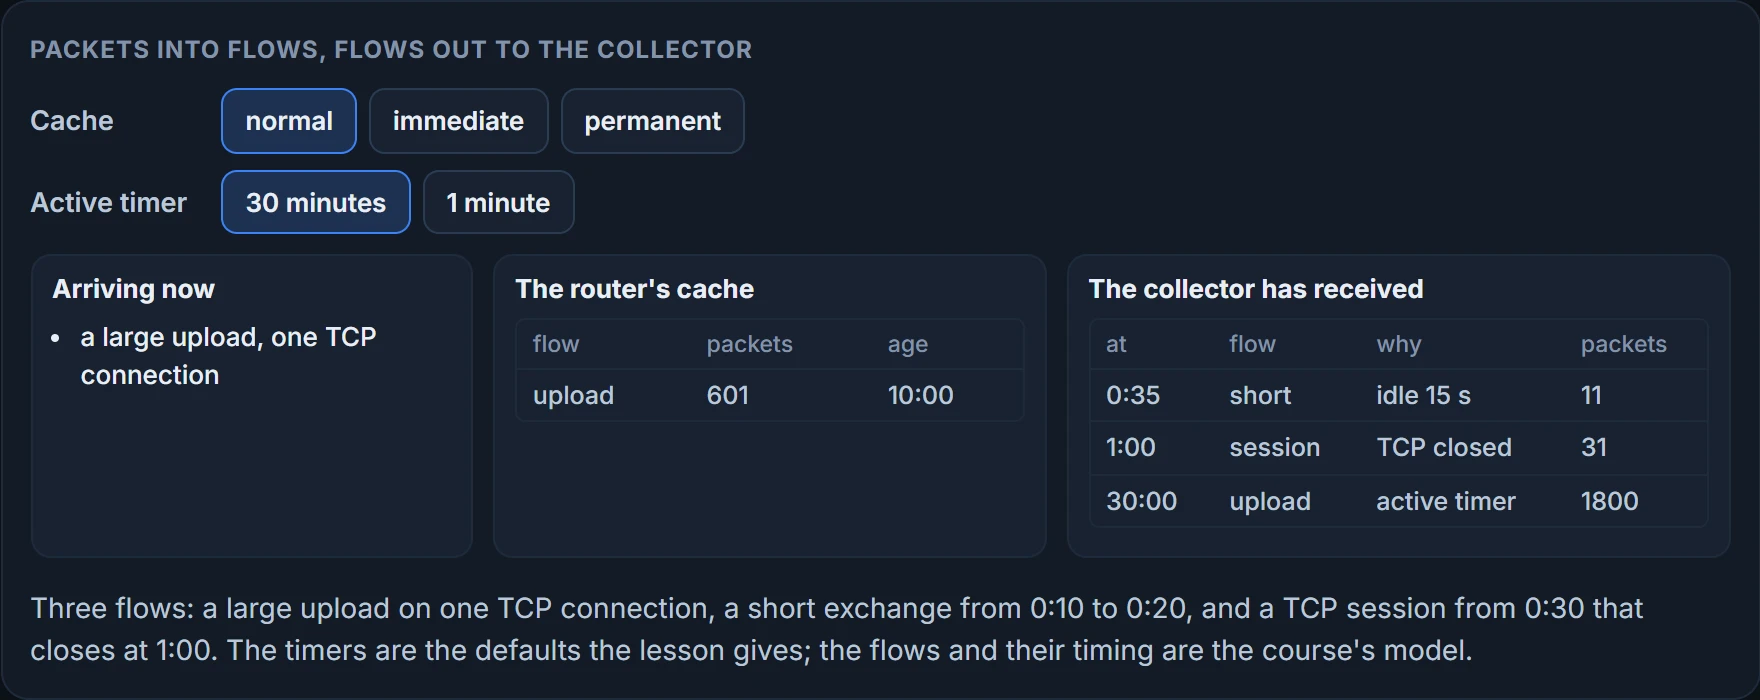
None. The upload is never idle for 15 seconds, it isn't 30 minutes old, it hasn't closed, and the cache isn't full: none of the four has happened, so the flow is still in the cache, growing, and nothing about it has left the router. In the figure at 10:00 the cache holds it with 601 packets, and the collector has 2 records, none of them the upload's. The router knows; the collector doesn't, yet. At 30 minutes the active timer exports it, and the next record covers what comes after. The "0 flows exported" in the last section is the same thing seen from the other end: nothing had expired yet.
You can change the timers. ip flow-cache entries number sizes the cache if it fills up too often; ip flow-cache timeout active minutes changes the maximum age; ip flow-cache timeout inactive seconds the idle timer; show ip cache flow shows what's set. clear ip flow stats clears NetFlow's statistics, and show ip cache flow says when that last happened:
IP Flow Switching Cache, 4456704 bytes
 2 active, 65534 inactive, 3 added
 1239 ager polls, 0 flow alloc failures
 Active flows timeout in 30 minutes
 Inactive flows timeout in 15 seconds
and further down "last clearing of statistics never".
We haven't confirmed on a router how the cache picks what to age out when it's full, or whether a flow's export at the active timer restarts its counters.
Flexible NetFlow: records, monitors, interfaces
Flexible NetFlow takes NetFlow further, letting you customise the analysis for your requirements: classic NetFlow defines a flow by source and destination addresses and ports, protocol, QoS and ingress interface, and Flexible NetFlow lets you use those and more. To troubleshoot it, verify the flow records, the flow monitors, the flow exporters and the interfaces.
Records define what's captured: predefined by Cisco, or defined by you. For a predefined record, its documentation says what it captures, and the list changes over time; for your own, show flow record or show running-config flow record shows the match and collect fields, and show flow monitor shows which predefined record a monitor uses:
R3# show running-config flow record
Current configuration:
!
flow record ENARSI-FLOWRECORD
match ipv4 source address
match ipv4 destination address
match application name
collect interface input
!
R3#
match fields make a flow; collect fields are counted or noted for it.
Monitors are applied to interfaces. A monitor holds the record that says what's matched and collected, and the collected flows go into the monitor's cache. show flow monitor shows its record, its exporter, the cache type and size, and the timers; show flow monitor name monitor-name cache format record shows the cache's status, statistics and flows.
A monitor's cache is normal, immediate or permanent. Normal expires and exports flows by the inactive and active timers, a full cache or a TCP close, as above. Immediate expires a flow as soon as its packet arrives, so it's exported one packet at a time; the timers don't matter, and with a lot of packets it could swamp links and the collector: use it with caution. Permanent never deletes locally, but still sends to the collector on the "timeout update"; if it fills, no new flows are monitored and you get "Flows not added" in the cache's statistics: caution again. The figure above has all three.
Continue the lesson
The whole lesson, with its drawings and its questions. The rest of this section and 3 more after it.