
IP SLA and object tracking
The interface to the ISP is up and the ISP beyond it is dead, and a static route stays while its interface is up. IP SLA lets the router send traffic of its own, such as an ICMP echo every 15 seconds, and judge the result. Object tracking turns the result into a verdict: a static route tied to a track object leaves the table while the object is down.
By Arif, founder of Daveth · Updated
The full 13 min walkthrough is in Daveth Pro (Network). See what the plan opens
What this page answers
How do you track a static route with IP SLA?
Configure and schedule an IP SLA probe, create a track object that follows it, such as track 22 ip sla 1 reachability, and add track 22 to the static route. A floating static with a higher distance takes over while the object is down. Read it in “Probe, track, route”
When do you need an IP SLA responder?
Only for highly accurate statistics, such as UDP jitter, for services no specific destination device offers. The responder accounts for its own processing time; a simple ICMP echo needs none. Read it in “Two probes”
Why is my IP SLA probe not working?
Check the operation matches the metric, the destination and source addresses are reachable and correctly defined, the port numbers are right, the instance has been started, and any needed responder is configured and reachable. Read it in “Is the probe telling the truth?”
A link that's up, and a provider that isn't
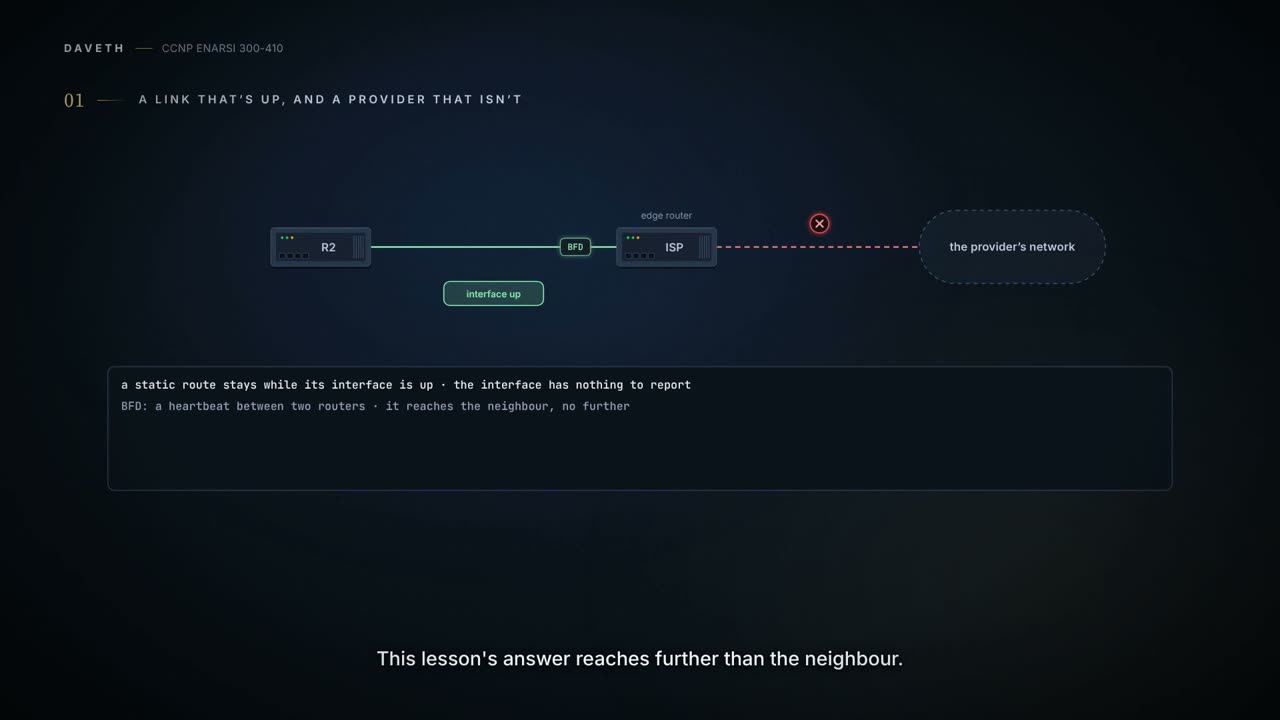
The question for this lesson: the interface to the ISP is up, and the ISP beyond it is dead. How does the router find out? Not from the interface. A static route stays while its interface is up, and the interface has nothing to report. The BFD lesson gave one answer: a fast heartbeat between two routers that both run it, which tells you the neighbour stopped answering. This lesson's answer reaches further than the neighbour: the router sends traffic of its own, to a destination you choose, and judges the replies.
That tool is IP SLA. It measures network performance and tests availability by generating a continuous, reliable probe, simulated traffic, in a predictable manner. What you can collect depends on how you set up the probe: packet loss, one-way latency, response times, jitter, network resource availability, application performance, server response times, even voice quality.
Two roles. The IP SLA source sends the probes; the IP SLA responder replies to them; and both aren't always needed. Only the source is required all the time. The responder is needed only for highly accurate statistics for services that aren't offered by any specific destination device, and it can answer with accurate measurements because it takes its own processing time into account. In the simplest case R1 alone sends an ICMP echo to test connectivity to a file server; in the other, R1 measures jitter, interpacket delay variance, against R2 as a responder.
Two probes
Here's R1 as a source, sending an ICMP echo:
R1# show run | section sla
ip sla 2
icmp-echo 10.1.100.100 source-ip 192.168.1.11
frequency 15
ip sla schedule 2 life forever start-time now
A ping to 10.1.100.100 from the local source address 192.168.1.11, every 15 seconds, starting now and never expiring. The source address matters most when there are several paths to the destination: it helps control which interface the probe leaves from.
And a jitter probe:
R1# show run | section sla
ip sla 1
udp-jitter 10.1.34.4 65051 source-ip 192.168.1.11 num-packets 20
request-data-size 160
frequency 30
ip sla schedule 1 life forever start-time now
R2# show run | section sla
ip sla responder
UDP jitter from 192.168.1.11 to 10.1.34.4 on port 65051, 20 packets a test of 160 bytes each, every 30 seconds, started and never expiring.
Look at what each one asks for. The echo asks for a reply any IP device gives. The jitter probe asks the far end to process probes and answer with measurements. So the destination has to support IP SLA and be configured as a responder: R2 has ip sla responder. You can make it more granular, naming the operation, the address to answer on and the port, as in ip sla responder udp-echo ipaddress 10.0.52.4 port 1967. From the other side: no responder is needed on the destination for an echo, which works for IPv4 or IPv6. And to test one-way delay for voice packets, you need a responder.
Is the probe telling the truth?
When IP SLA doesn't give you what you expect, check:
- the operation chosen matches the metric you want to measure;
- the destination address is reachable and correctly defined;
- the source address is reachable from the destination and correctly defined;
- any port numbers are correctly identified;
- the instance has been started;
- if it needs a responder, one is configured and reachable.
show ip sla application shows which operations the platform supports, how many are configured and how many are active: on R1, "Number of Entries configured : 2" and "Number of active Entries : 2".
show ip sla configuration shows each instance's values, defaults included: the operation type, its timeout, source and destination addresses and ports, type of service, packet size, packet interval where the operation has one, and the schedule. Read entry 2 as four facts:
Entry number: 2
Owner:
Tag:
Operation timeout (milliseconds): 5000
Type of operation to perform: icmp-echo
Target address/Source address: 10.1.100.100/192.168.1.11
and, further down, a frequency of 15 seconds and a life of forever. Both entries are started and will never expire. The timeout is 5000 milliseconds, a value nobody configured. (A "Status of entry (SNMP RowStatus): Active" line is SNMP's table row status, from the SNMP lesson.)
show ip sla statistics gives the results: the operation type, when it last started, the latest return code, the values returned, and the counts of successes and failures. Entry 1, the jitter probe, reports a return code of OK, RTT values, jitter in each direction, packet loss (3 from destination to source), and "Number of successes: 61", "Number of failures: 0". Entry 2:
Latest operation start time: 09:52:49 UTC Sat Jul 26 2014
Latest operation return code: OK
Number of successes: 95
Number of failures: 1
Operation time to live: Forever
One failure in 96. What that proves: the probe ran, and its latest answer was OK. What it doesn't: that anything past 10.1.100.100 works, or that 10.1.100.100 was the right thing to ask.
On the responder, show ip sla responder shows the general control port, the probes received, the errors, and the recent sources: R2's responder is on control port 1967, has received 2333 control messages with 0 errors, all recently from 192.168.1.11. The control port is the responder's half of a control protocol: the source tells it which port to open, and it opens that port for the duration.
And live, debug ip sla trace 2. A good run wakes up, starts, sends, receives and updates: "Sending ID: 113", then "ID:113, RTT=1", then "Updating result". A bad one:
R1# debug ip sla trace 2
IPSLA-INFRA_TRACE:OPER:2 slaSchedulerEventWakeup
IPSLA-INFRA_TRACE:OPER:2 Starting an operation
IPSLA-OPER_TRACE:OPER:2 source IP:192.168.1.11
IPSLA-OPER_TRACE:OPER:2 Sending ID: 205
IPSLA-INFRA_TRACE:OPER:2 Updating result
with a "Timeout - destAddr=10.1.100.100" line between the send and the update: the operation timed out between 192.168.1.11 and 10.1.100.100, and the statistics were updated to say so.
Tracking: the verdict
Object tracking lets you control what happens when a tracked object goes up or down. Attach an object to a static route, and the route is in the routing table while the object is up and out of it while the object is down. With a first-hop redundancy protocol, the object can decrement or increment the priority: down, and the priority drops. You can track IP routes, IP SLA instances, interfaces and groups of objects.
The chain the rest of this lesson uses: track an IP SLA instance doing ICMP echoes. An echo fails, so the instance fails, so the tracking object goes down; tied to FHRP, the priority drops; tied to a static route, the route leaves the routing table.
show track shows a tracking object's configuration and state. On SW1, object 1 tracks the reachability of the route 10.1.43.0/24: up while the route is in the routing table, down while it isn't, and attached to HSRP group 10, as "Tracked by:" shows:
SW1# show track
Track 1
 IP route 10.1.43.0 255.255.255.0 reachability
 Reachability is Up (EIGRP)
   1 change, last change 00:01:55
 First-hop interface is GigabitEthernet1/0/10
Tracked by:
  HSRP Vlan10 10
Then the route leaves the table, and the object goes down: "Reachability is Down (no route)", "2 changes, last change 00:00:04", and the first-hop interface unknown; because it's attached to HSRP group 10, whatever that group is configured to do happens, such as decrementing the local priority.
Two more settings. An IP SLA object can be tracked for its state or its reachability, and the only difference is one return code, OverThreshold: state is up on OK alone; reachability is up on OK or OverThreshold. So a slow but answering target keeps a reachability track up and brings a state track down. And delay up and delay down hold a change back for some seconds before the track reports it, which stops one lost probe from swinging a route.
Probe, track, route
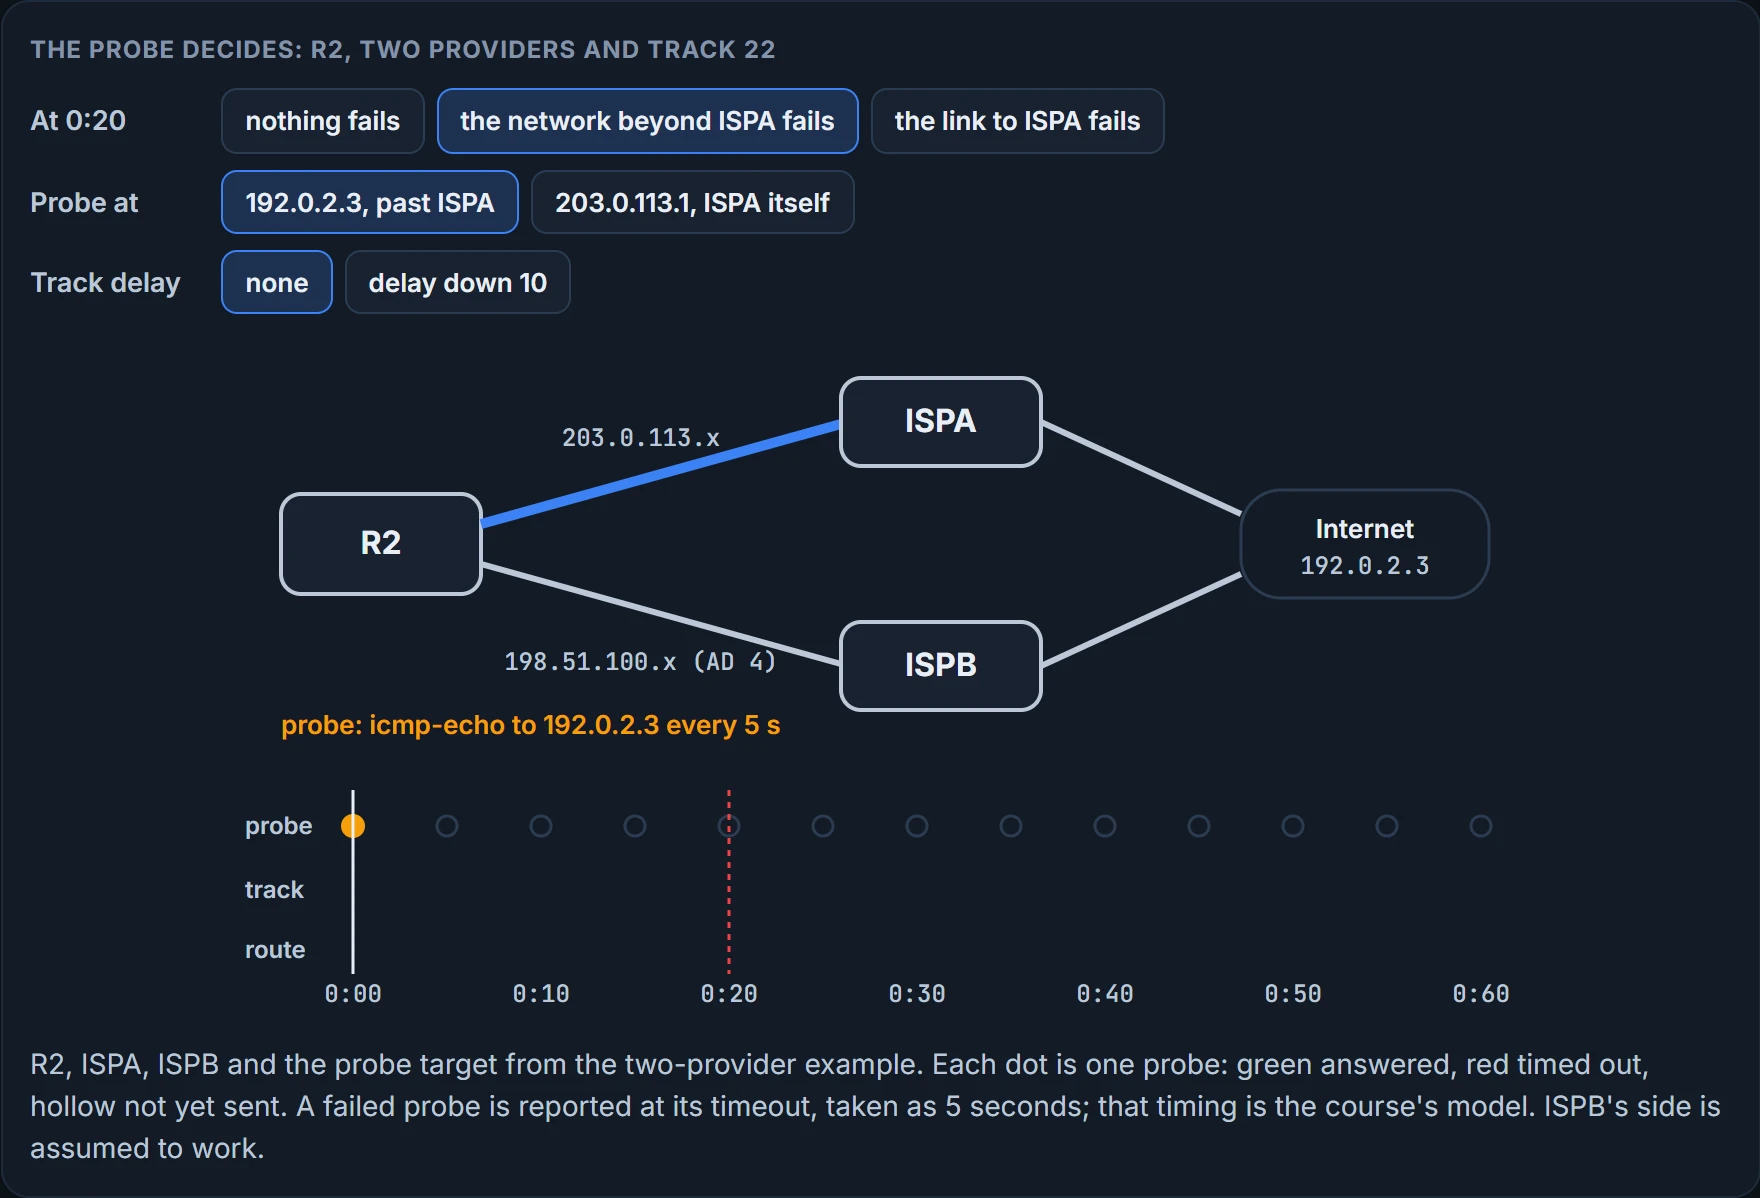
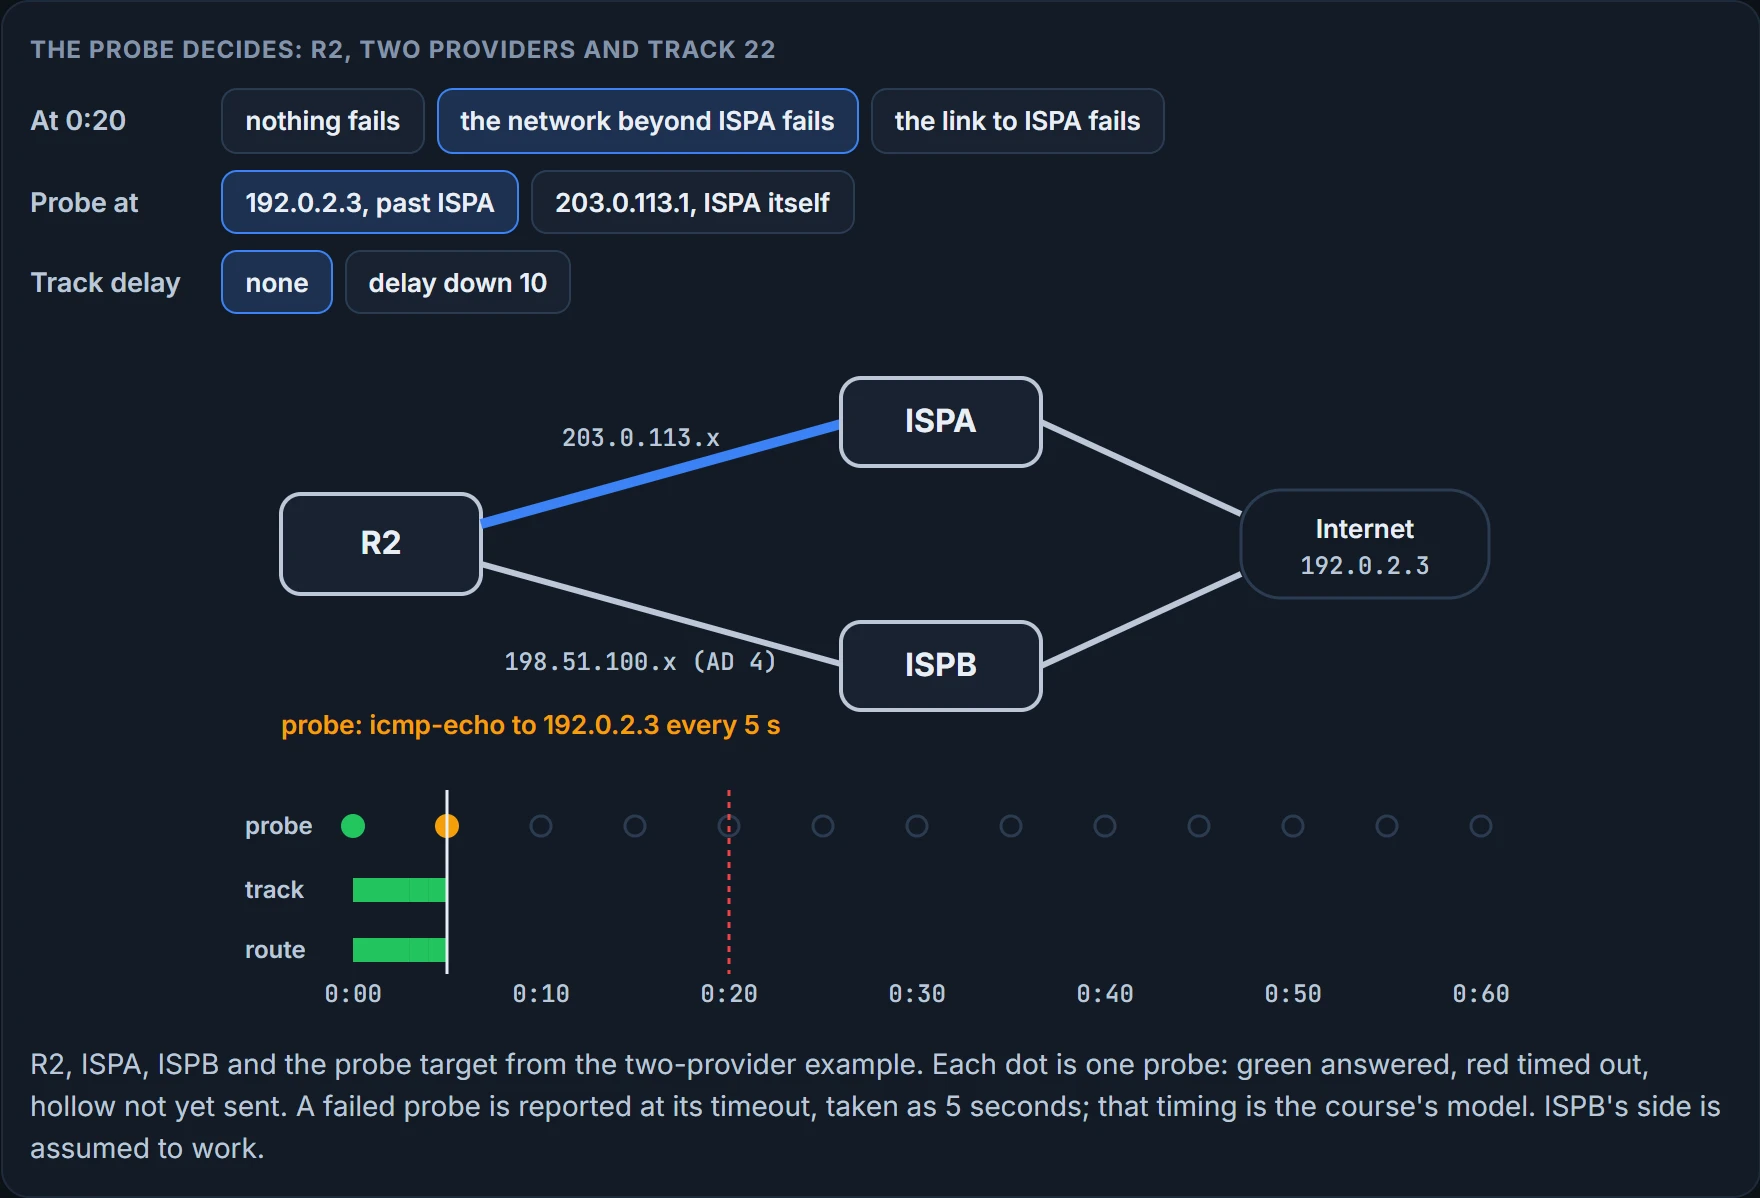
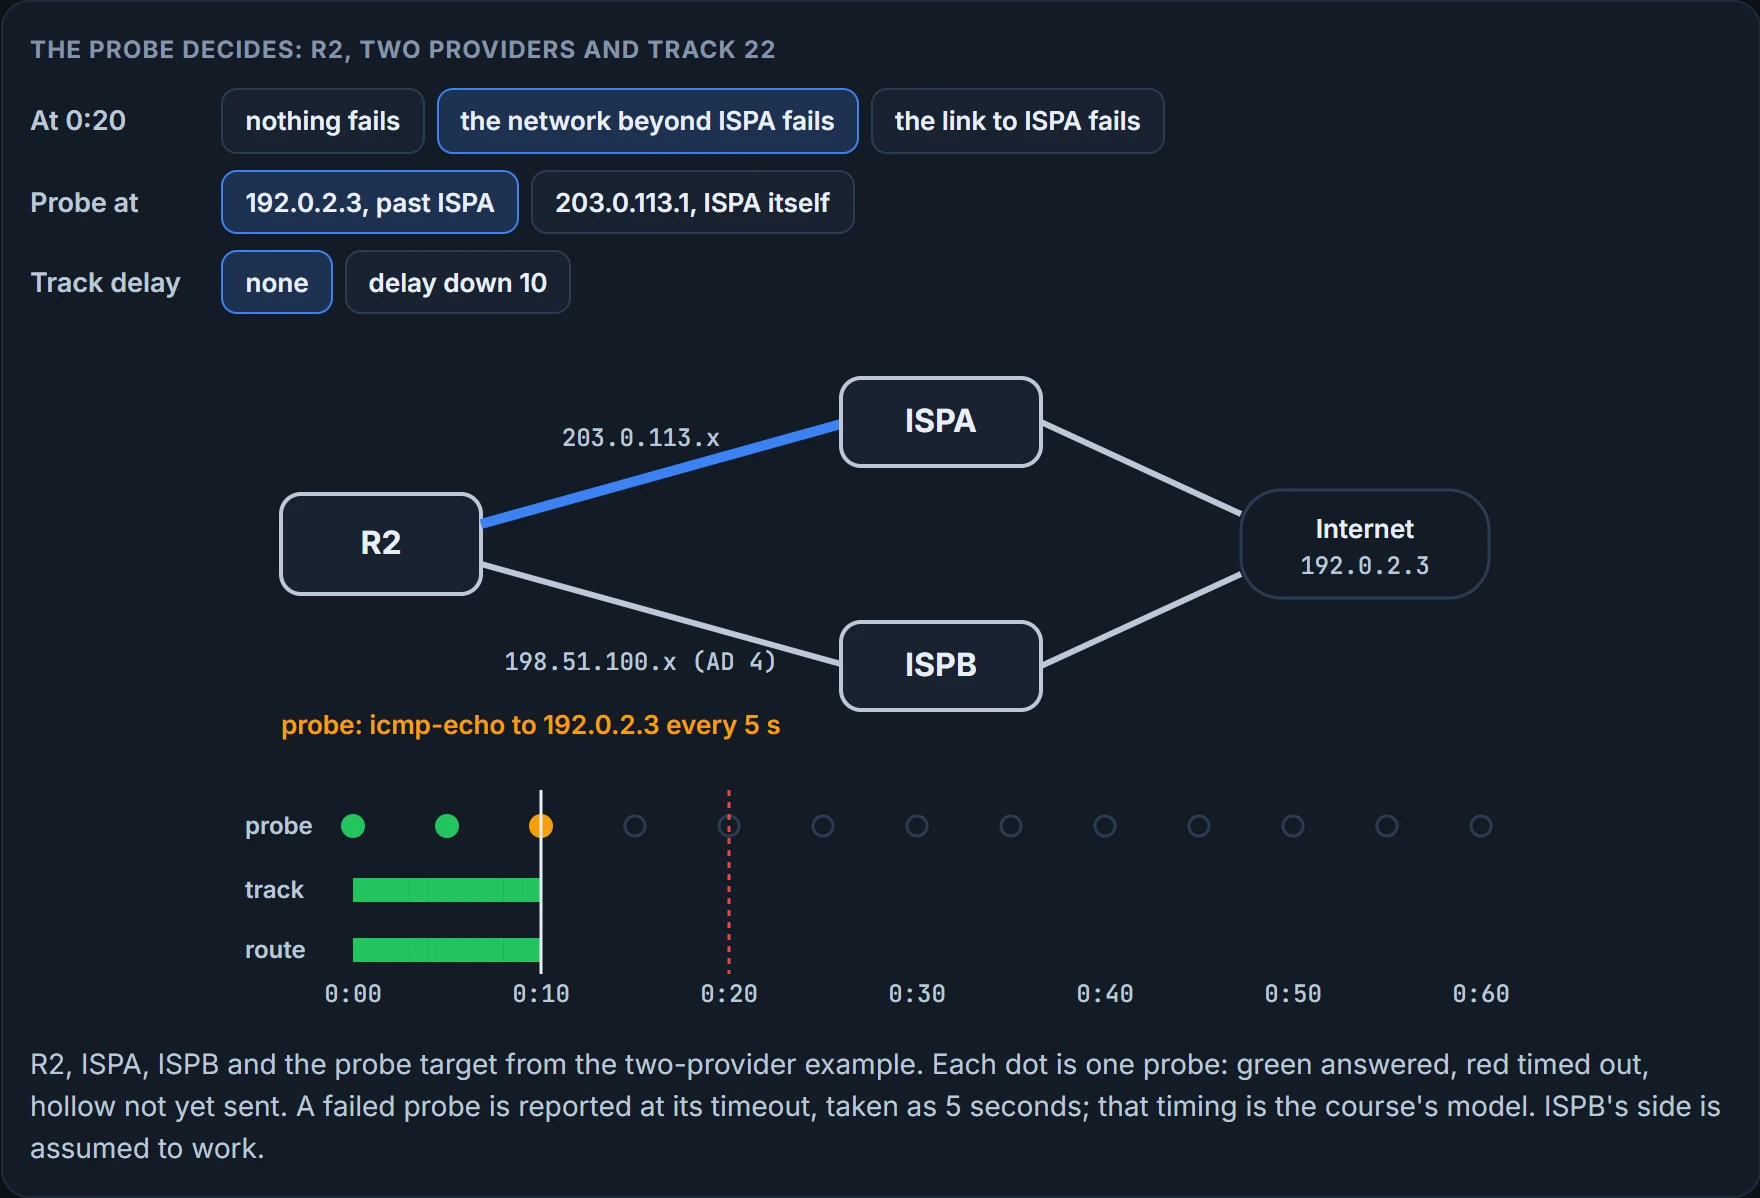
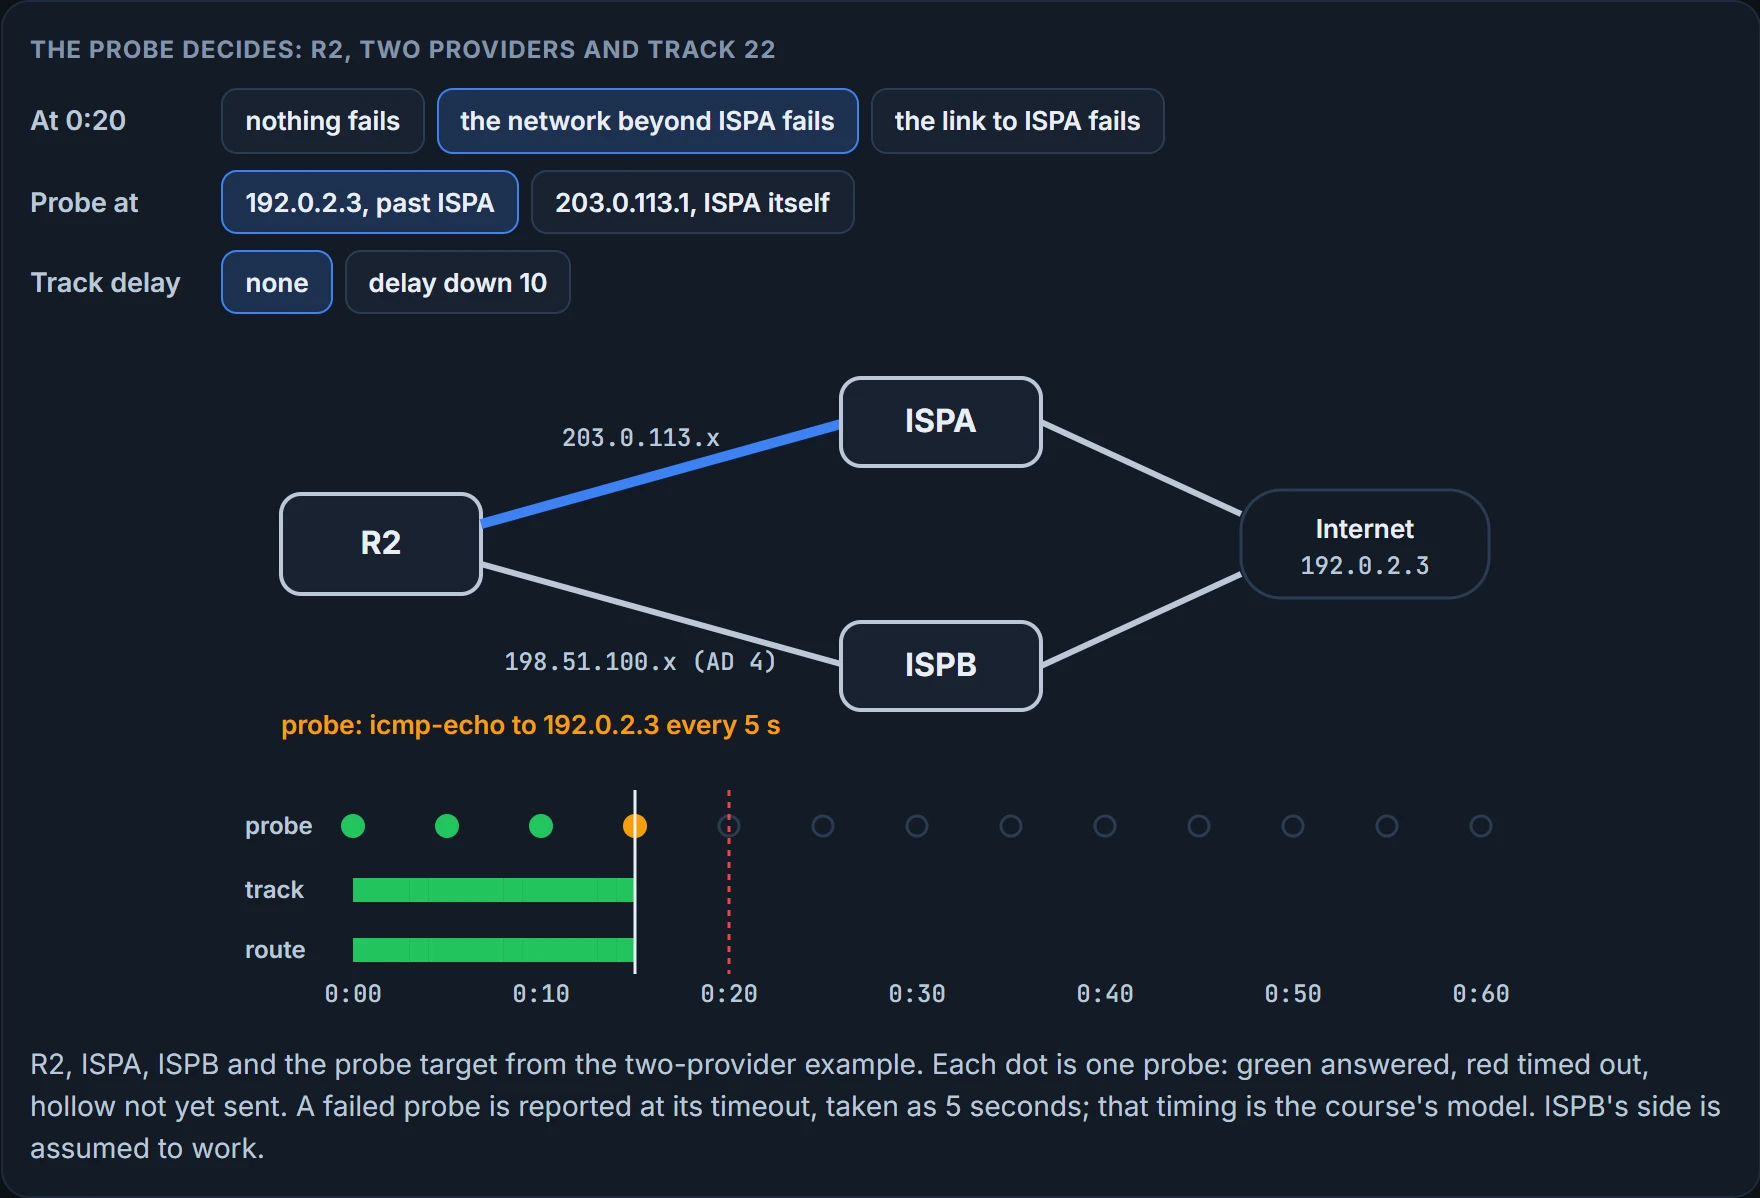
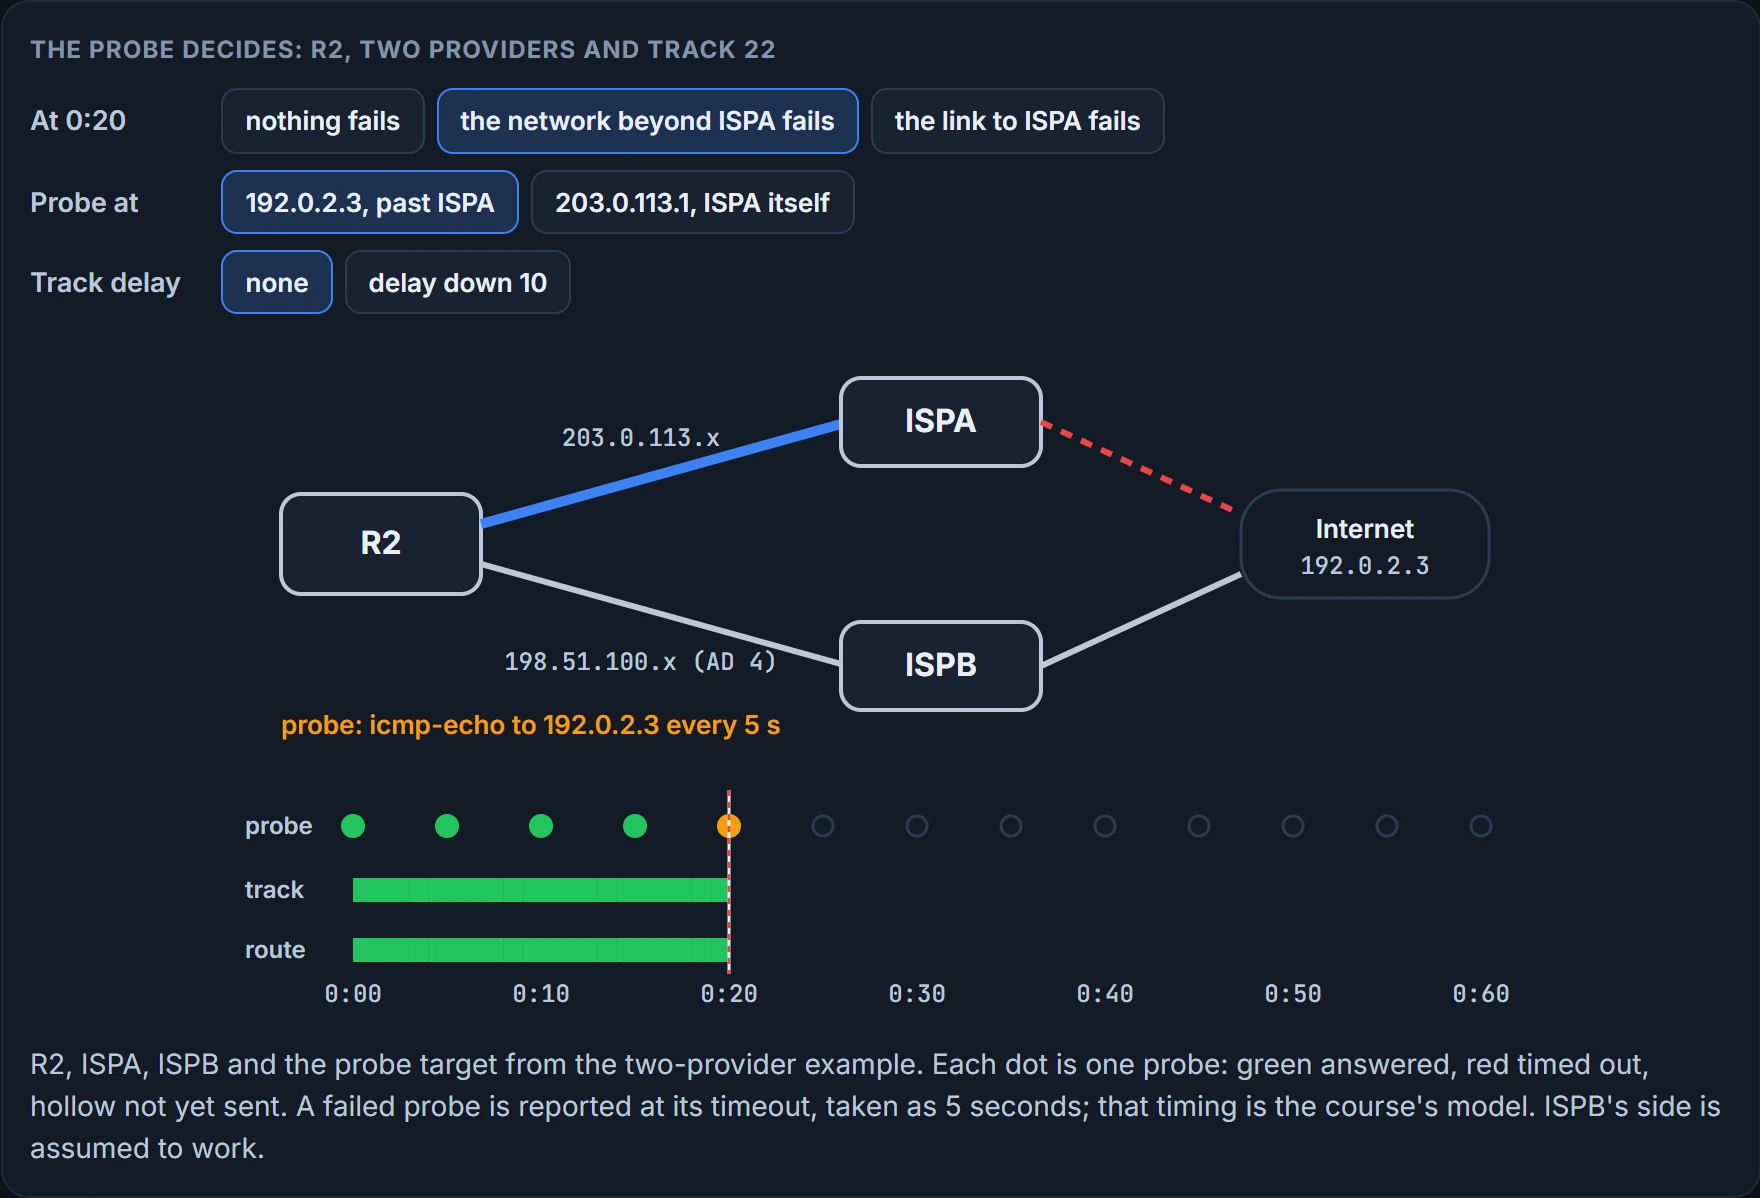
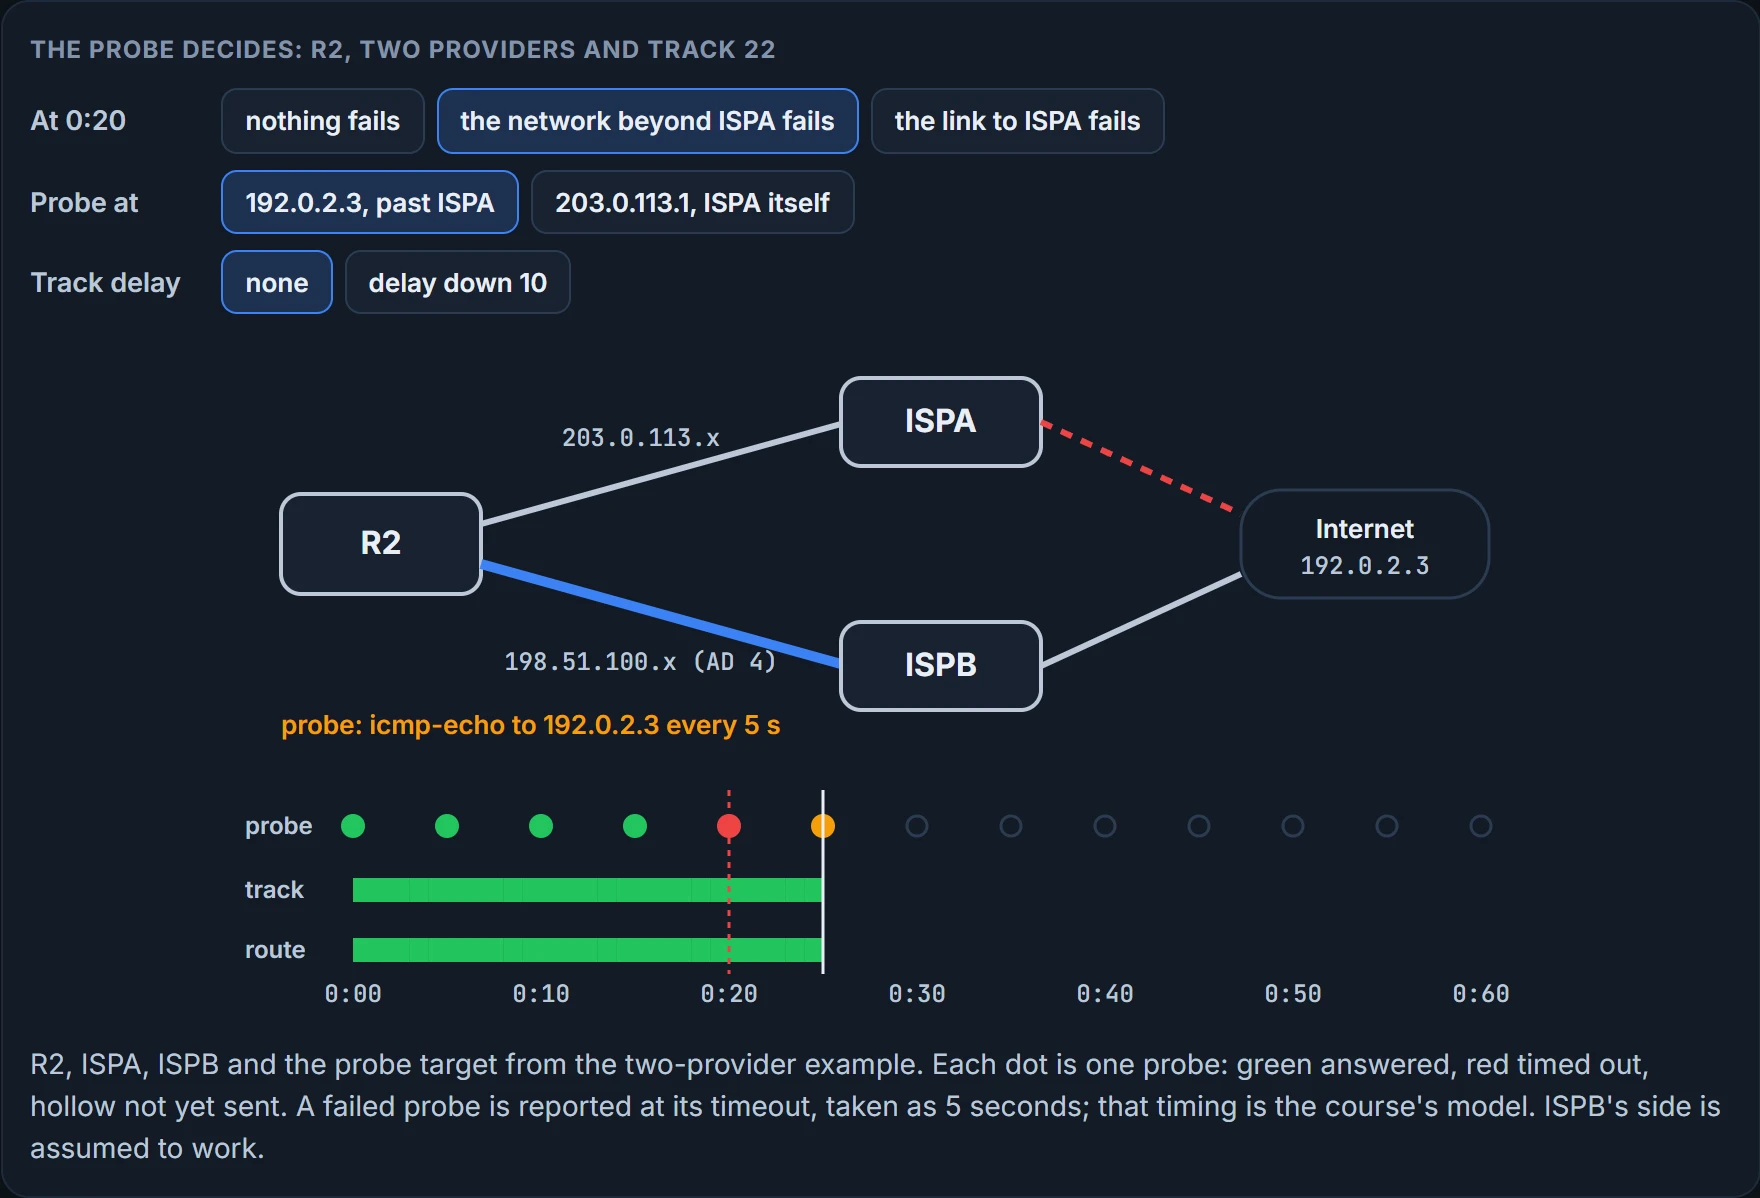
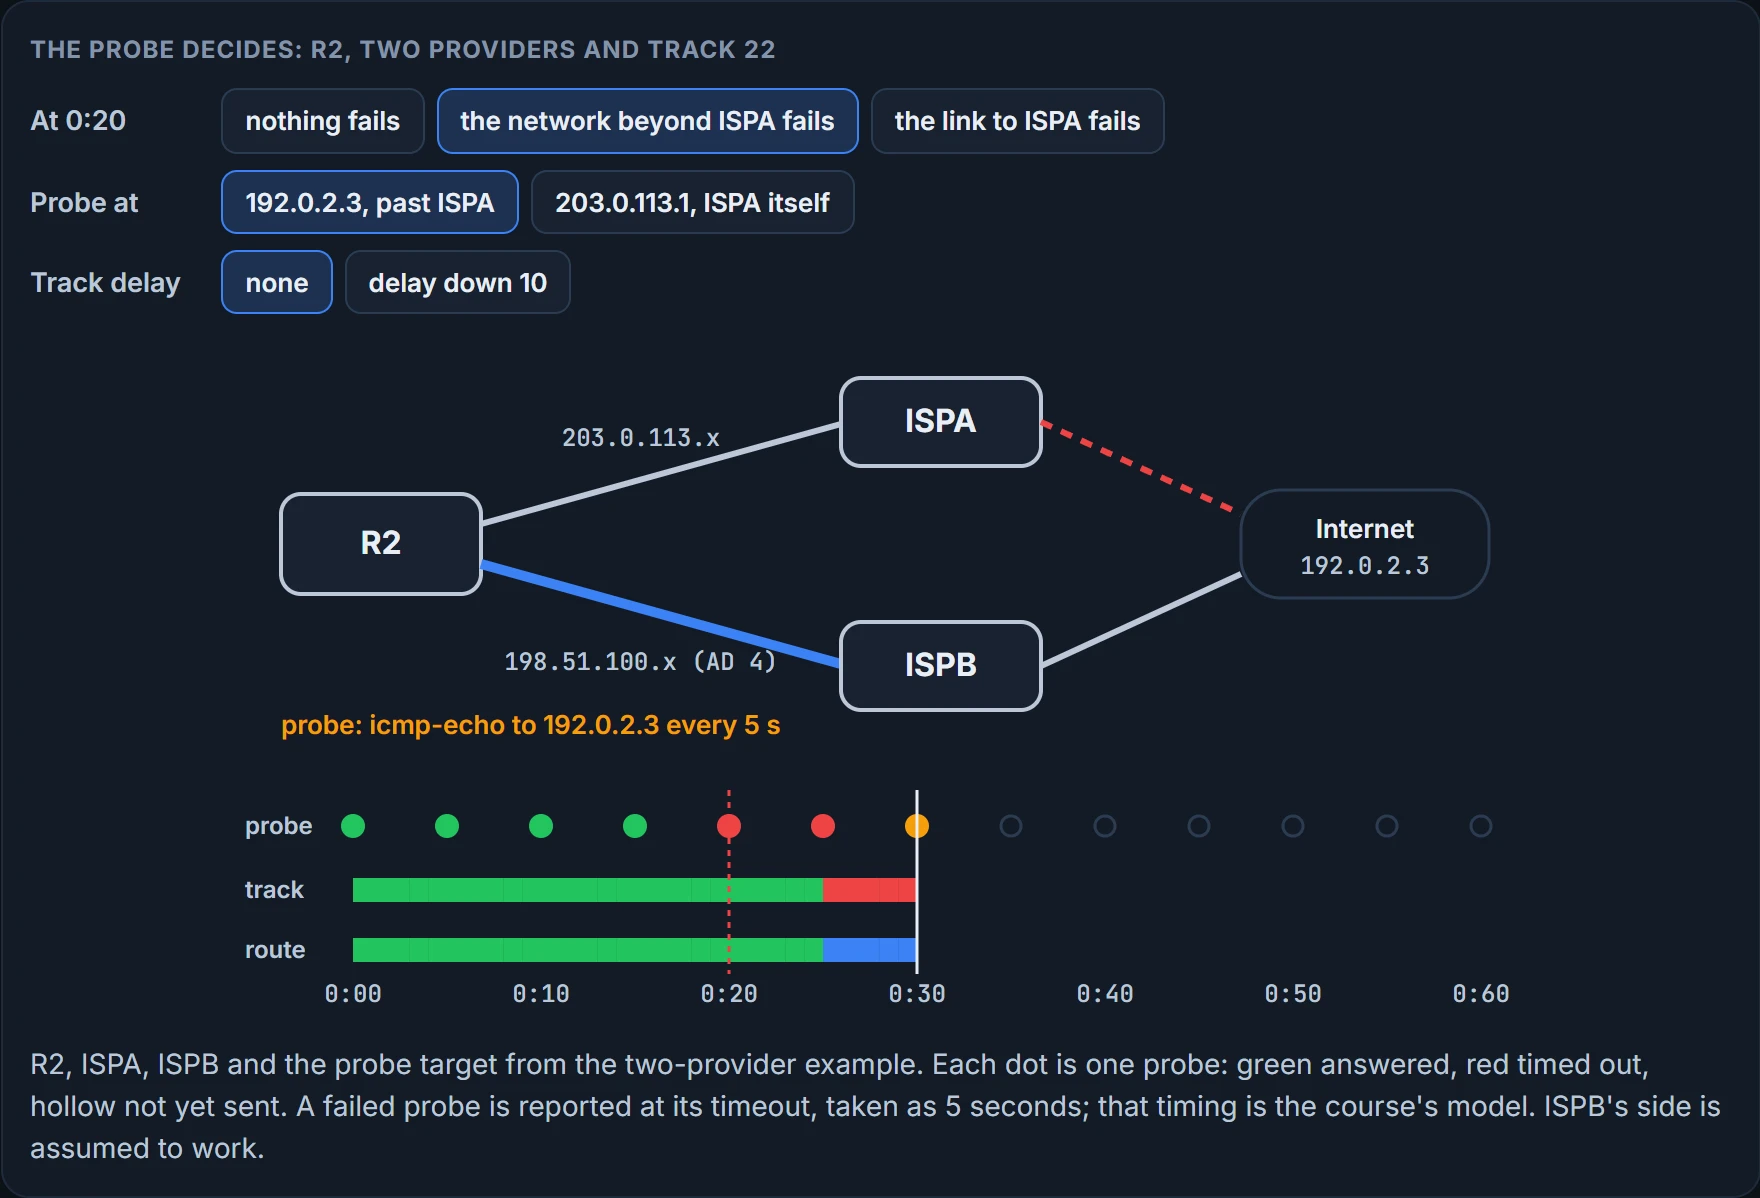
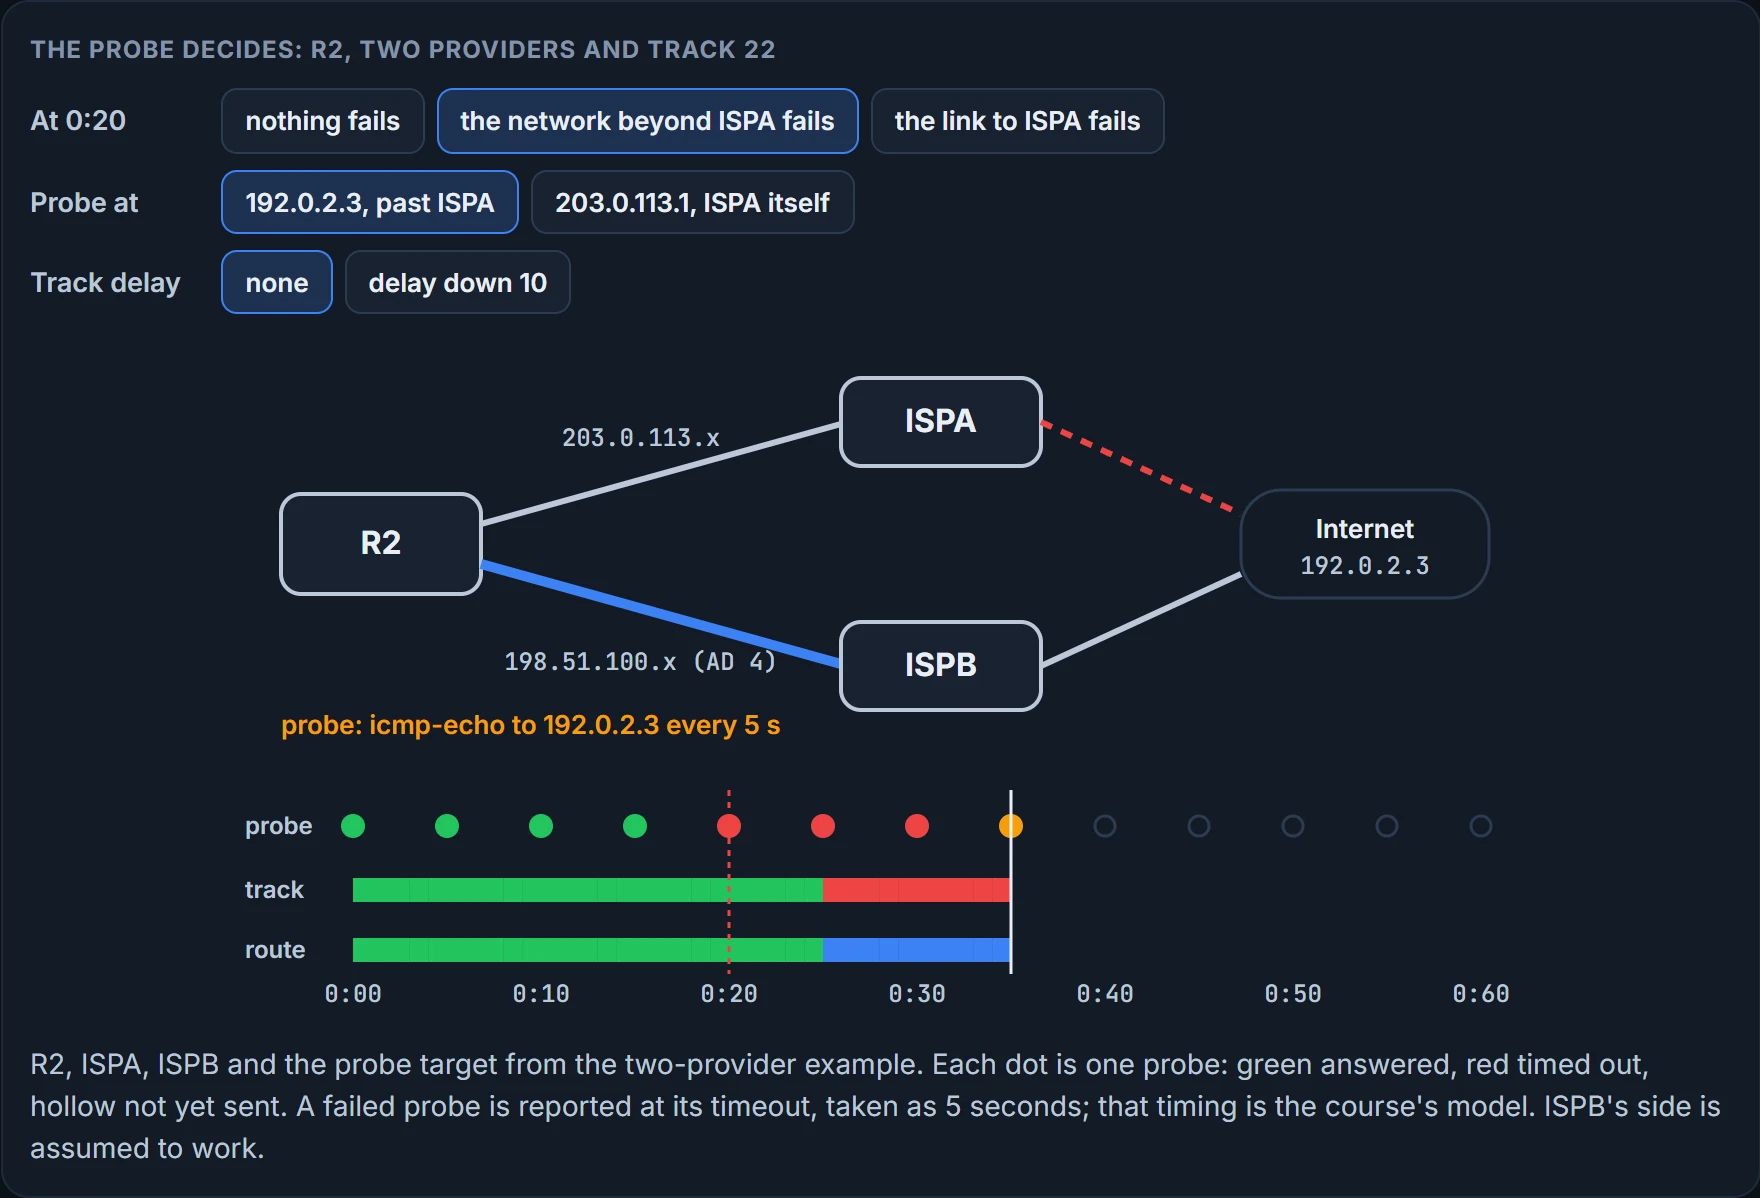
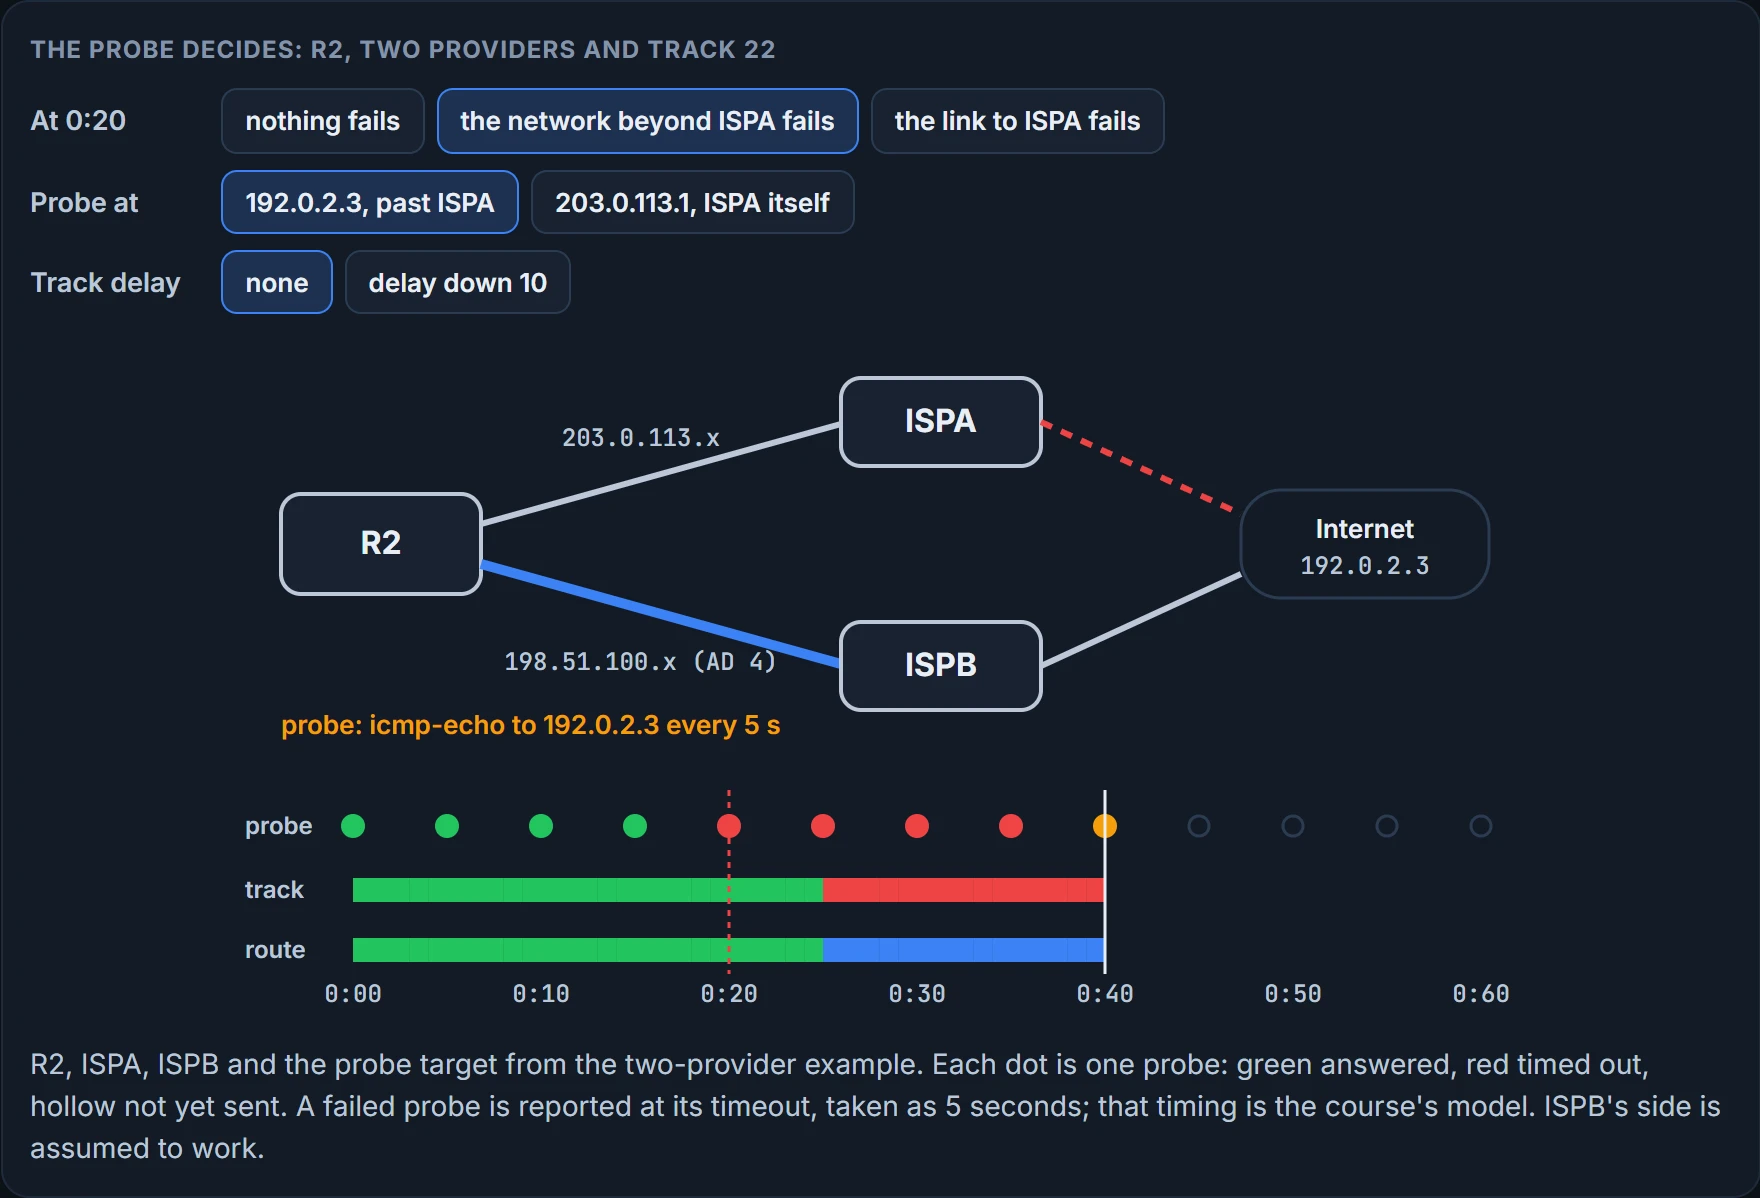
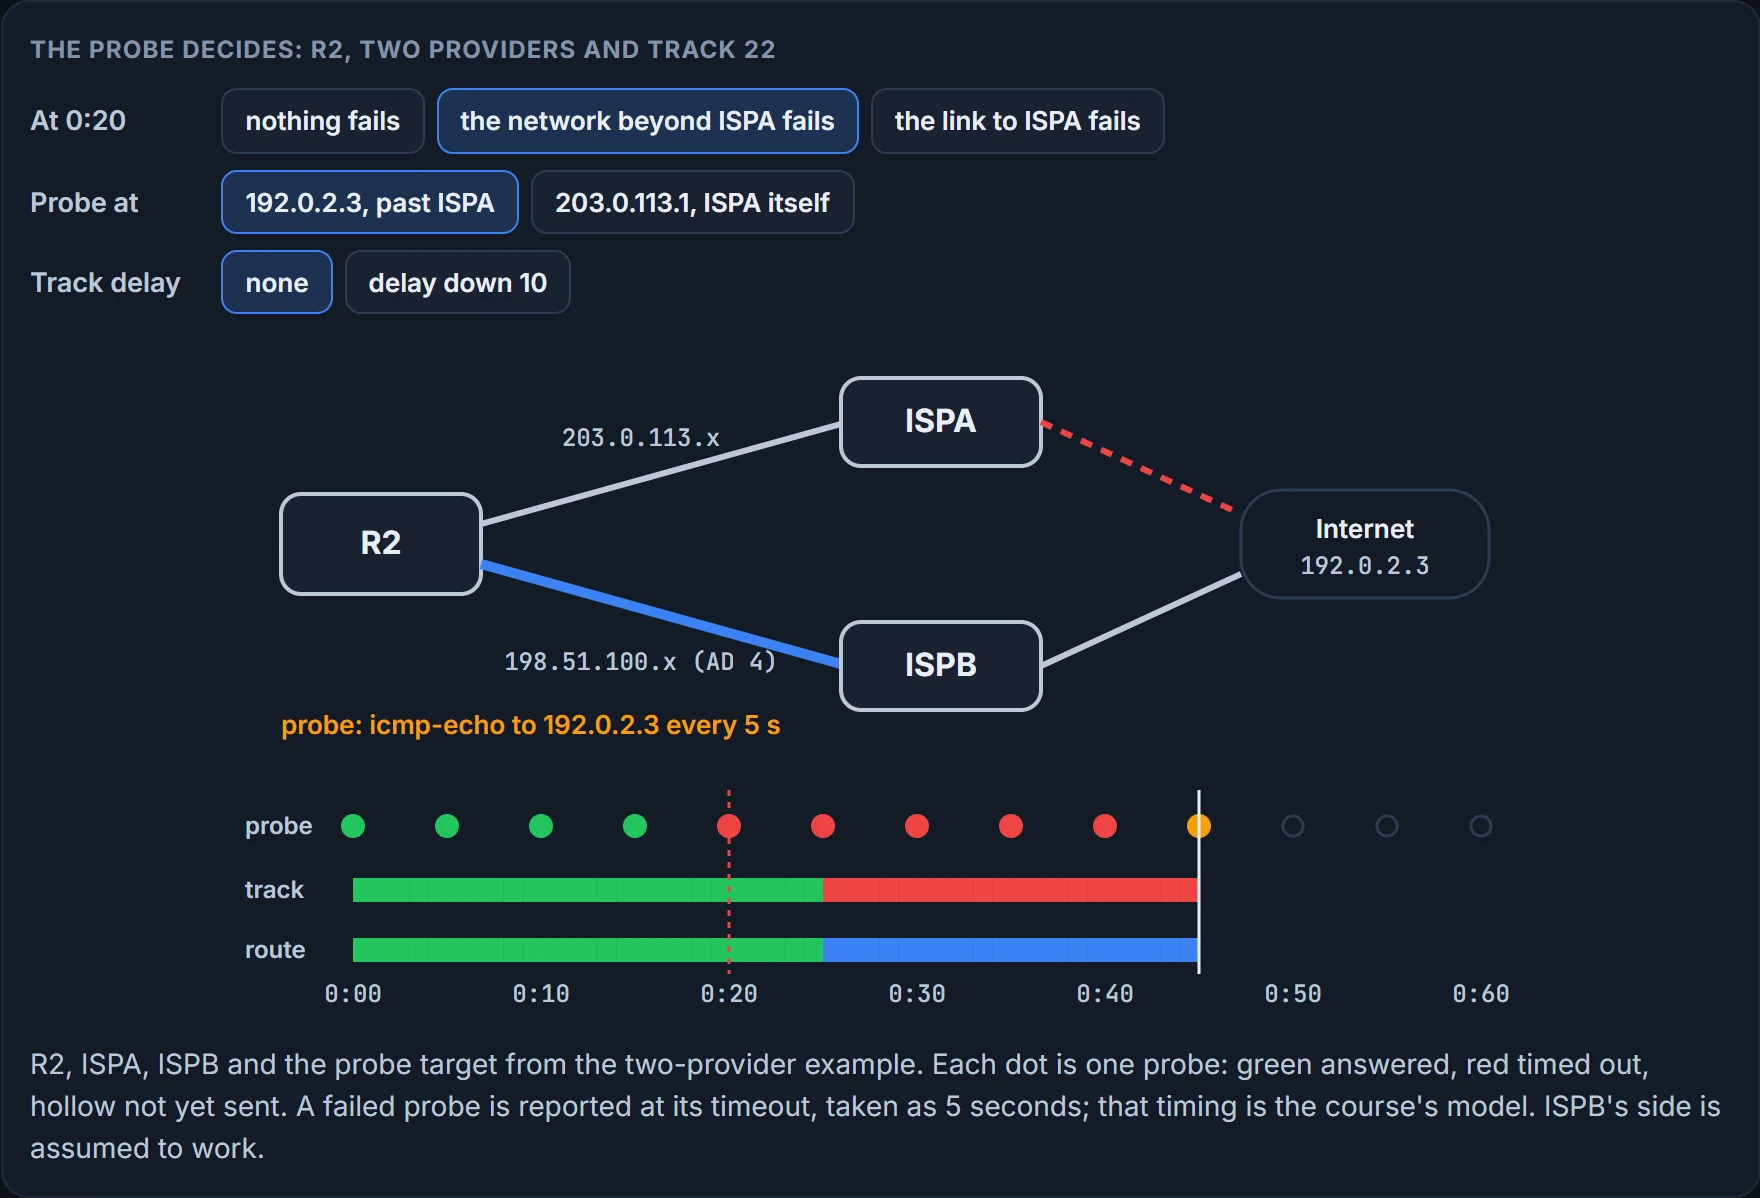
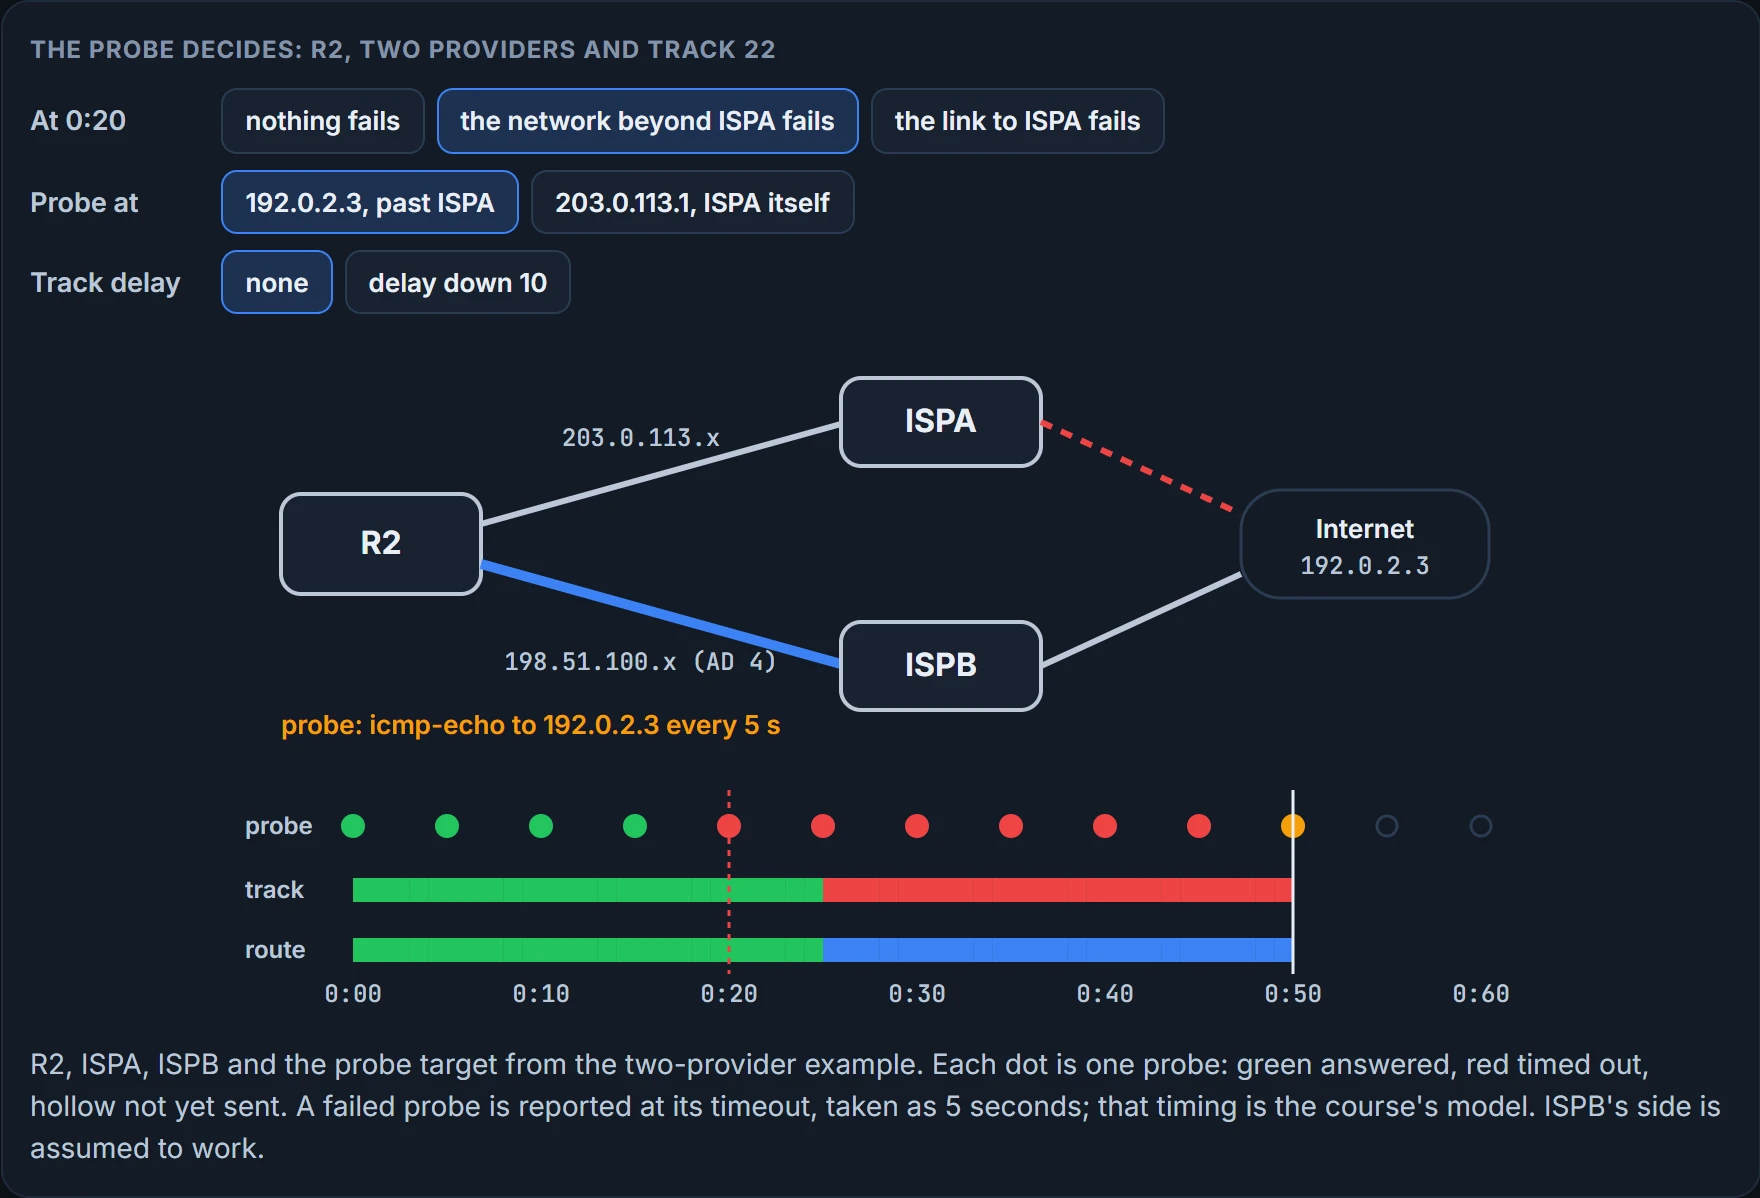
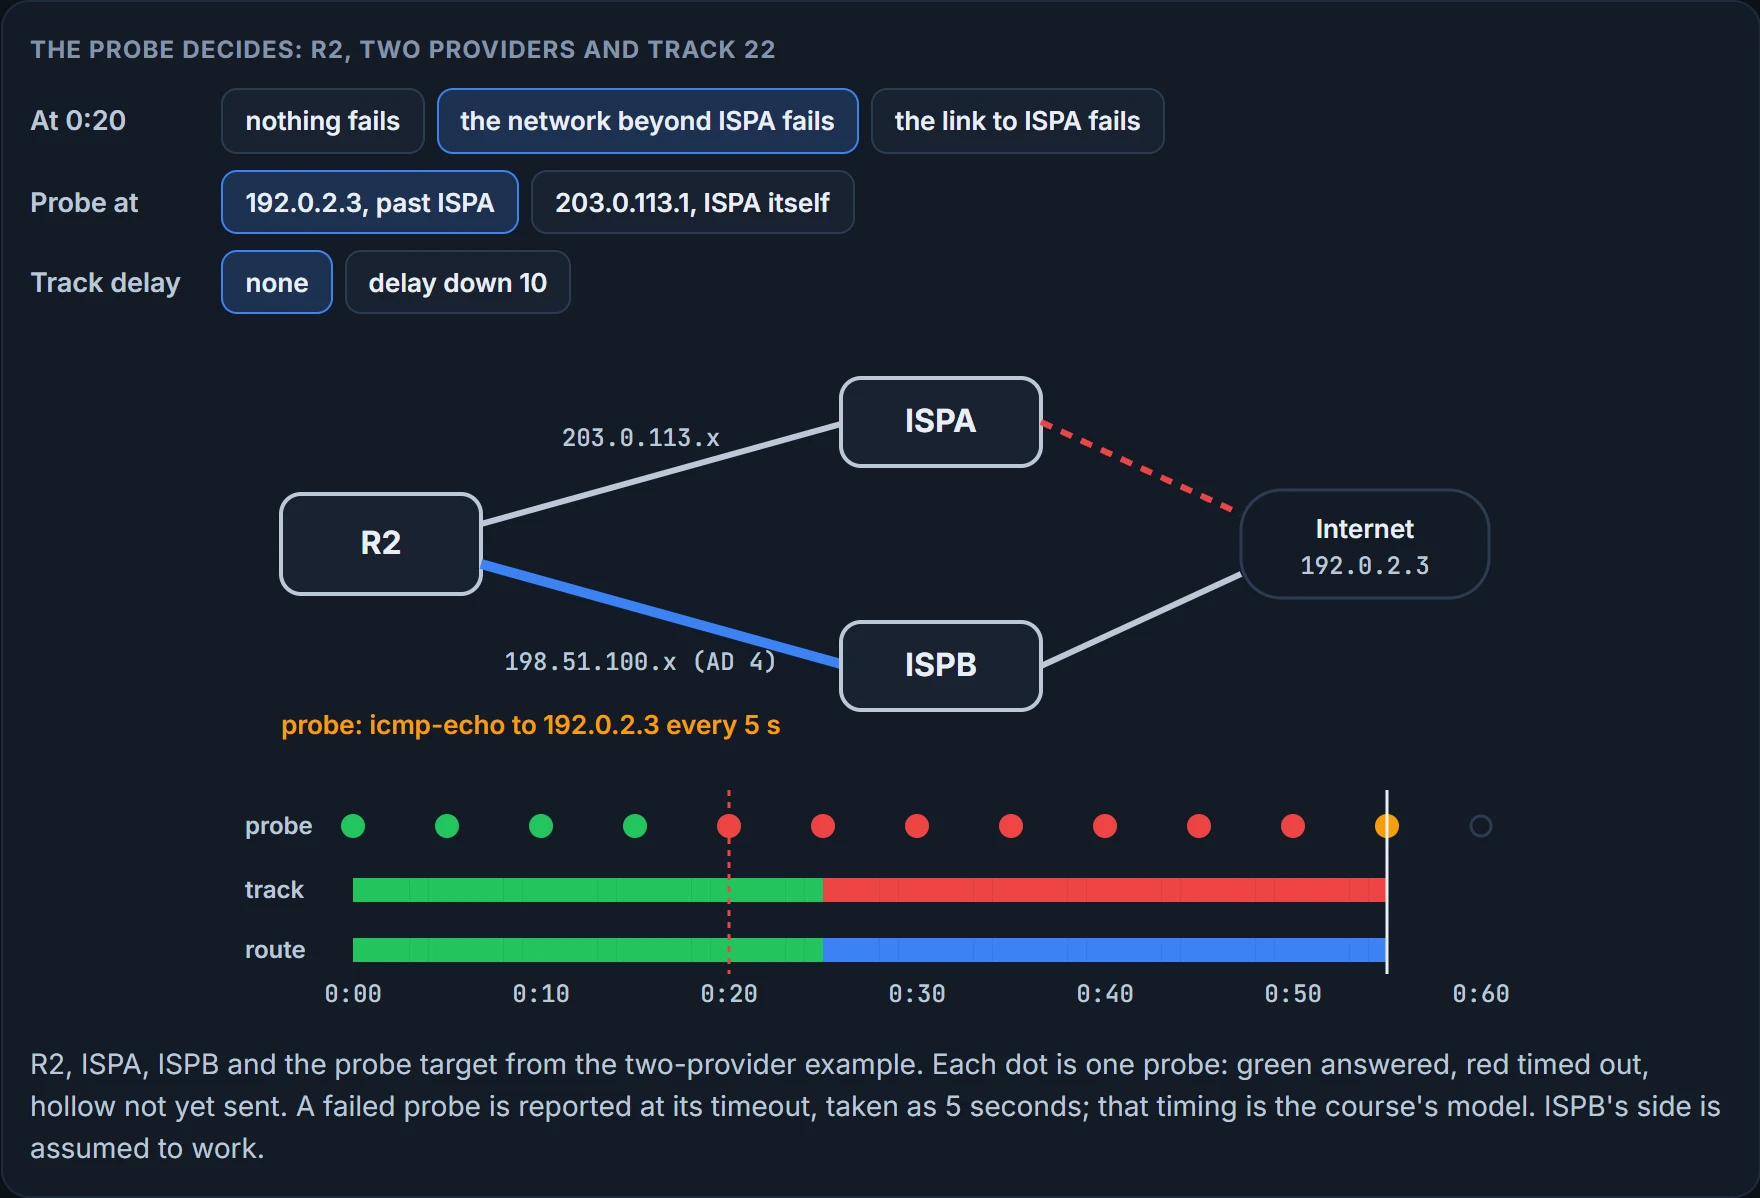
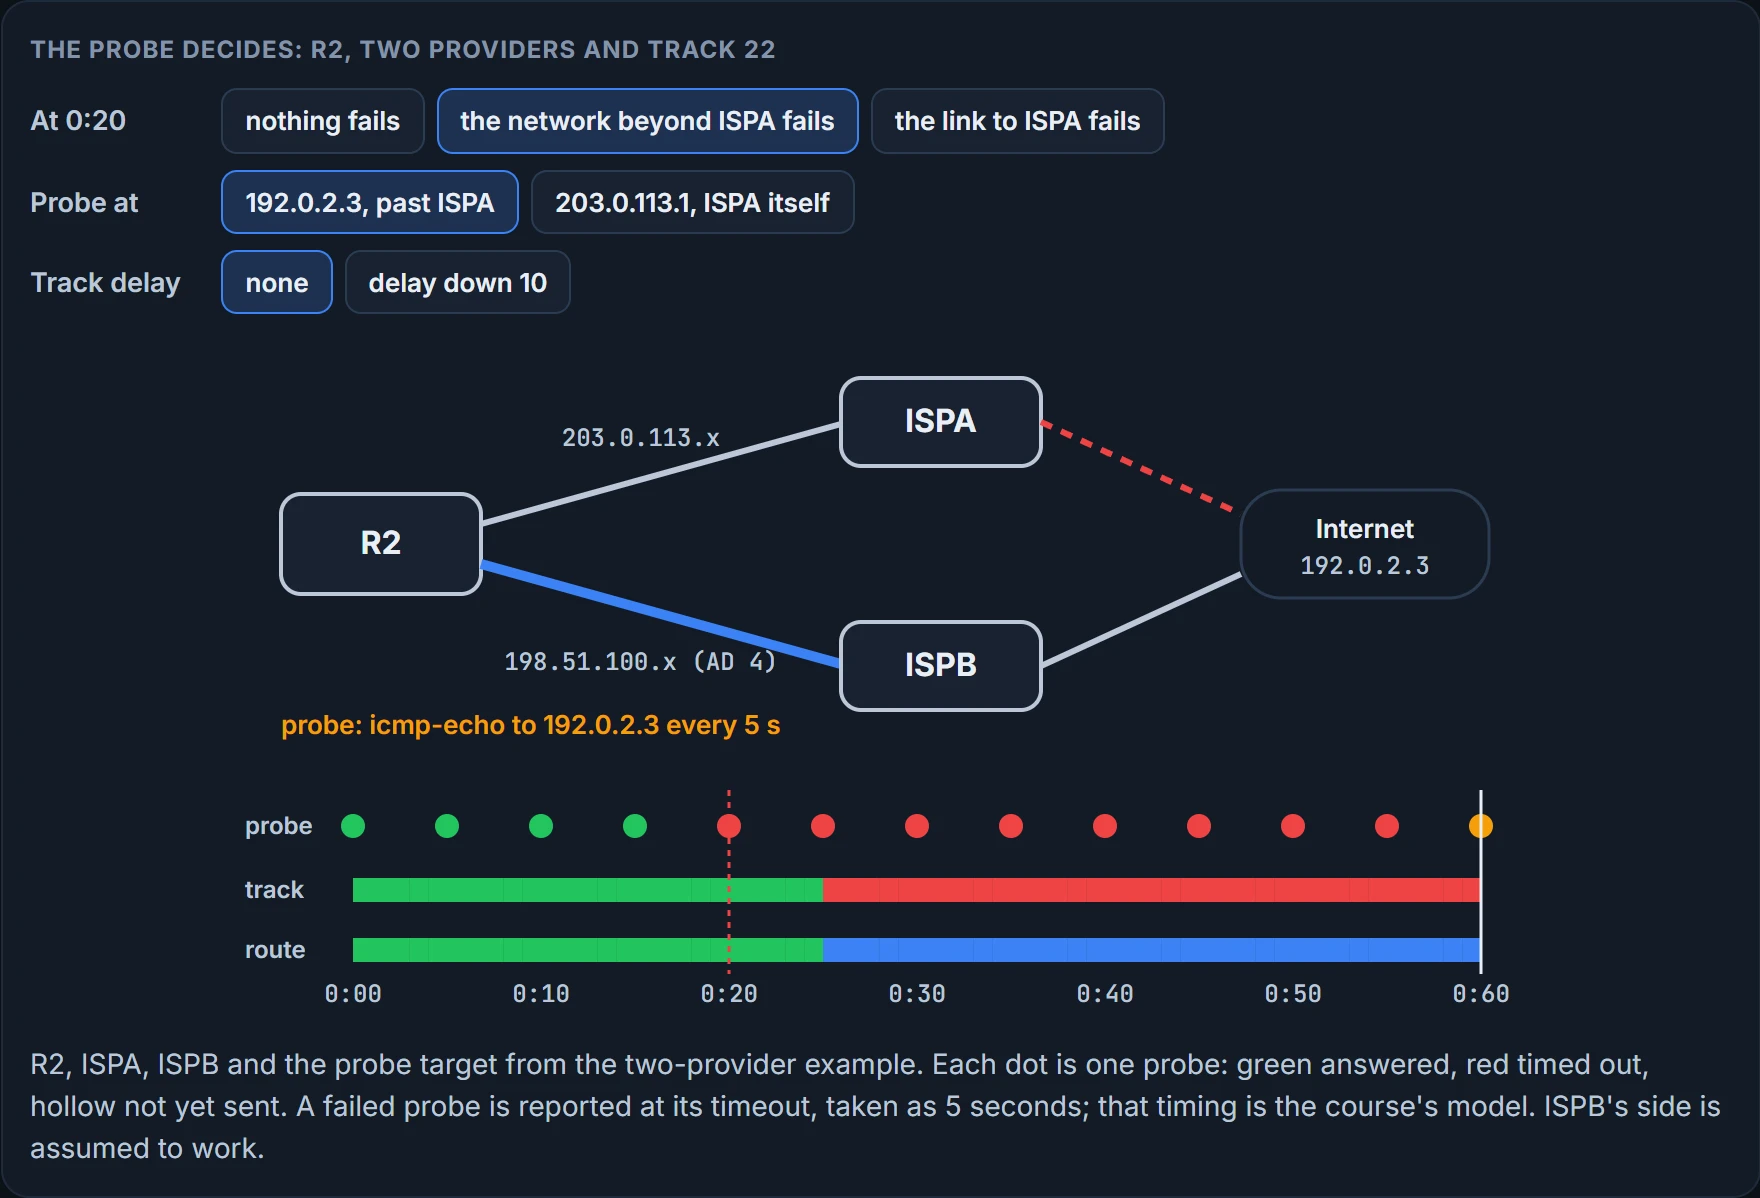
Now all three together, on R2 with two providers: ISPA on the primary link, 203.0.113.x, and ISPB on the backup link, 198.51.100.x; R2 is .2 on both and each ISP .1; 192.0.2.3 sits out in the internet.
R2# show run | i ip route|track
track 22 ip sla 1 reachability
ip route 0.0.0.0 0.0.0.0 203.0.113.1 track 22
ip route 0.0.0.0 0.0.0.0 198.51.100.1 4
R2# show run | s ip sla
ip sla 1
icmp-echo 192.0.2.3 source-ip 203.0.113.2
frequency 5
ip sla schedule 1 life forever start-time now
Two static defaults. The first points at ISPA's next hop and is tied to tracking object 22, which controls whether it's installed. track 22 ip sla 1 reachability is up while the IP SLA 1 probe succeeds and down while it doesn't, so the route is in the table while the object is up and removed while it's down. IP SLA 1 is an ICMP echo to 192.0.2.3 from R2's 203.0.113.2, scheduled to start now and last forever. The second route points at ISPB with administrative distance 4, and it isn't in the table by default: the route to ISPA has the default AD of 1, so ISPA wins. That's the floating static from the route selection lesson: a backup that waits.
Here's the question. R2's primary link stays up; its interface to ISPA never goes down. But past ISPA, 192.0.2.3 stops answering.
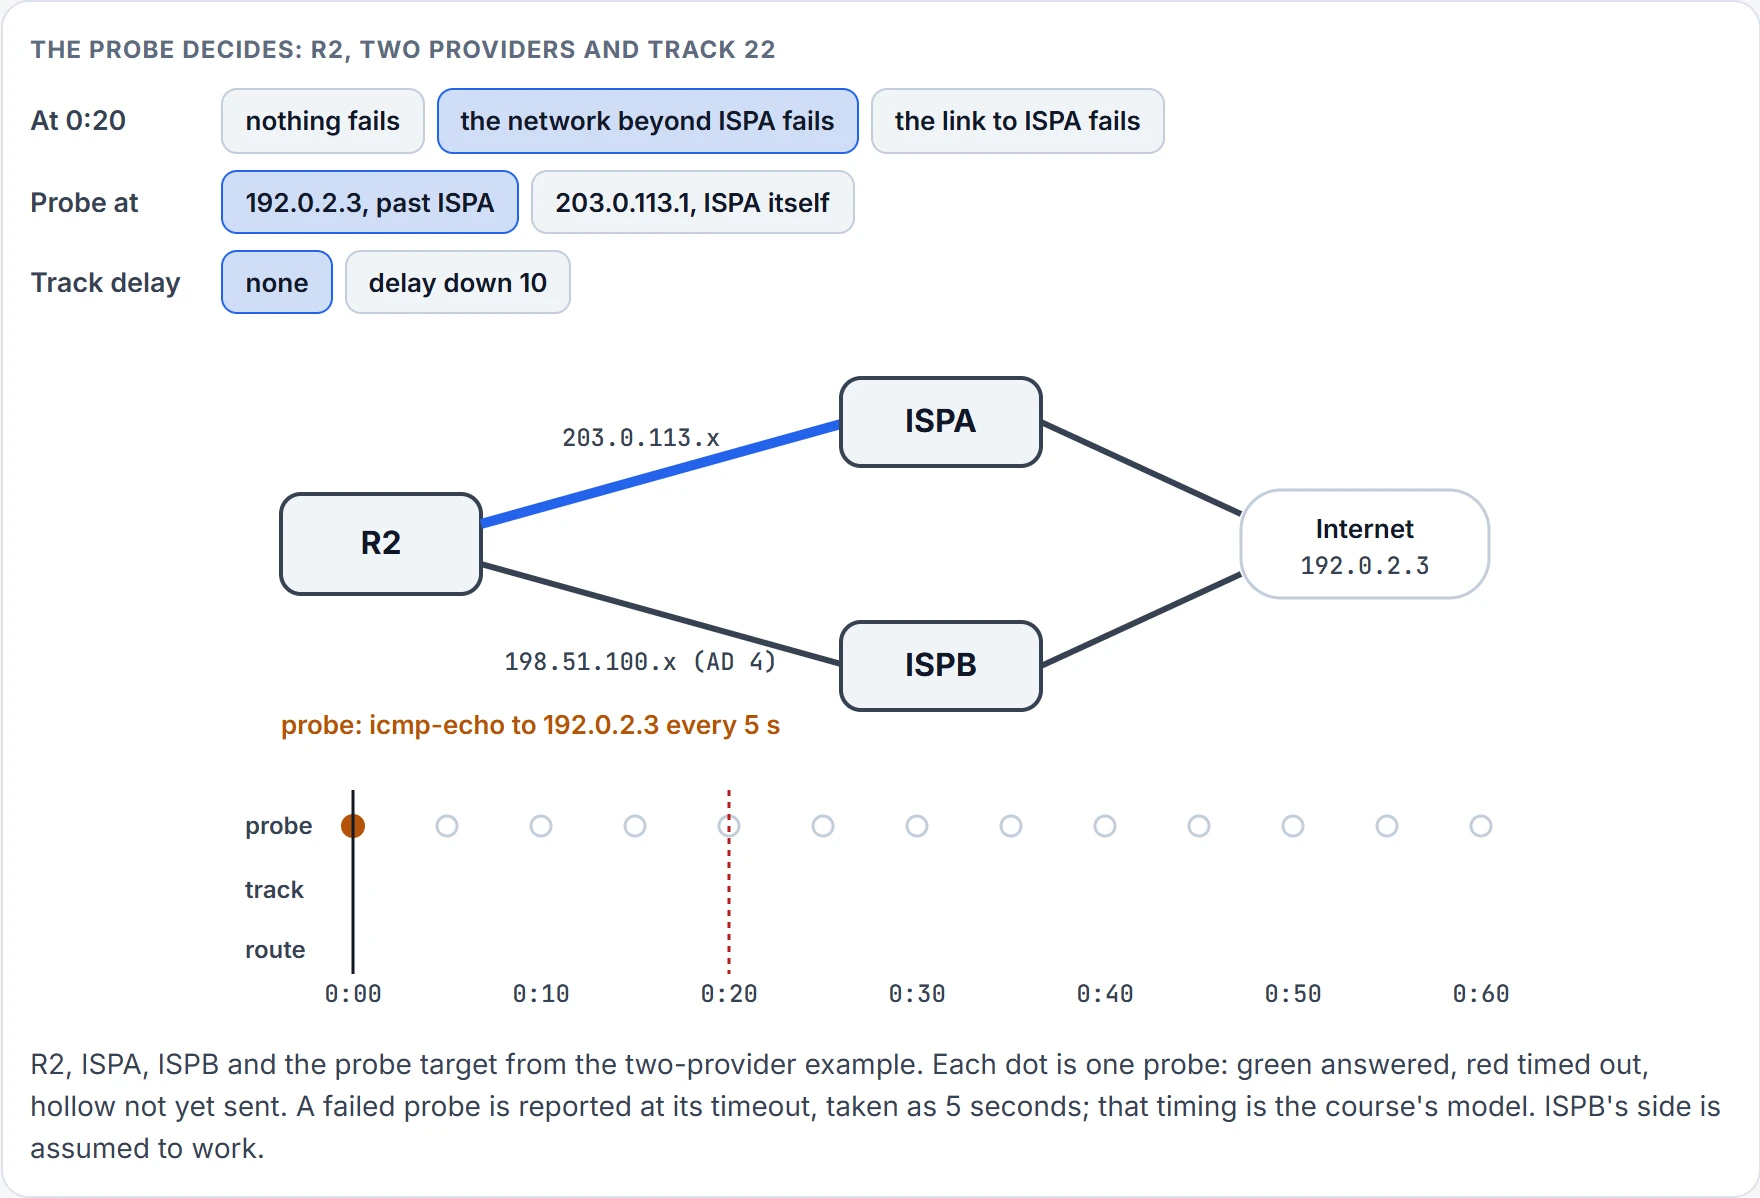
Step 1 of 13 0:00 · last probe: none yet · track 22: up · default route via 203.0.113.1 (ISPA) · users' traffic: gets out
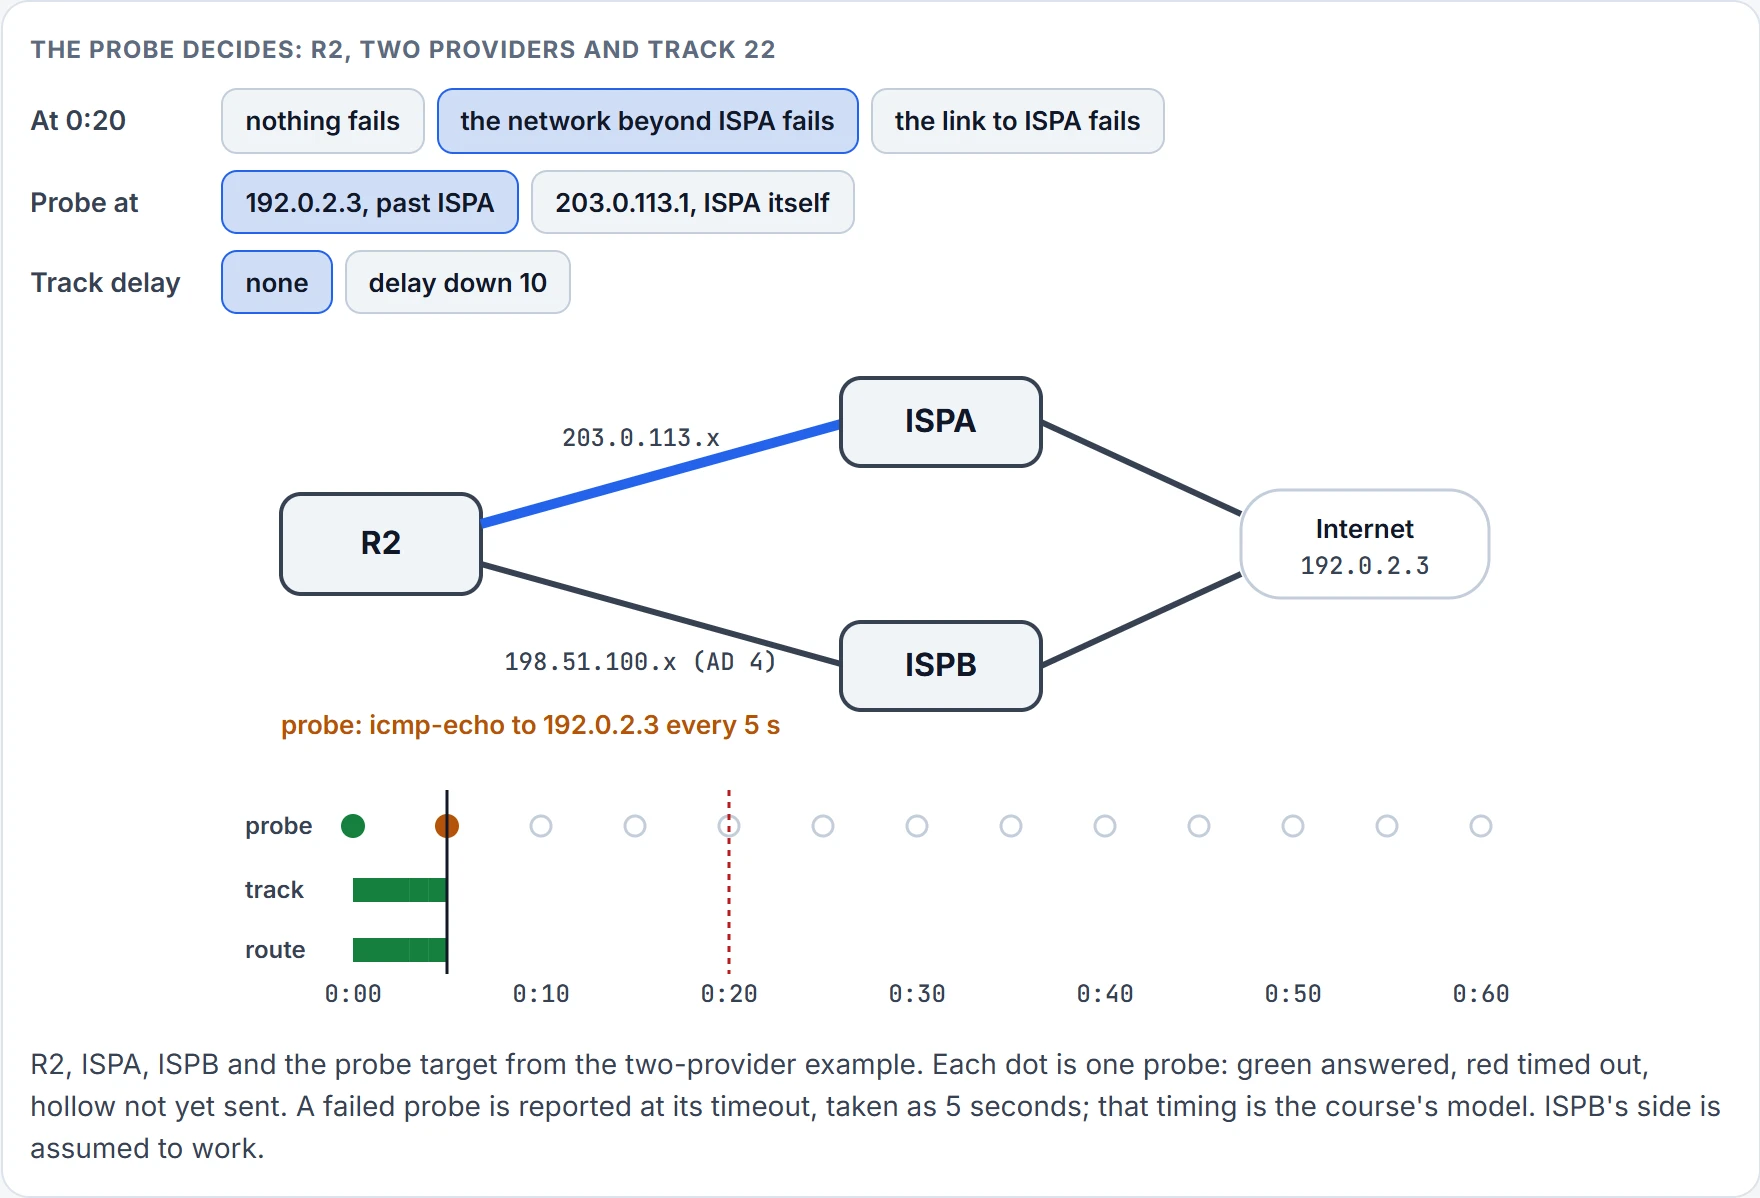
Step 2 of 13 0:05 · last probe: answered · track 22: up · default route via 203.0.113.1 (ISPA) · users' traffic: gets out
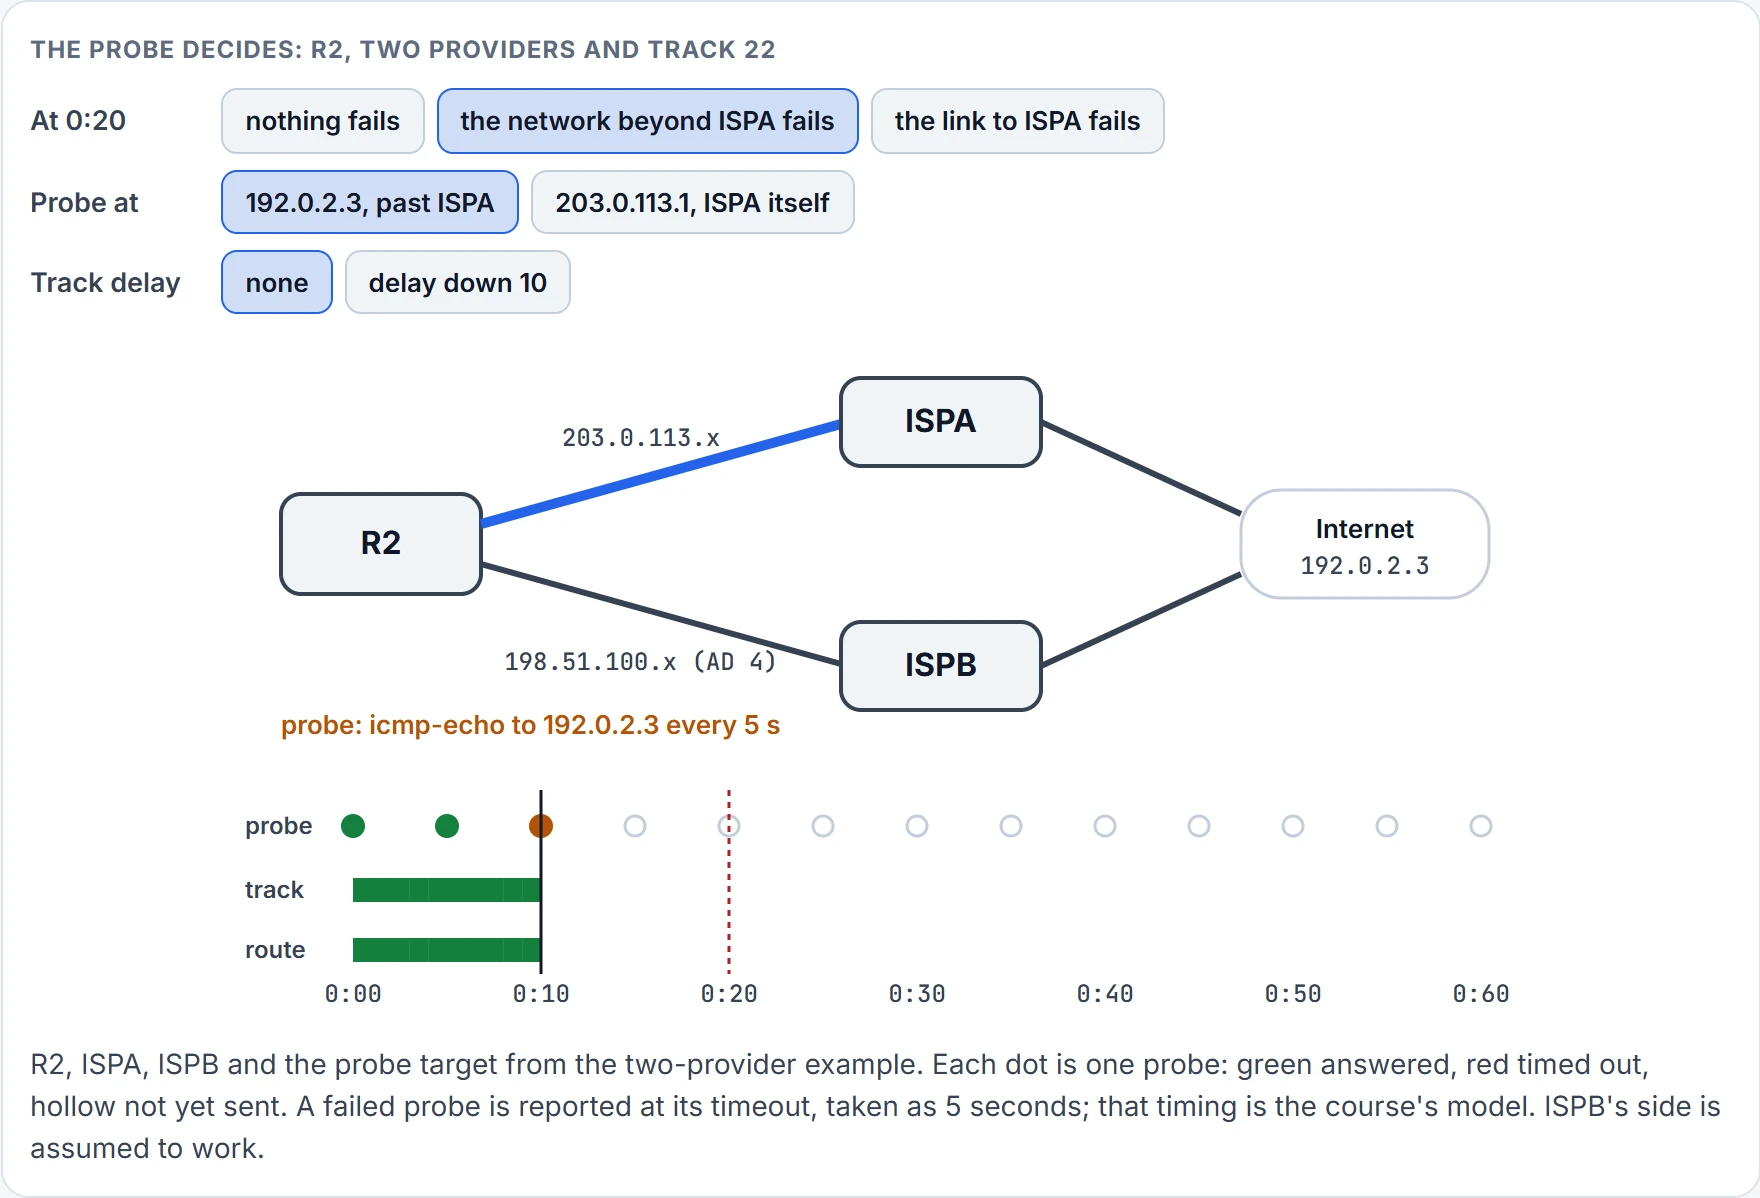
Step 3 of 13 0:10 · last probe: answered · track 22: up · default route via 203.0.113.1 (ISPA) · users' traffic: gets out
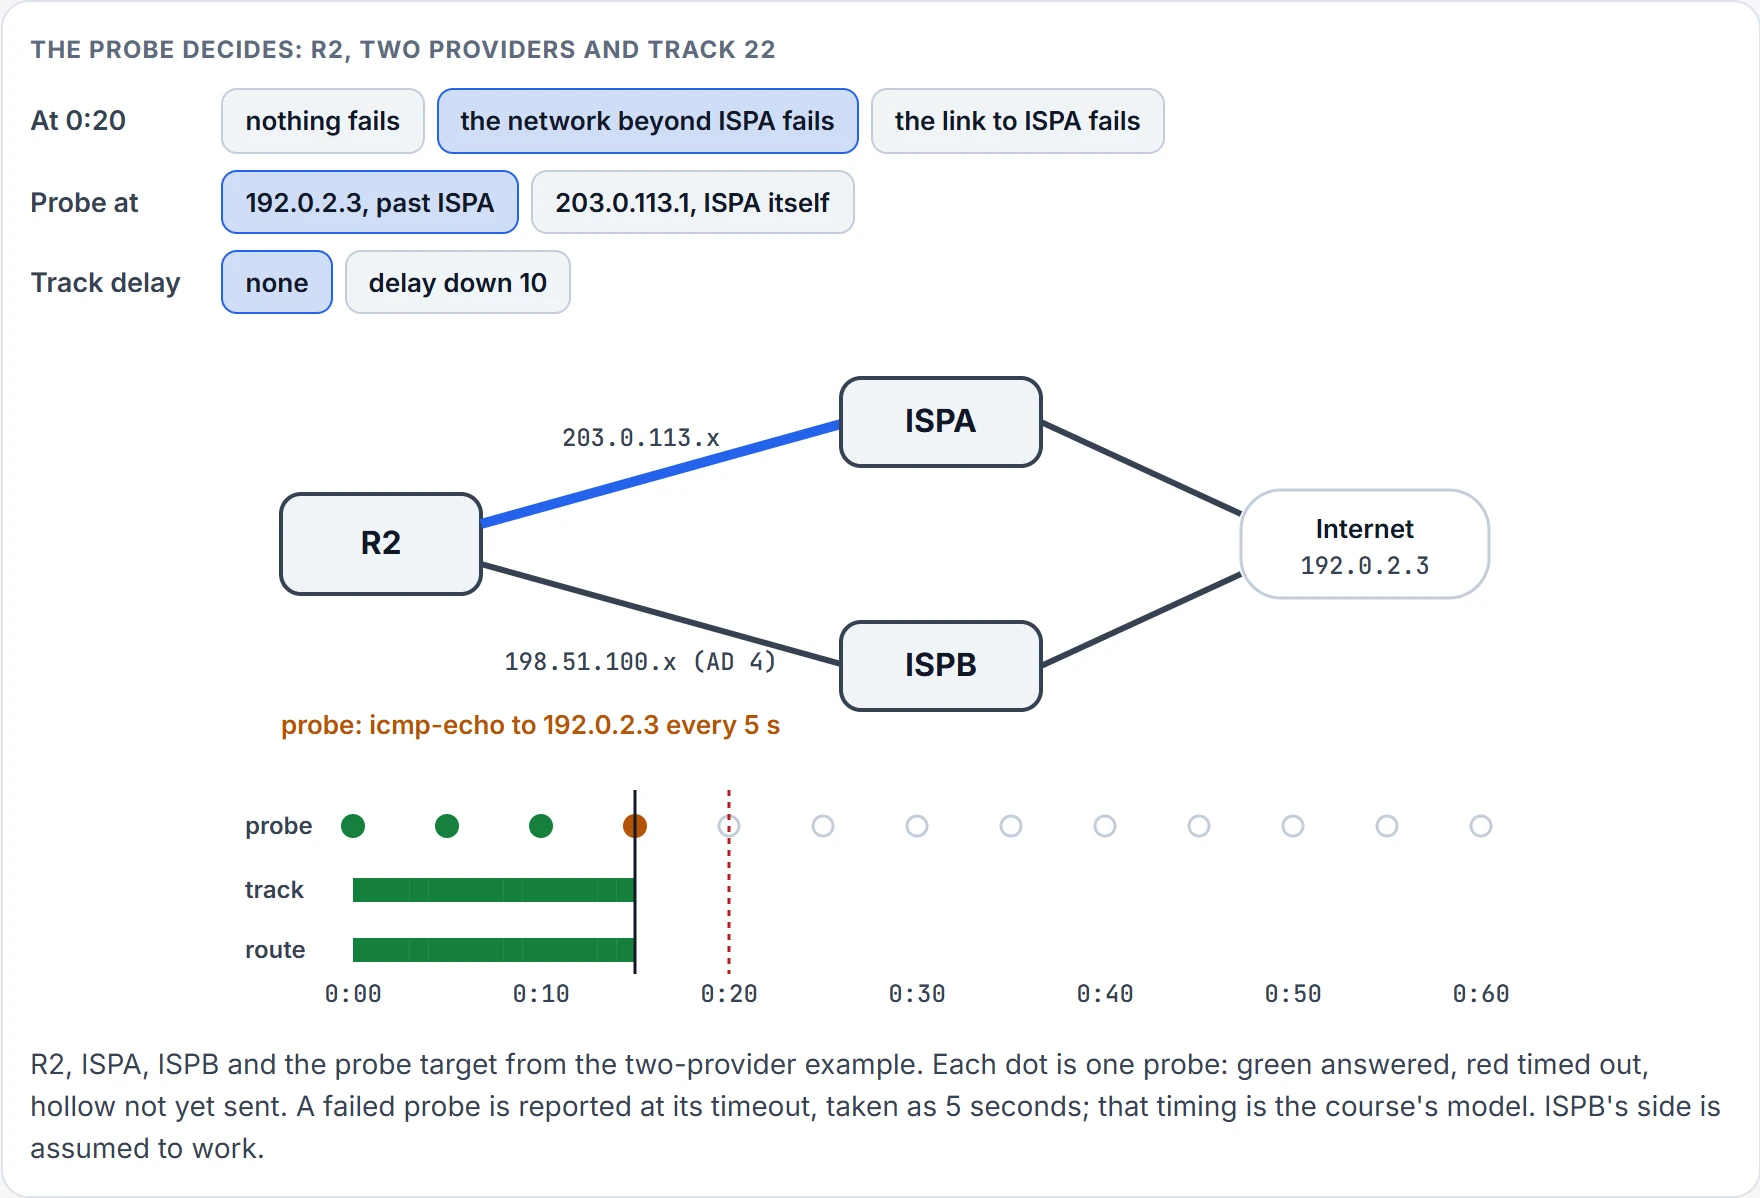
Step 4 of 13 0:15 · last probe: answered · track 22: up · default route via 203.0.113.1 (ISPA) · users' traffic: gets out
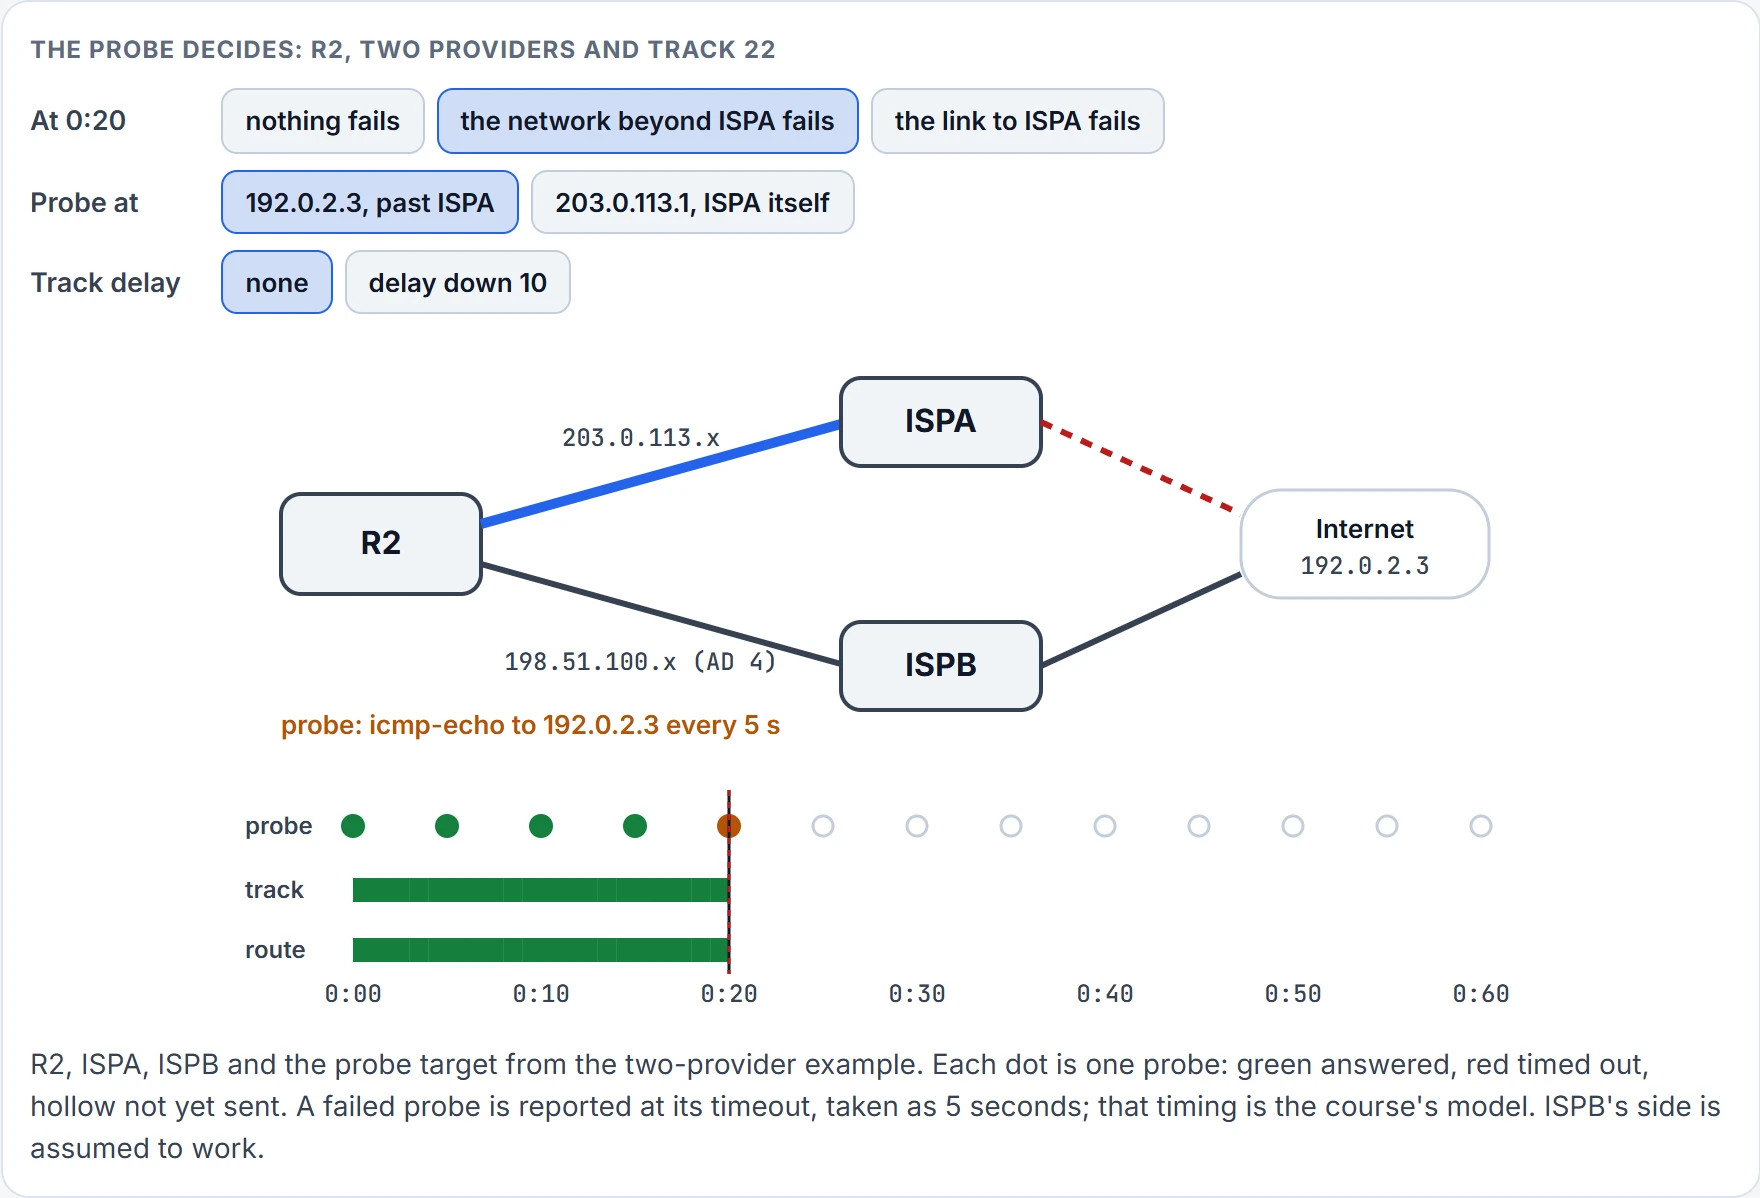
Step 5 of 13 0:20 · last probe: answered · track 22: up · default route via 203.0.113.1 (ISPA) · users' traffic: dies at ISPA
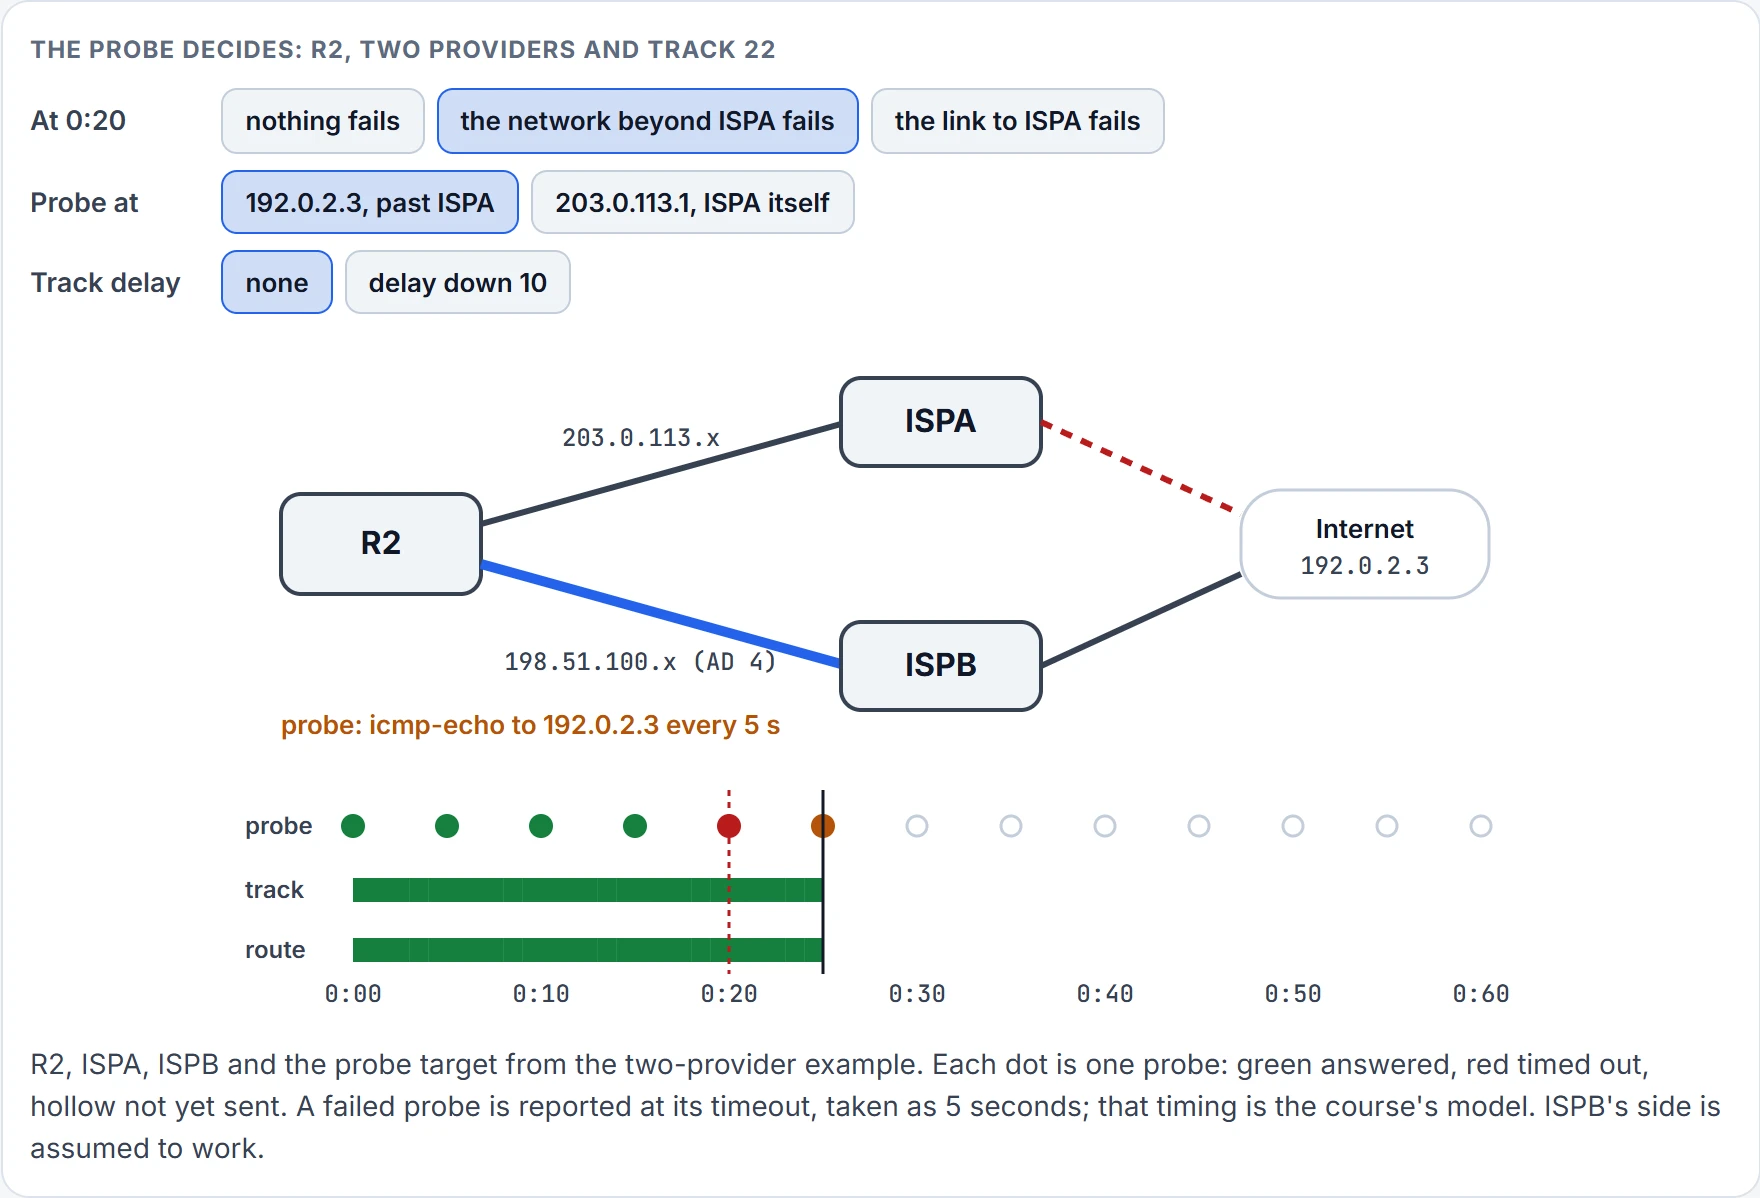
Step 6 of 13 0:25 · last probe: timed out · track 22: down · default route via 198.51.100.1 (ISPB) · users' traffic: gets out
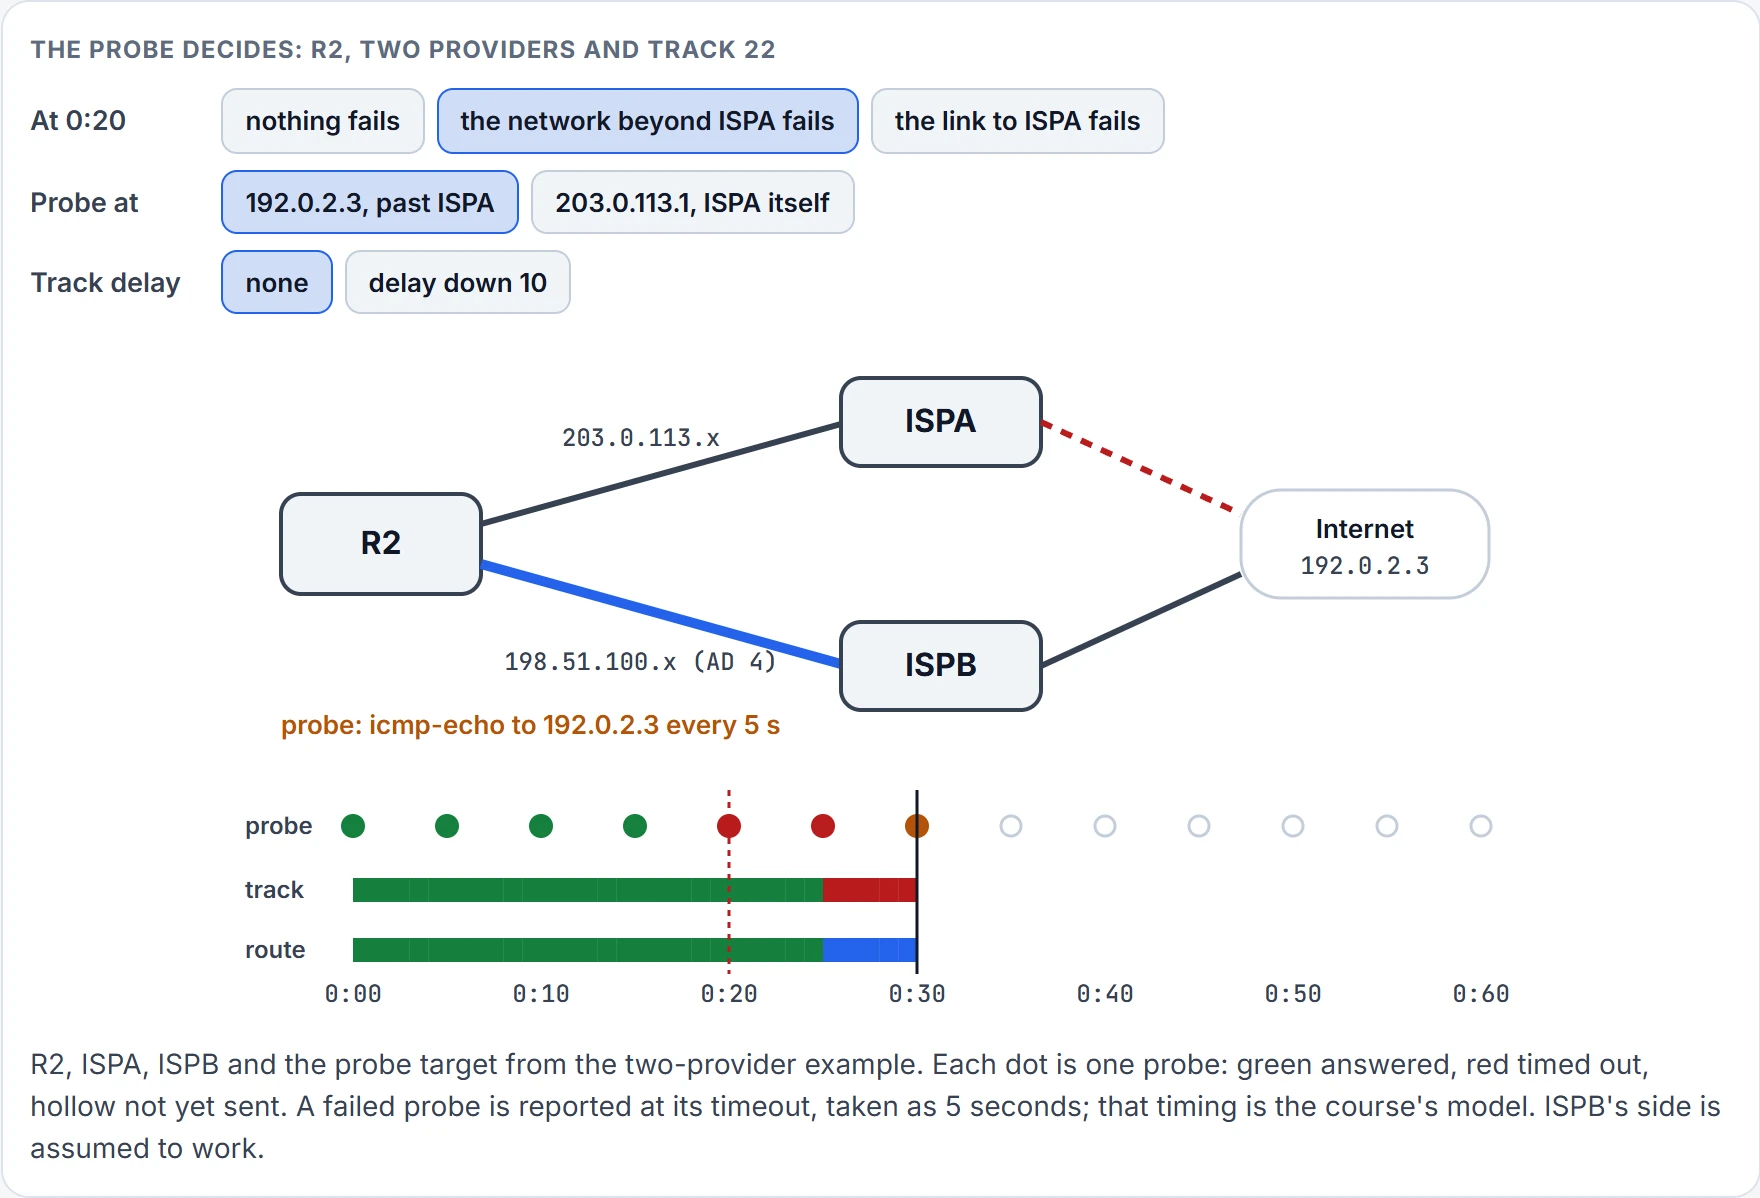
Step 7 of 13 0:30 · last probe: timed out · track 22: down · default route via 198.51.100.1 (ISPB) · users' traffic: gets out
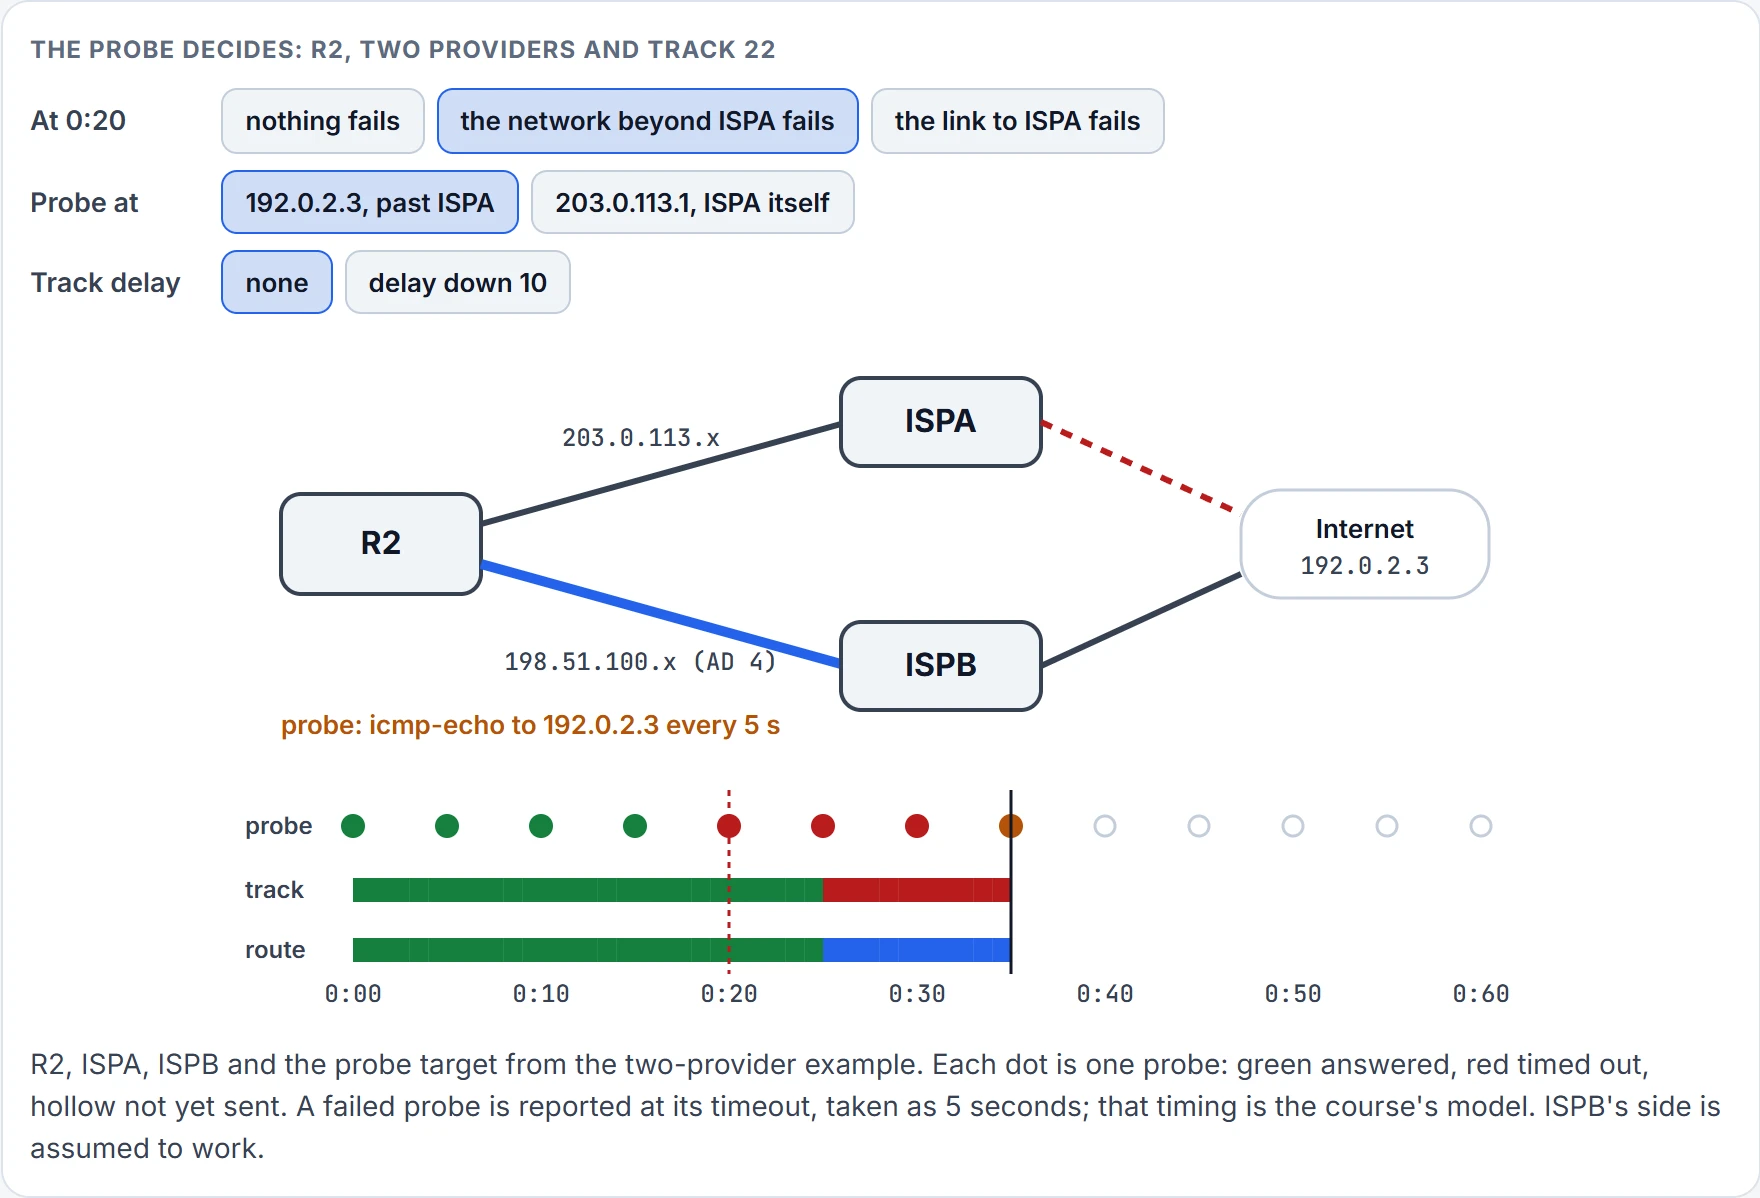
Step 8 of 13 0:35 · last probe: timed out · track 22: down · default route via 198.51.100.1 (ISPB) · users' traffic: gets out
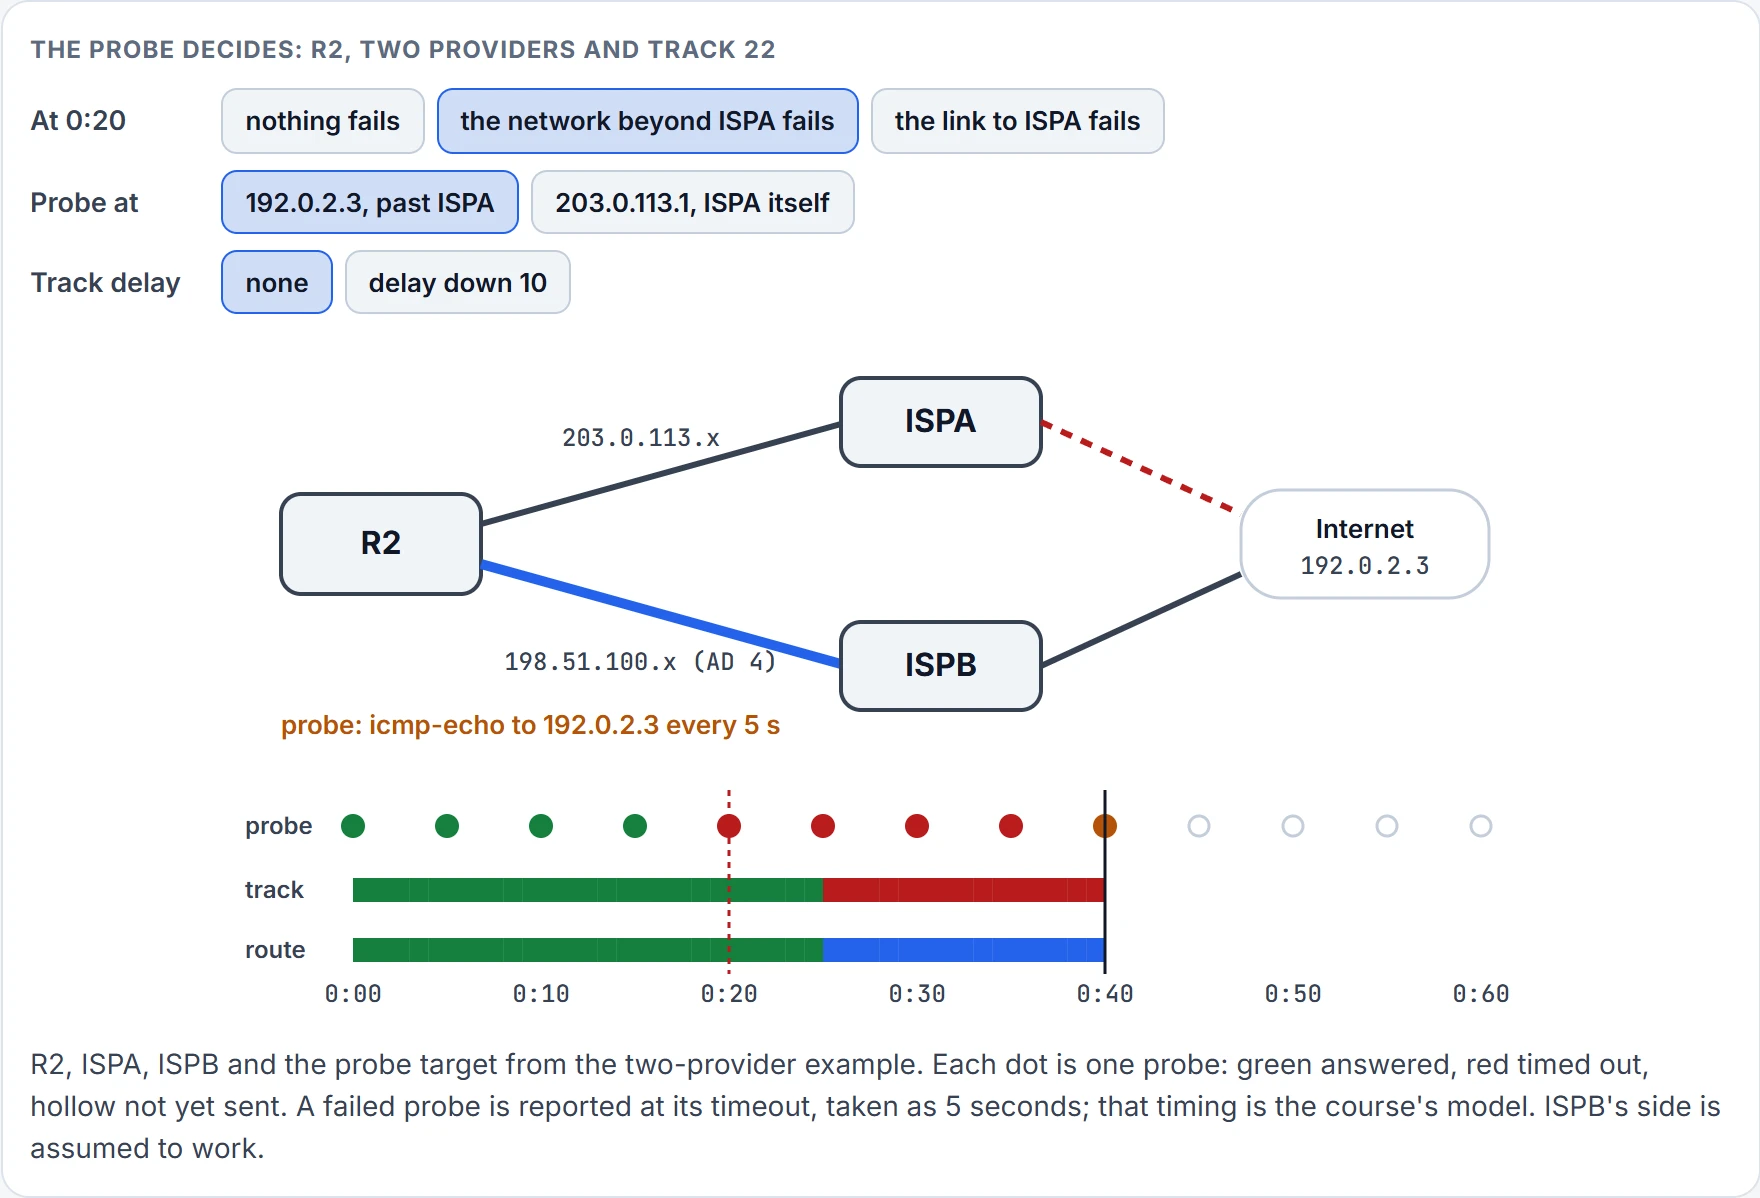
Step 9 of 13 0:40 · last probe: timed out · track 22: down · default route via 198.51.100.1 (ISPB) · users' traffic: gets out
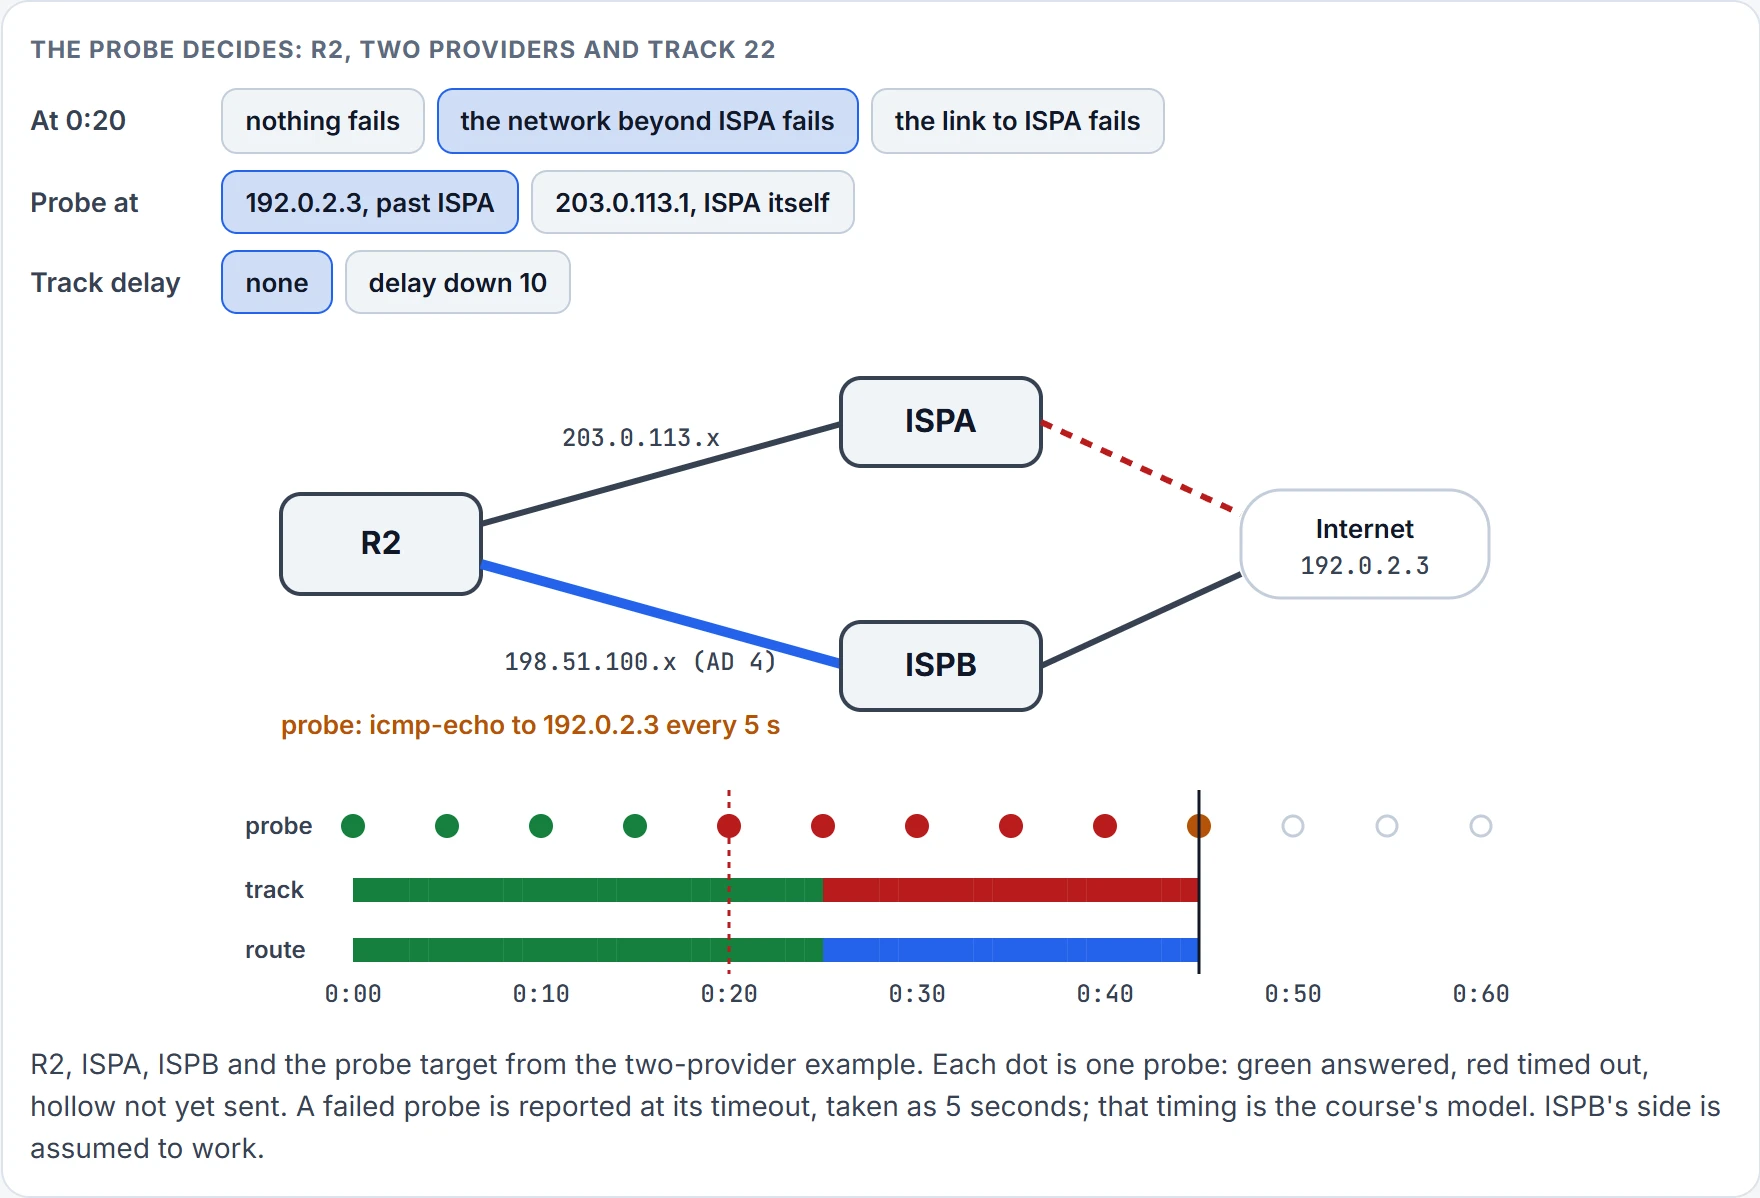
Step 10 of 13 0:45 · last probe: timed out · track 22: down · default route via 198.51.100.1 (ISPB) · users' traffic: gets out
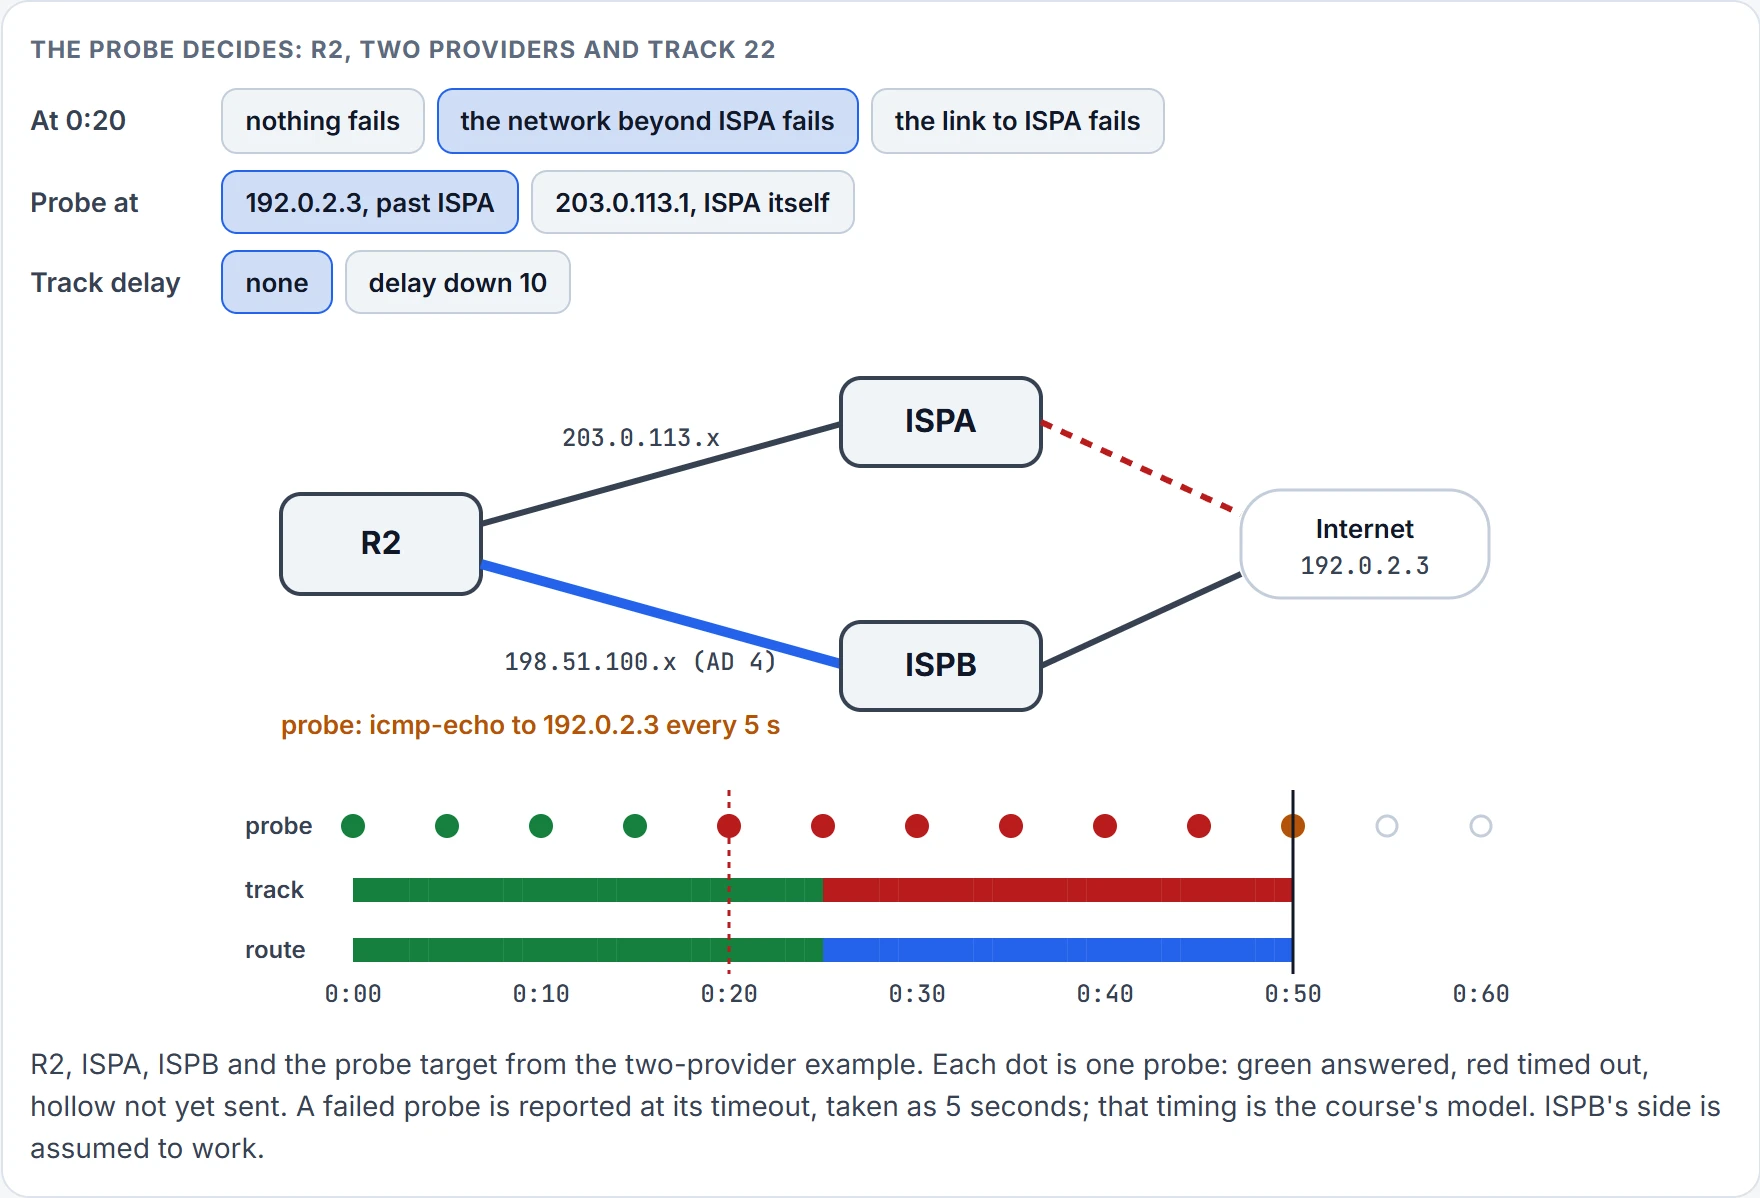
Step 11 of 13 0:50 · last probe: timed out · track 22: down · default route via 198.51.100.1 (ISPB) · users' traffic: gets out
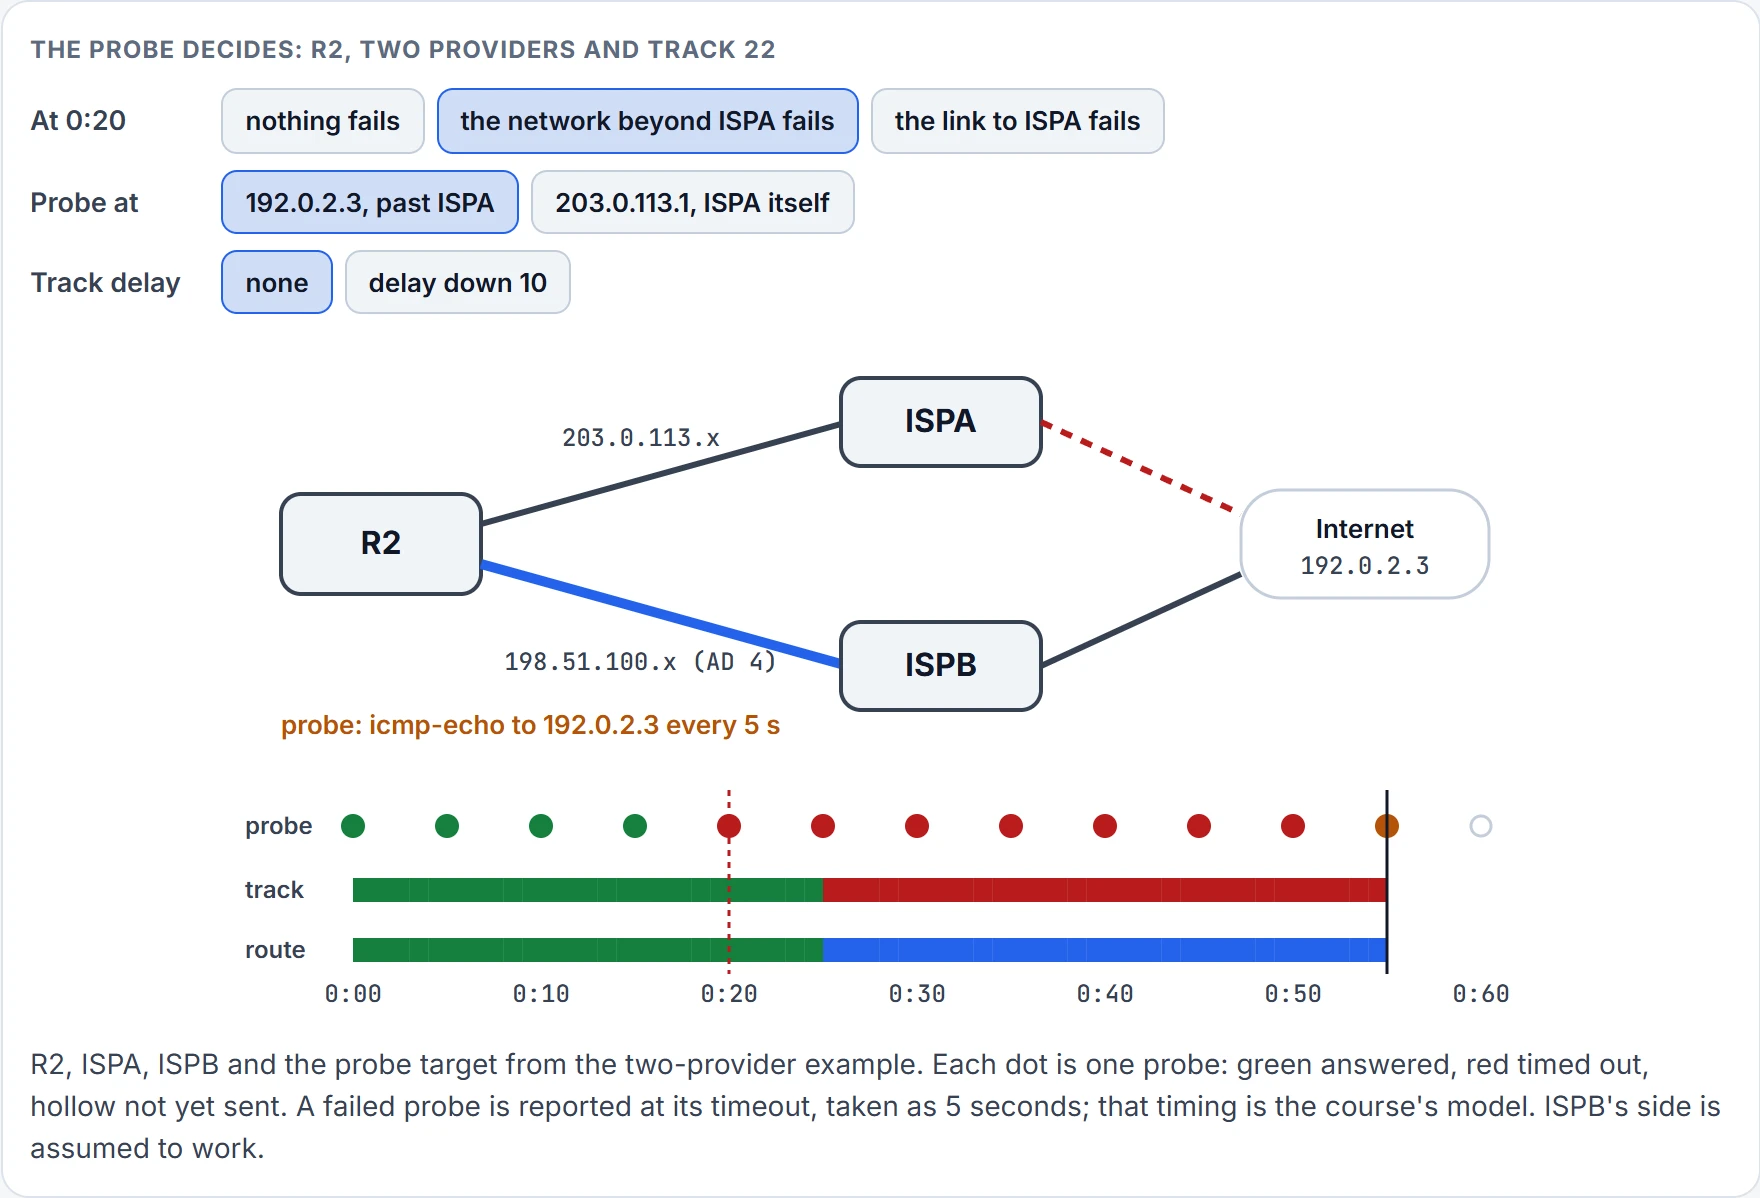
Step 12 of 13 0:55 · last probe: timed out · track 22: down · default route via 198.51.100.1 (ISPB) · users' traffic: gets out
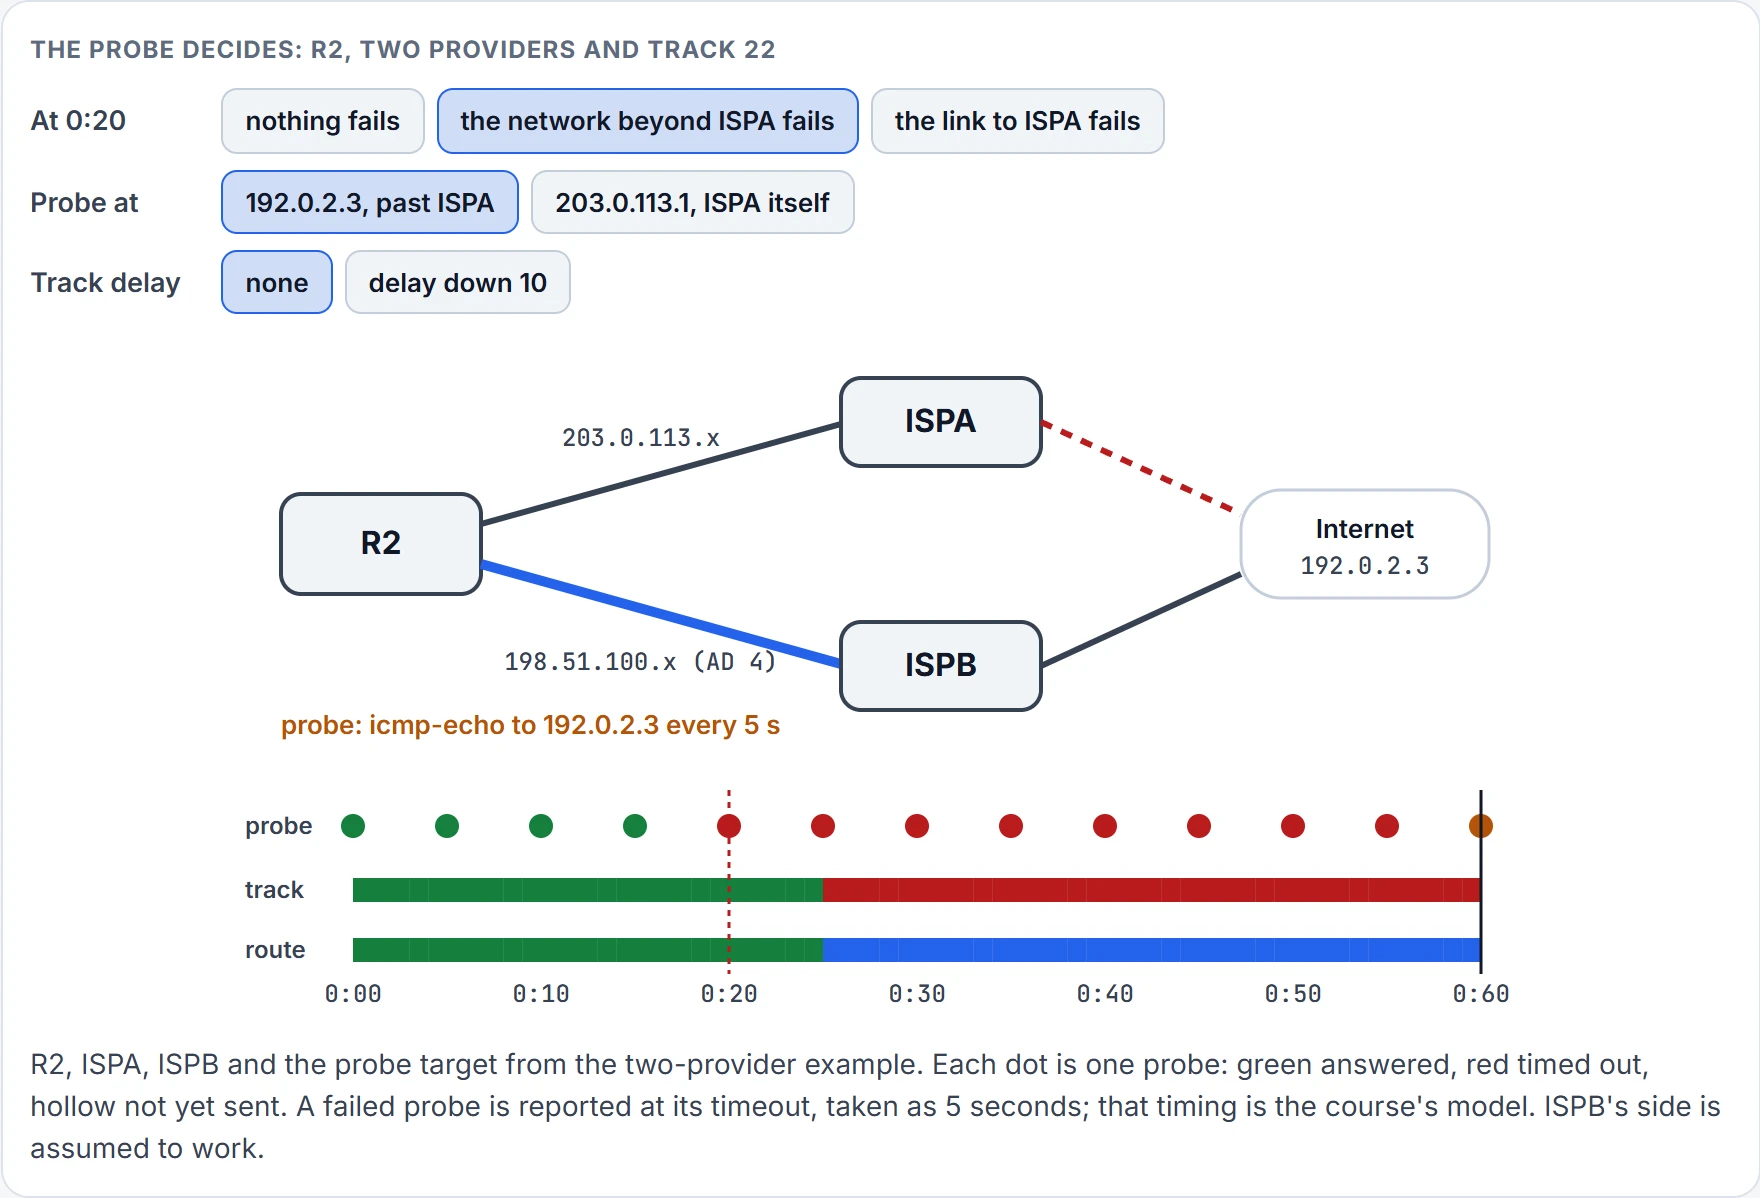
Step 13 of 13 0:60 · last probe: timed out · track 22: down · default route via 198.51.100.1 (ISPB) · users' traffic: gets out
Continue the lesson
The whole lesson, with its drawings and its questions. The rest of this section and 2 more after it.