
DNA Center Assurance
A user complains about yesterday afternoon, and everything works now: the CLI shows you only now. DNA Center Assurance keeps history. Overall, Network and Client Health score devices and clients from 1 to 10. Device 360 and Client 360 drill into one device or client, Path Trace draws a path through every hop, and Network Time Travel shows the network as it was.
By Arif, founder of Daveth · Updated
The full 13 min walkthrough is in Daveth Pro (Network). See what the plan opens
What this page answers
What do DNA Center health scores mean?
1 to 3 is a critical issue, in red; 4 to 7 a warning, in orange or amber; 8 to 10 no errors or warnings, in green; 0 means no data, in gray. Read it in “Three health pages and one scale”
What is Network Time Travel in DNA Center?
A way to see the network as it was at an earlier time, instead of trying to reproduce an issue. Network Health keeps 5-minute samples for the past 24 hours, so you can read yesterday afternoon's. Read it in “What now says about then”
What is Path Trace in DNA Center Assurance?
A graphical trace of the path a client's applications take through every device to a destination such as a server, run from Client 360 or Device 360. Read it in “Path Trace”
The complaint came in yesterday
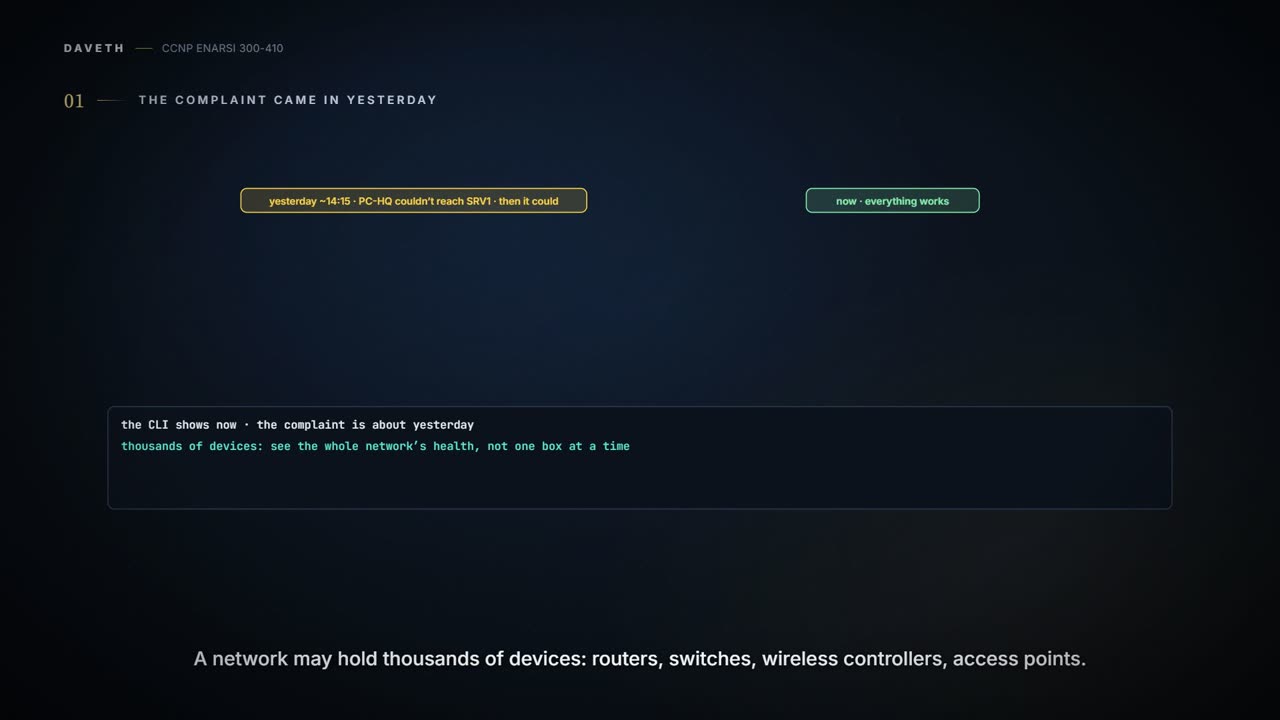
This morning, a message from Accounts: yesterday afternoon, somewhere around quarter past two, PC-HQ couldn't reach SRV1 for a while. Then it could again. You look now and everything works. The CLI shows you now. So the question for this whole page: the complaint came in yesterday, how do you see the network as it was then?
Start from scale. Your network may include thousands of devices, routers, switches, wireless LAN controllers and access points, and troubleshooting the old-fashioned way doesn't give the insight you need. You need to see the health of the network in its entirety.
DNA Center is the command and control center for Cisco DNA: configure and provision devices in minutes, monitor, troubleshoot and optimise the network proactively with AI and machine learning, and integrate third-party systems. Assurance is one component of it. With Assurance you predict problems sooner through proactive monitoring, and get insight from network devices, network applications, network services and clients.
DNA Center as a whole is far bigger than this exam. The objective is narrow: troubleshoot network problems using Assurance, for connectivity, monitoring, device health and network health, and that's the scope here. You reach it from the menu in the upper-right corner: Assurance, and then the dashboard, AI network analytics or settings you want.
One more thing about the name. The product has since been renamed Catalyst Center. The exam still says DNA Center, and so does this page.
Three health pages and one scale
Your first tool is the Overall Health page: Assurance, then Health. It gives an overview of the health of the network devices and the clients, from information gathered over the most recent 3 hours, 24 hours or 7 days. The Network Devices area and the Client area each give an overall score, from the health of the devices and of the wired and wireless clients. It also shows the health of network services, AAA and DHCP server successes and failures, with View AAA Dashboard and View DHCP Dashboard for more. And at the bottom, the Top 10 Issues: click one and you get its details, its impact and suggested actions to fix it.
Select Network on the Health dashboard and you get the Network Health page; select Client and you get the Client Health page. They show the operational status of the network and client devices; devices with issues are highlighted, with possible remediations suggested. Network Health shows the percentage of healthy devices by category, access, core, distribution, router and wireless, and the information can be displayed in 5-minute intervals over the past 24 hours. Hold on to that last sentence. Under it, the Network Devices list gives each device's type, address, OS version, reachability, issue count and location, and an overall health score.
The score is the one scale everything uses:
- 1 to 3: a critical issue, shown in red;
- 4 to 7: a warning, shown in orange or amber;
- 8 to 10: no errors or warnings, shown in green;
- 0: no data available, shown in gray.
Client Health does the same for clients, wired and wireless: the percentage of connected clients that are healthy, and a Client Devices list with each client's identifier, address, type, when it was last seen, the switch or access point it's connected to, and location, plus a score on the same scale.
So what is that percentage? The Network Health score is the number of healthy devices, a score from 8 to 10, divided by the total number of devices, and it's calculated every 5 minutes. A category's score is the same division inside one category. It's a count, not an average.
90%. Nine devices are in the 8-10 band, one isn't: 9 divided by 10. A 7 isn't "nearly fine" for this sum; it's a warning, and it counts against the network the same way a 1 does. And a device's own score is the minimum of its KPI scores, system health, data-plane connectivity and control-plane connectivity, so one bad metric is the device's score. For a router: CPU or memory over 95 percent scores 1, WAN connectivity down scores 1, and errors on an infrastructure link score 8.
Device 360, Client 360 and the issues
Click any device on Network Health, or any client on Client Health, and you're in Device 360 or Client 360. They drill into that one device or client and show its topology, throughput and latency from various times and applications, so you see how it performed over a period. Device 360 displays details about network devices; Client 360 about client devices.
Here's what that looks like on someone else's network: a Client 360 for an iPad at 10.30.100.41 with application and onboarding issues, and a Device 360 for a switch at 10.41.54.172 with several issues, where clicking one gives a description and possibly suggested actions. One of that switch's issues is worth reading in full: "Excessive time lag between Cisco DNA Center and Device 10.41.54.172". The description says DNA Center can't process the device's data accurately if the clocks are more than 3 minutes apart, and the suggested actions start with checking the device's time and its NTP servers. That's an NTP problem, found from a health page.
Issues carry a priority:
- P1: critical, needs immediate attention, can have a wide impact on network operations;
- P2: major, can affect several devices or clients;
- P3: minor, localised or minimal impact;
- P4: a warning, not an immediate problem.
The ones you'll meet on a routed network are in the router list, in the Connectivity category: an EIGRP adjacency failure with a neighbour, an OSPF adjacency failure, BGP down or flapping, an interface connecting network devices down. On that switch's Device 360, the EIGRP and OSPF adjacency failures are P2.
An issue is open, resolved or ignored. You can resolve or ignore one yourself, and for some, an interface that's down, for example, the system resolves the issue on its own once the condition no longer exists. So by the time you look, yesterday's problem may already say Resolved.
Path Trace
Next, Path Trace, sold as the ping and traceroute you have always dreamed of. You see, graphically, the path that a client's applications and services take through every device on the network to the destination, a server for example, and a few clicks do what would take 5 to 10 minutes at the command line. You run it from Client 360 or Device 360. A typical trace shows the hops from a wireless client to a server, with a CAPWAP tunnel arching over the hops it covers and an ACL marked on the hop that has one.
How does it know the path? The controller collects topology and routing data from the devices it has discovered and uses that data to calculate the path between the two ends, then draws it with each device and its address. CDP has to be on in the devices. And it has limits, among them: no path trace from a router's loopback interface, and, in release 2.3.7, a device with both IPv4 and IPv6 addresses isn't supported.
No. Path Trace drew the path the routing data says traffic takes. It didn't prove a packet made the trip: a path can be right on paper and still drop the application's traffic, at a filter that isn't marked, or at the far end. To prove delivery, send traffic. Path Trace is the fast way to find where to look.
What now says about then
Here's the page's first question, made concrete.
Nothing at all. Green now is a statement about now. The complaint is about yesterday afternoon, and Network Health keeps 5-minute samples for the past 24 hours; so look at the samples from yesterday afternoon.
That's Network Time Travel. It lets you hop into a time machine and see the cause of a network issue instead of trying to reproduce it. Timeline views exist for overall network health, for network devices' health, for client health, and for each device and client in Device 360 and Client 360. Pick a moment on the timeline and the page shows that moment. In release 2.3.7 the timeline's arrow buttons go back as far as 30 days.
Assurance also has AI Analytics. It performs assurance and analytics on switches, routers and wireless controllers, so critical metrics are acted on before an incident occurs, an incident in ITIL's sense being any disruption of a service or reduction in its quality. With KPIs linked to the business's goals, AI and machine learning set customised baselines and speed up remediation through automation.
And when you want every issue and event Assurance has found in one place: the Issues and Events dashboard, from the Assurance menu, with open, resolved and ignored issues.
Continue the lesson
The whole lesson, with its drawings and its questions. 3 more sections after the ones above.