
Logging and debugging
Whether anything recorded what happened at 2 a.m. was decided before 2 a.m., by the logging configuration. Every message carries a facility, a severity from 0 to 7 and a mnemonic. Console, monitor and buffer log everything by default; the buffer holds 8192 bytes and overwrites its oldest lines. service timestamps stamps messages, and a debug shows what is happening as it happens.
By Arif, founder of Daveth · Updated
The full 16 min walkthrough is in Daveth Pro (Network). See what the plan opens
What this page answers
What are the syslog severity levels?
Eight, from 0 to 7: emergencies, alerts, critical, errors, warnings, notifications, informational and debugging. The digit sits in the middle of every message, as in %SYS-5-CONFIG_I, severity 5. Read it in “The number in the middle of every message”
Why do log messages have no timestamp?
Because no service timestamps has been executed, or the platform leaves them unstamped by default. Configure service timestamps log and service timestamps debug, each with datetime or uptime. Read it in “What time it says”
What is the default logging buffer size on a Cisco router?
8192 bytes. When it fills up the oldest entries are overwritten, so a busy router can lose the very message you needed. Read it in “Where a message survives the night”
The answer was decided before 2 a.m.
Something happened at 2 a.m. How do you find out what?
You read what the router wrote down. That's the whole method, and it hides the catch: you can only read what something kept. Whether anything kept a record of 2 a.m. was decided before 2 a.m., by the logging configuration. This lesson is about that configuration, and about the messages you make on purpose when the log isn't enough: debugs.
The health of your network and of the clients on it is critical to success, and monitoring it with the right tools keeps you on top of issues as they show up. But tools break, or don't give you the results you need, and then you have to troubleshoot the tools that help you troubleshoot. The tools in this part of the course are syslog, SNMP, IP SLA, Object Tracking, NetFlow and Flexible NetFlow, BFD's benefits, and how DNA Center Assurance helps. Syslog is this lesson's; the next lessons take SNMP, IP SLA and tracking, NetFlow, and Assurance, and BFD had a lesson of its own.
Syslog is a system message log that a device generates and that can be collected locally or sent to and collected on a remote server. Locally means on the router: its console, the terminals of people logged in, and a buffer in memory. Remotely means a syslog server. Four places. A logging process decides which messages go to which of them, and it handles debug output as well as system messages.
One command shows you all four. show logging verifies your syslog configuration, confirms that logging is enabled, and shows the messages stored in the buffer. Here's R4's, with the lines you need first:
R4# show logging
Syslog logging: enabled (0 messages dropped, 0 messages rate-limited, 0 flushes,
0 overruns, xml disabled, filtering disabled)
     Console logging: level informational, 116 messages logged, xml disabled,
     Monitor logging: level informational, 0 messages logged, xml disabled,
     Buffer logging: level debugging, 175 messages logged, xml disabled,
     Trap logging: level warnings, 108 message lines logged
        Logging to 10.1.100.100 (udp port 514, audit disabled,
              link up),
              2 message lines logged,
Read it as a map. "Syslog logging: enabled" is the process itself. Then one line per destination: console, monitor (the terminals of remote sessions), buffer, and trap, which is the name this output uses for logging to a server, here 10.1.100.100 on UDP port 514. Each destination carries its own level. Four destinations, four levels, and they don't have to agree. That's the first thing to read on any router where a message went missing.
We haven't confirmed on a router that its logging process handles debug output this way.
The number in the middle of every message
Look at two lines from R4's buffer:
Jul 24 21:54:50.422: %SYS-5-CONFIG_I: Configured from console by console
Jul 24 21:57:16.070: %OSPFv3-4-ERRRCV: OSPFv3-10-IPv6 Received invalid packet: Bad Checksum
from FE80::C829:FFF:FE50:54, GigabitEthernet2/0
After the timestamp comes a percent sign and three parts: the facility (SYS, OSPFv3), a single digit from 0 to 7 that is the message's severity, and a mnemonic that names the message, then the text. So the first line is severity 5 and the second severity 4. That digit decides everything that follows.
Eight severities. The syslog protocol numbers them 0, emergency, to 7, debug, and IOS gives each a keyword:
| Level | Keyword | Meaning |
|---|---|---|
| 0 | emergencies | system is unusable |
| 1 | alerts | immediate action needed |
| 2 | critical | critical conditions |
| 3 | errors | error conditions |
| 4 | warnings | warning conditions |
| 5 | notifications | normal but significant conditions |
| 6 | informational | informational messages |
| 7 | debugging | debugging messages |
Lower number, more severe. Now the rule, and it's the whole of the filtering: set a destination to a level and it takes messages at that level and every numerically lower one. R4 shows it for each destination. Console and monitor are at informational, which means informational and all lower levels. The buffer is at debugging, which means all levels. Trap logging, the server, is at warnings, which means warnings and all lower levels. So "warnings" includes errors, critical, alerts and emergencies; it doesn't include notifications.
You've seen this rule work in the EIGRP lessons without its name. If you log at severity level 5, an EIGRP K-value mismatch gives you a message like this one:
%DUAL-5-NBRCHANGE: EIGRP-IPv4 100: Neighbor 10.1.12.2 (GigabitEthernet1/0) is down: K-value mismatch
and if you've set up syslog for level 6, a neighbor on another subnet gives you a severity-6 one:
%DUAL-6-NBRINFO: EIGRP-IPv4 100: Neighbor 10.1.21.2 (Gigabit
Ethernet1/0) is blocked: not on common subnet (10.1.12.1/24)
The second needs level 6 because it is a 6. At level 5 you'd never see it.
What happens when nobody sets a level? By default, console, monitor and buffer logging display messages with severity debugging, 7, and lower: everything. Logging to a server is disabled by default, but when it's enabled, all severity levels are sent to the server. That's the exam's default. Some current platforms give the server informational instead, and the console and terminals debugging. Don't depend on either: set the level you want.
You need syslog to generate the right type of messages at the right time, so in all cases, if you aren't receiving the syslog messages you expect, verify that the correct level is configured. Each destination's level is its own line: logging console, logging monitor and logging trap, each followed by a level, limit the console, the terminal lines and the syslog servers. The buffer's size is set with logging buffered, in the next section.
Now R4's buffer again. Under those two lines are eight more, and they look different:
Jul 24 21:58:20.014: NTP message received from 192.168.1.10 on interface 'GigabitEthernet2/0'
(10.1.34.4).
Jul 24 21:58:20.018: NTP Core(DEBUG): ntp_receive: message received
Jul 24 21:58:20.022: NTP Core(DEBUG): ntp_receive: peer is 0x00000000, next action is 3.
Jul 24 21:58:20.030: NTP message sent to 192.168.1.10, from interface
'GigabitEthernet2/0' (10.1.34.4).
The same four lines follow again at 21:59:25. No percent sign, no severity digit. On our reading that's debug output, from an NTP debug someone started on R4. A debug's output goes to the logging process too. At what level? Our reading is debugging, level 7: these lines sit only in the destination set to debugging, and debugging is the keyword for severity 7.
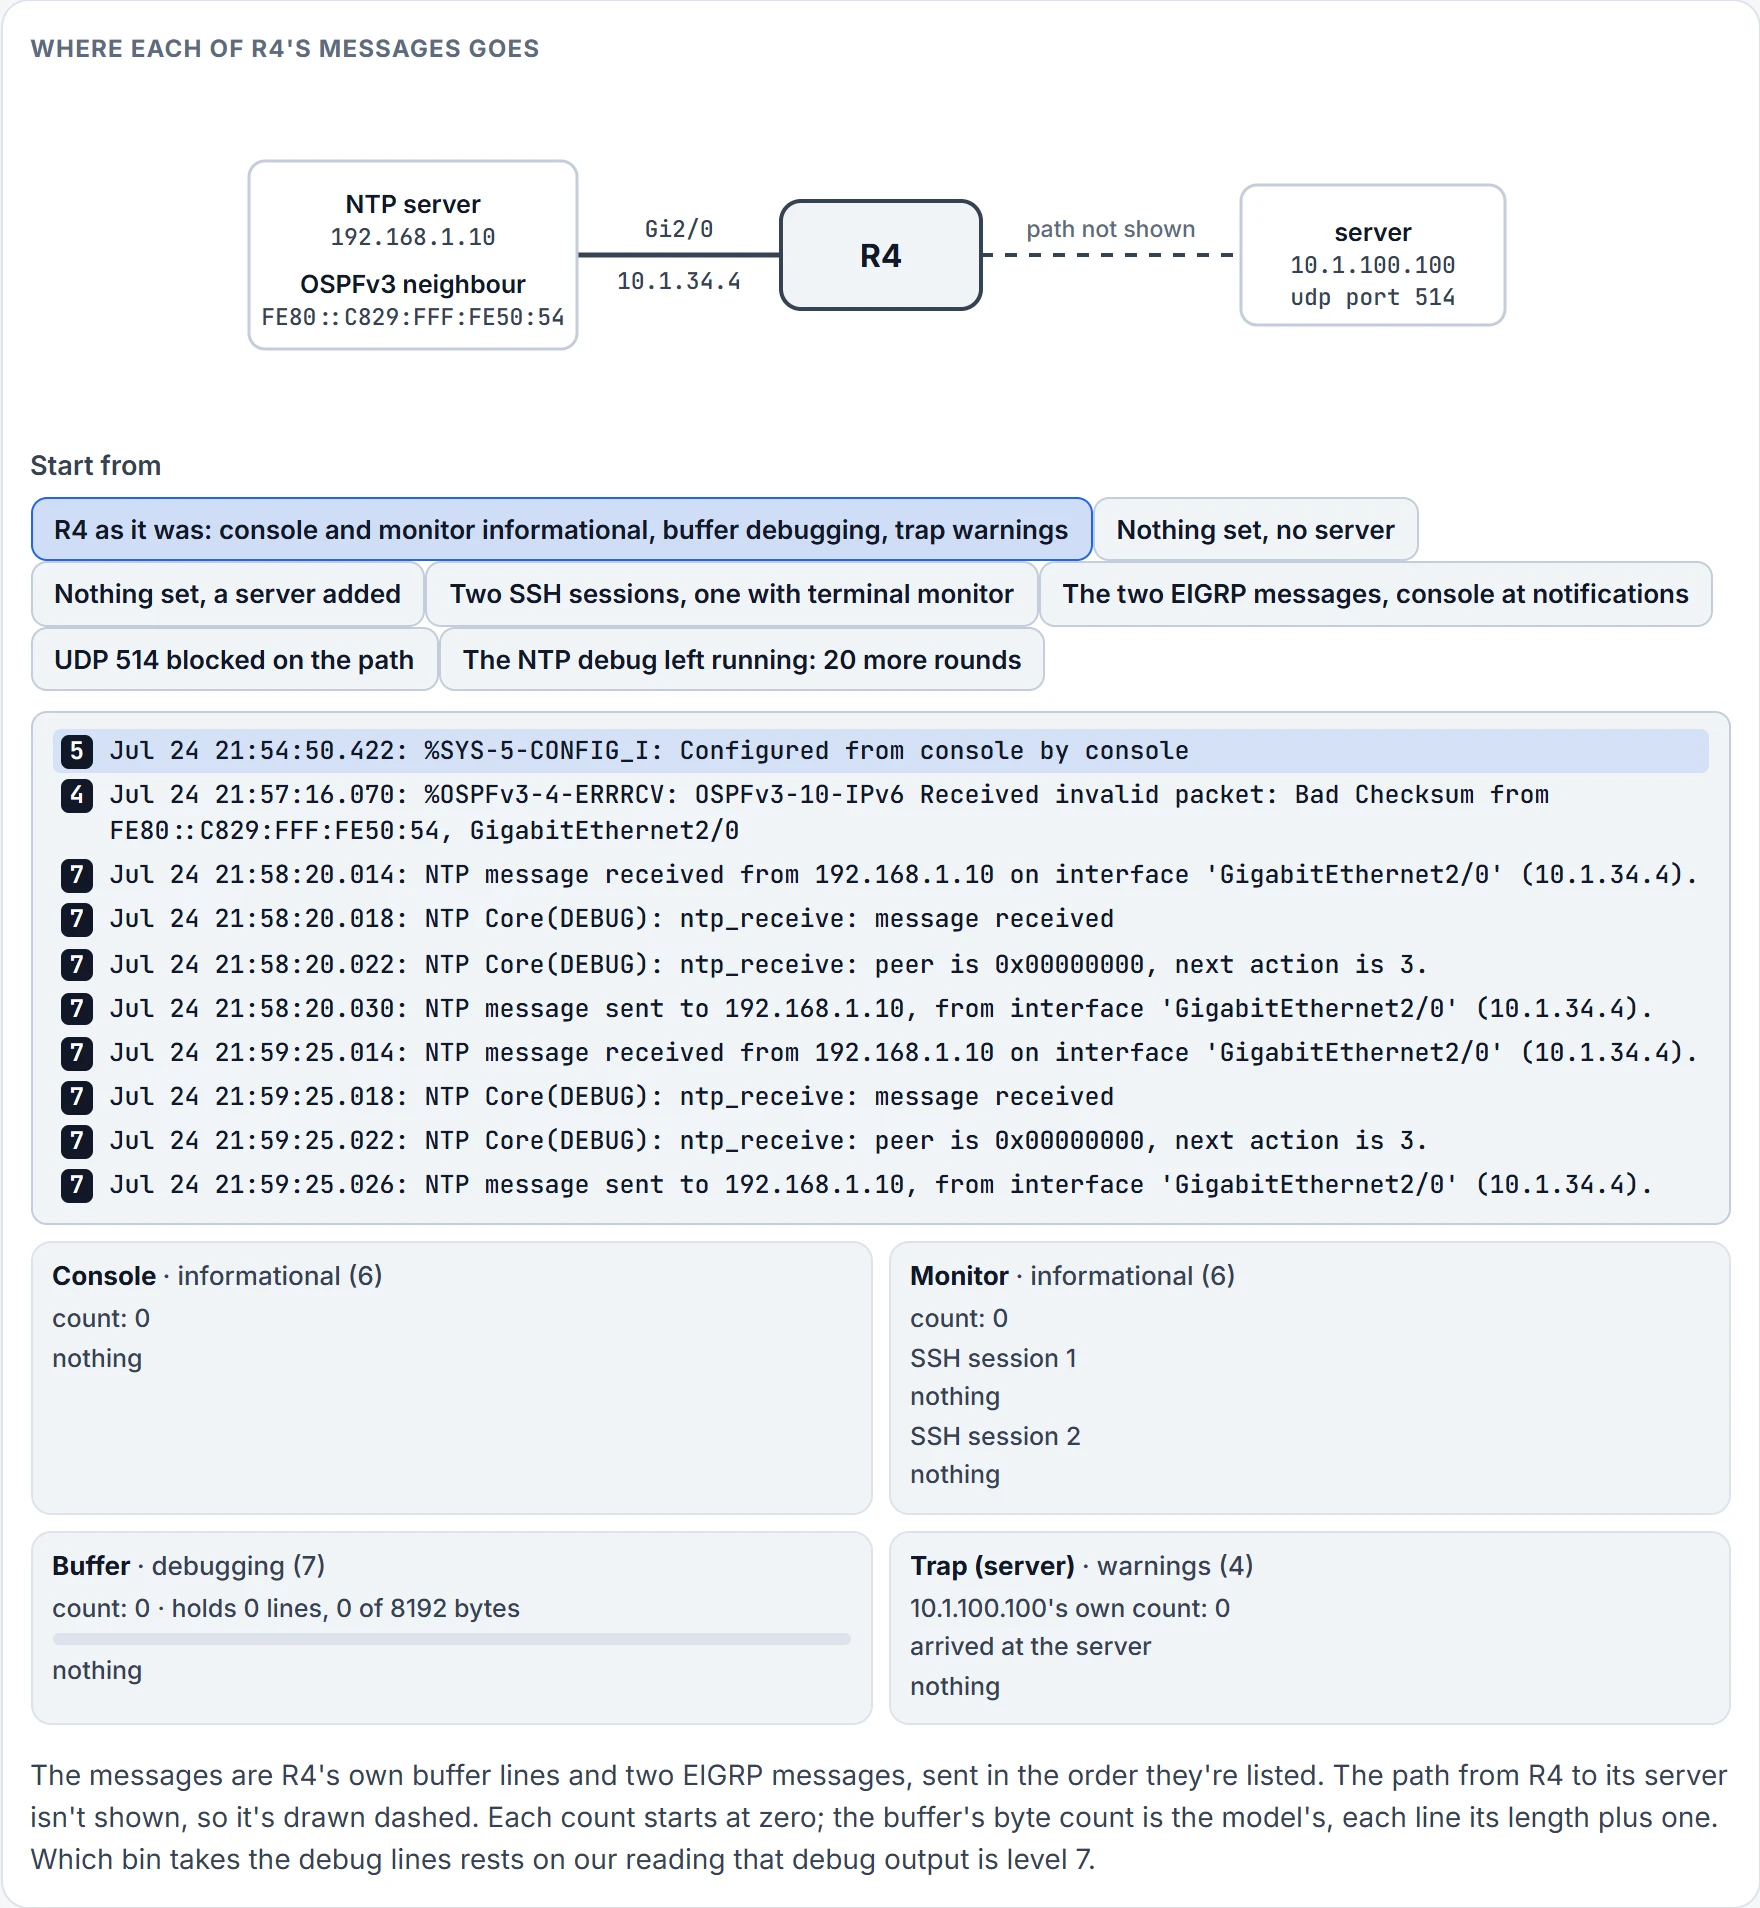
Step 1 of 11
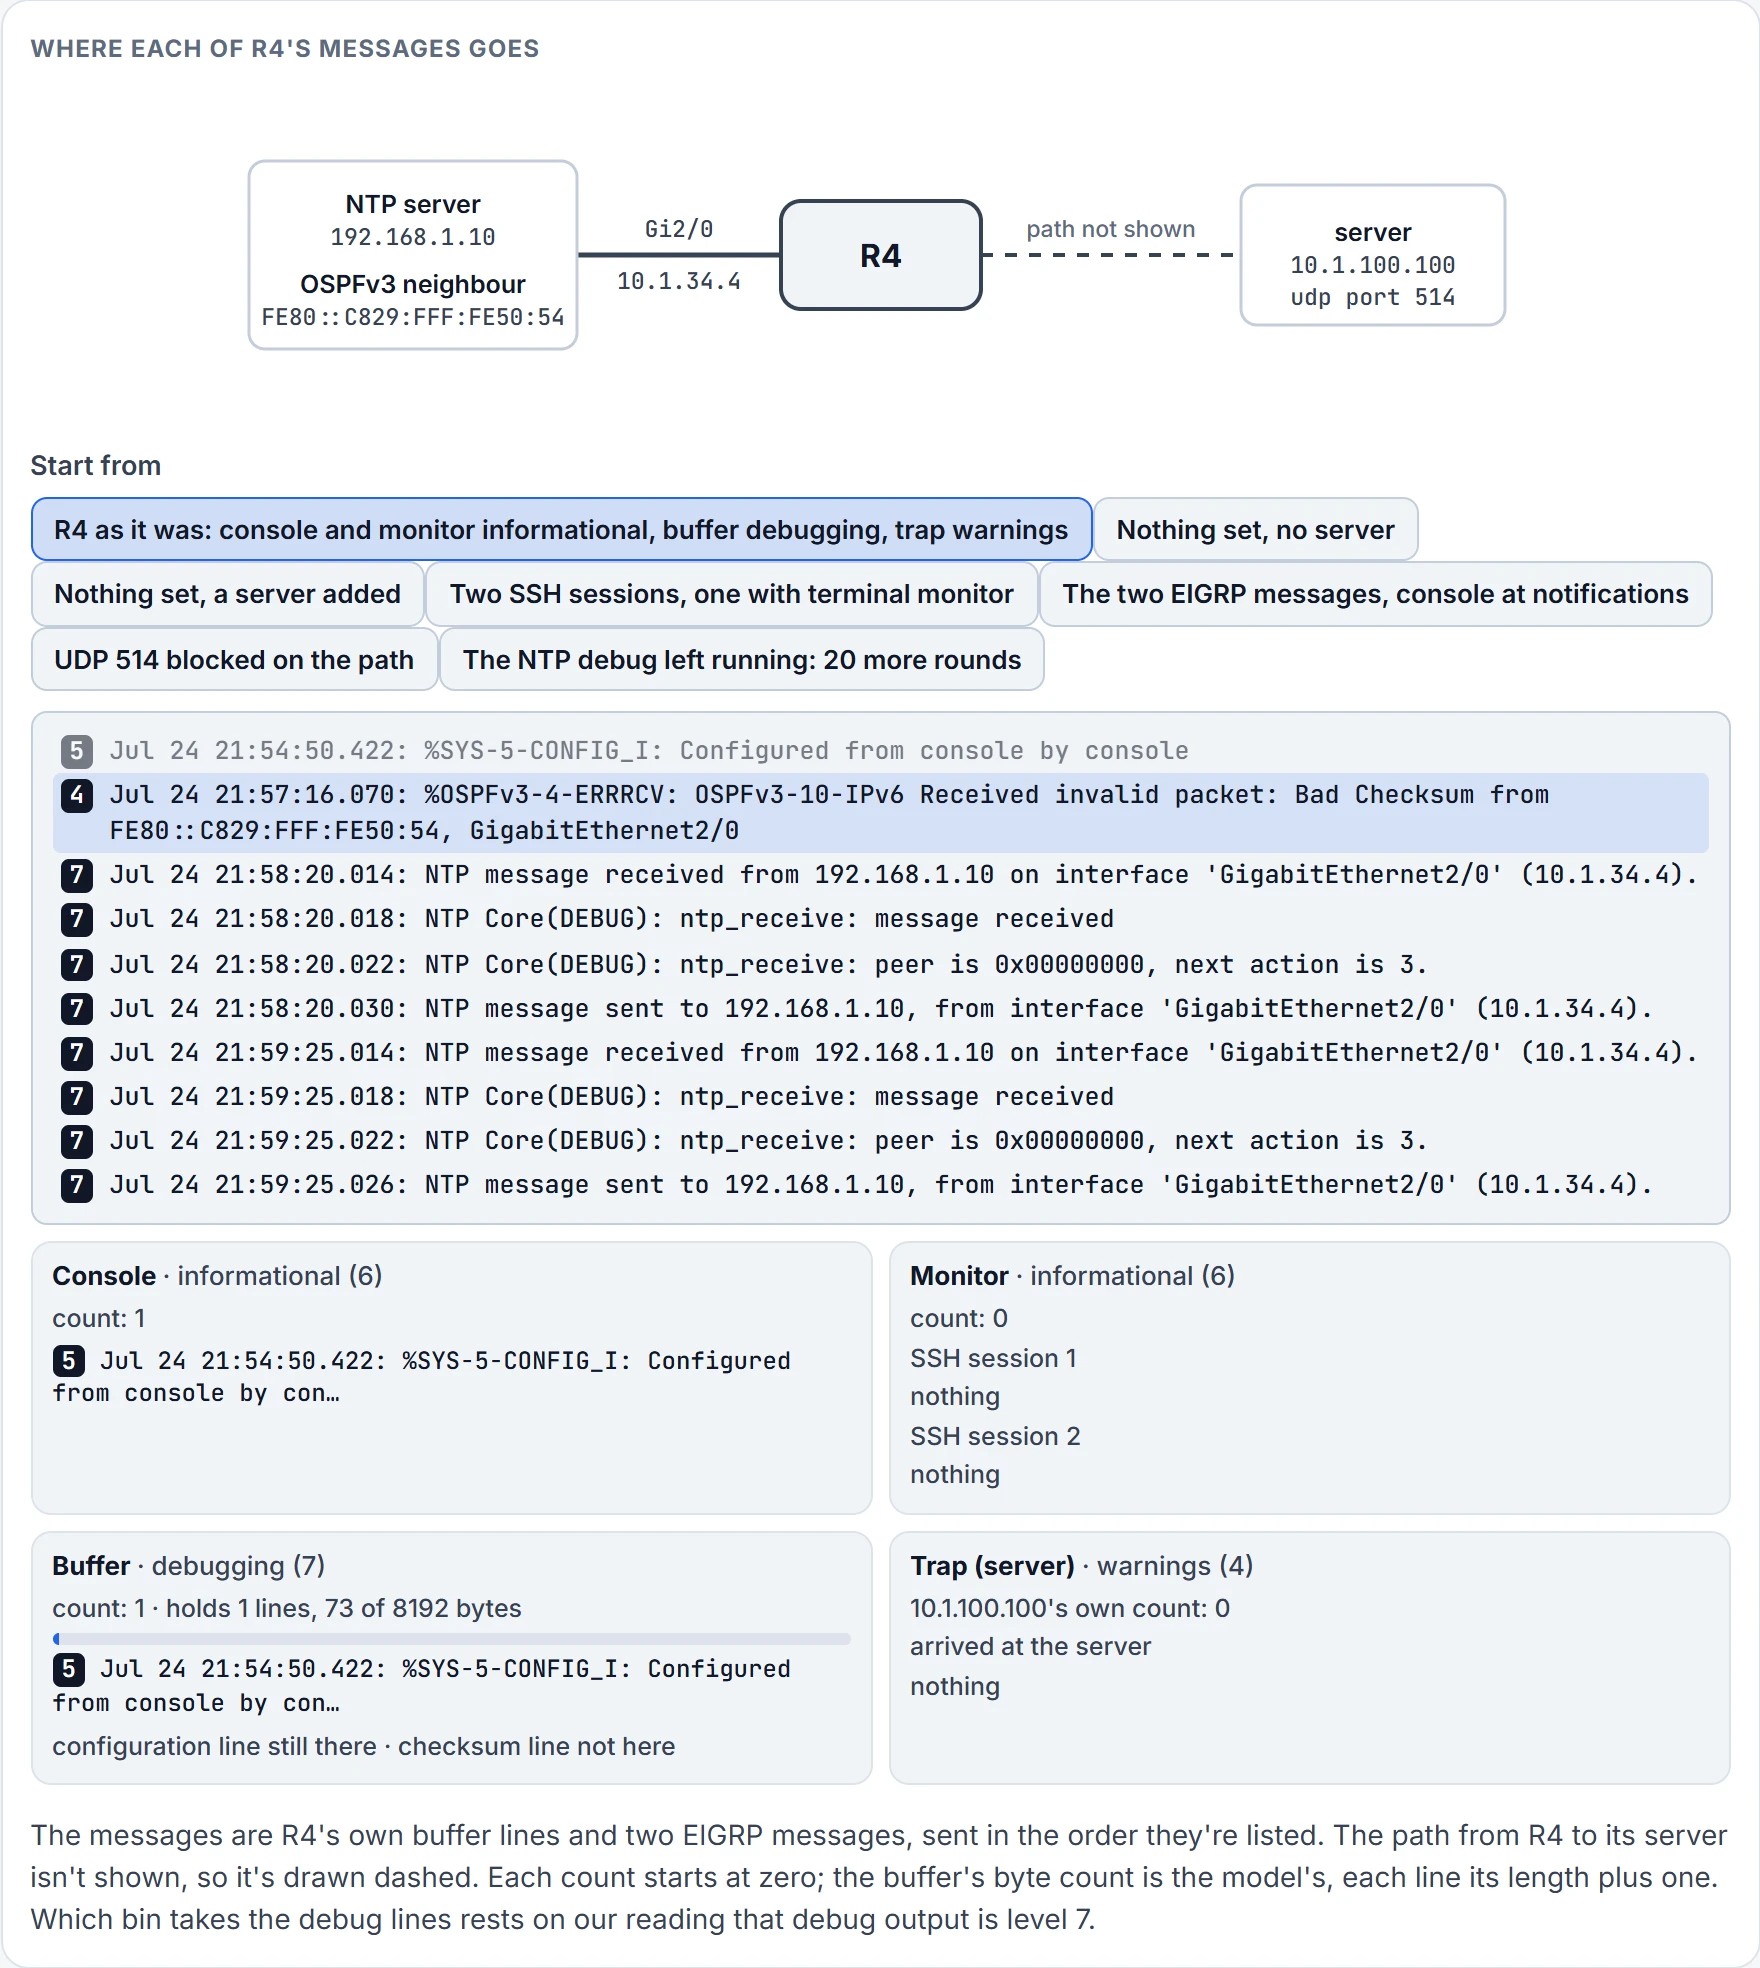
Step 2 of 11 Message 1 of 10: severity 5. Taken by: Console, Buffer.
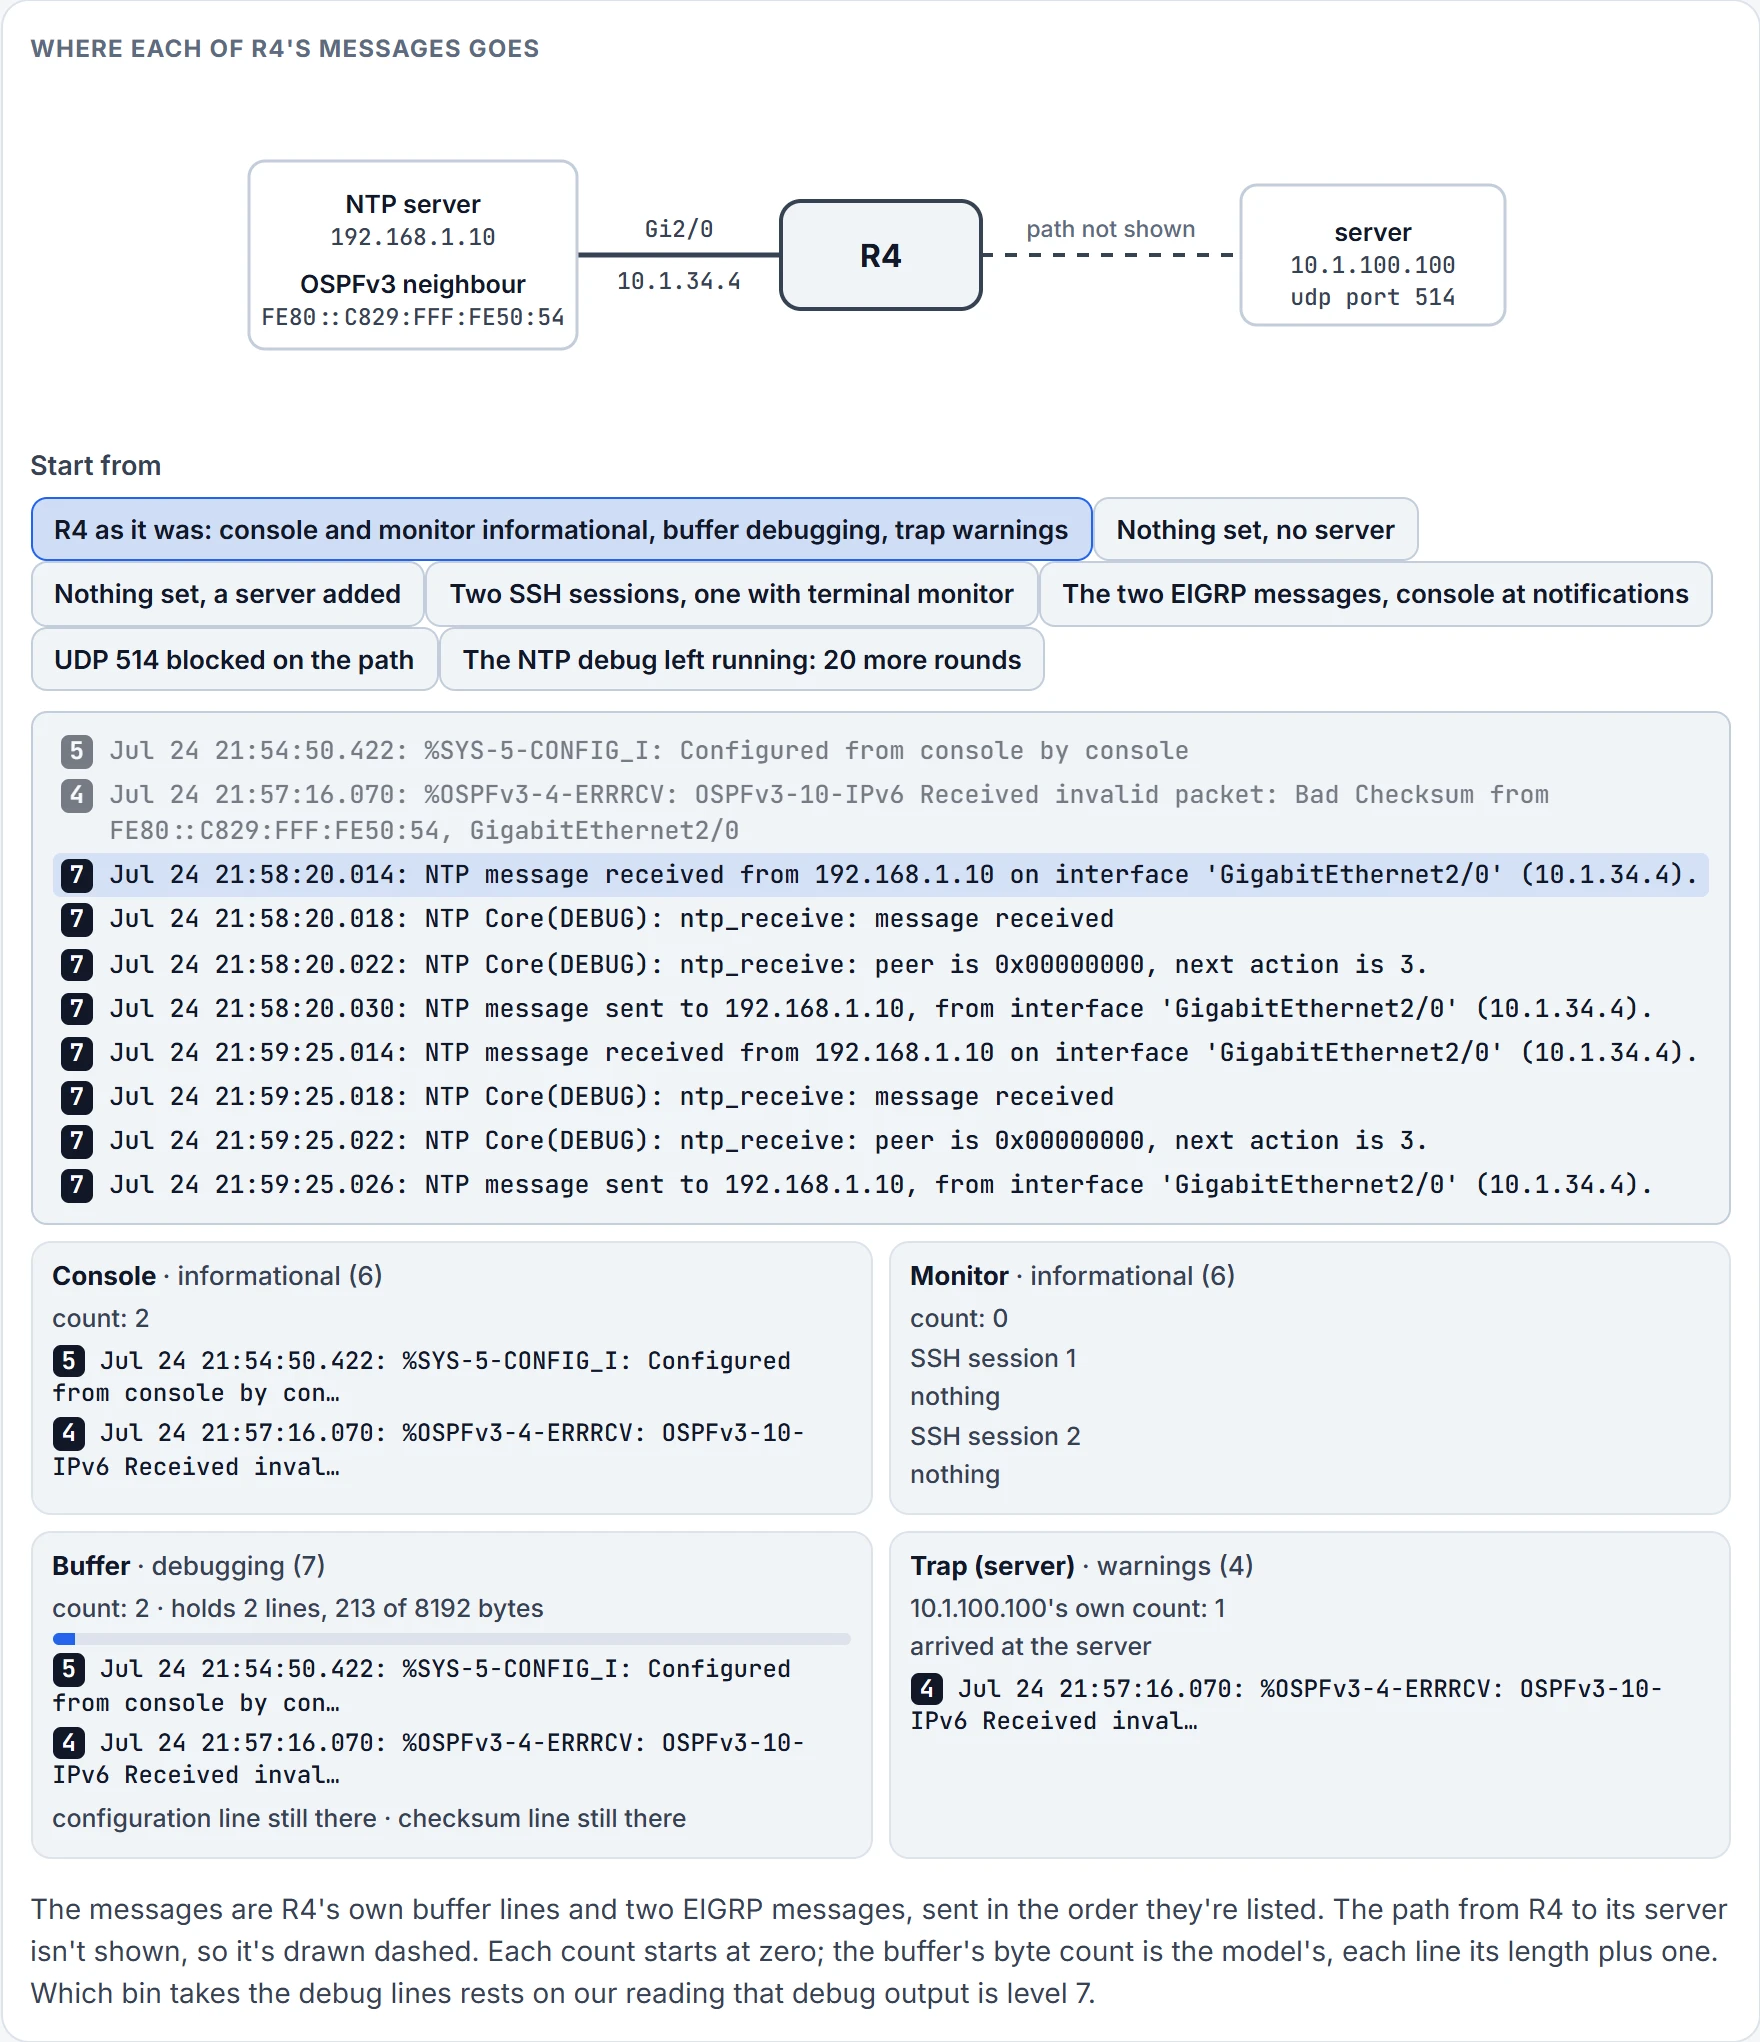
Step 3 of 11 Message 2 of 10: severity 4. Taken by: Console, Buffer, Trap.
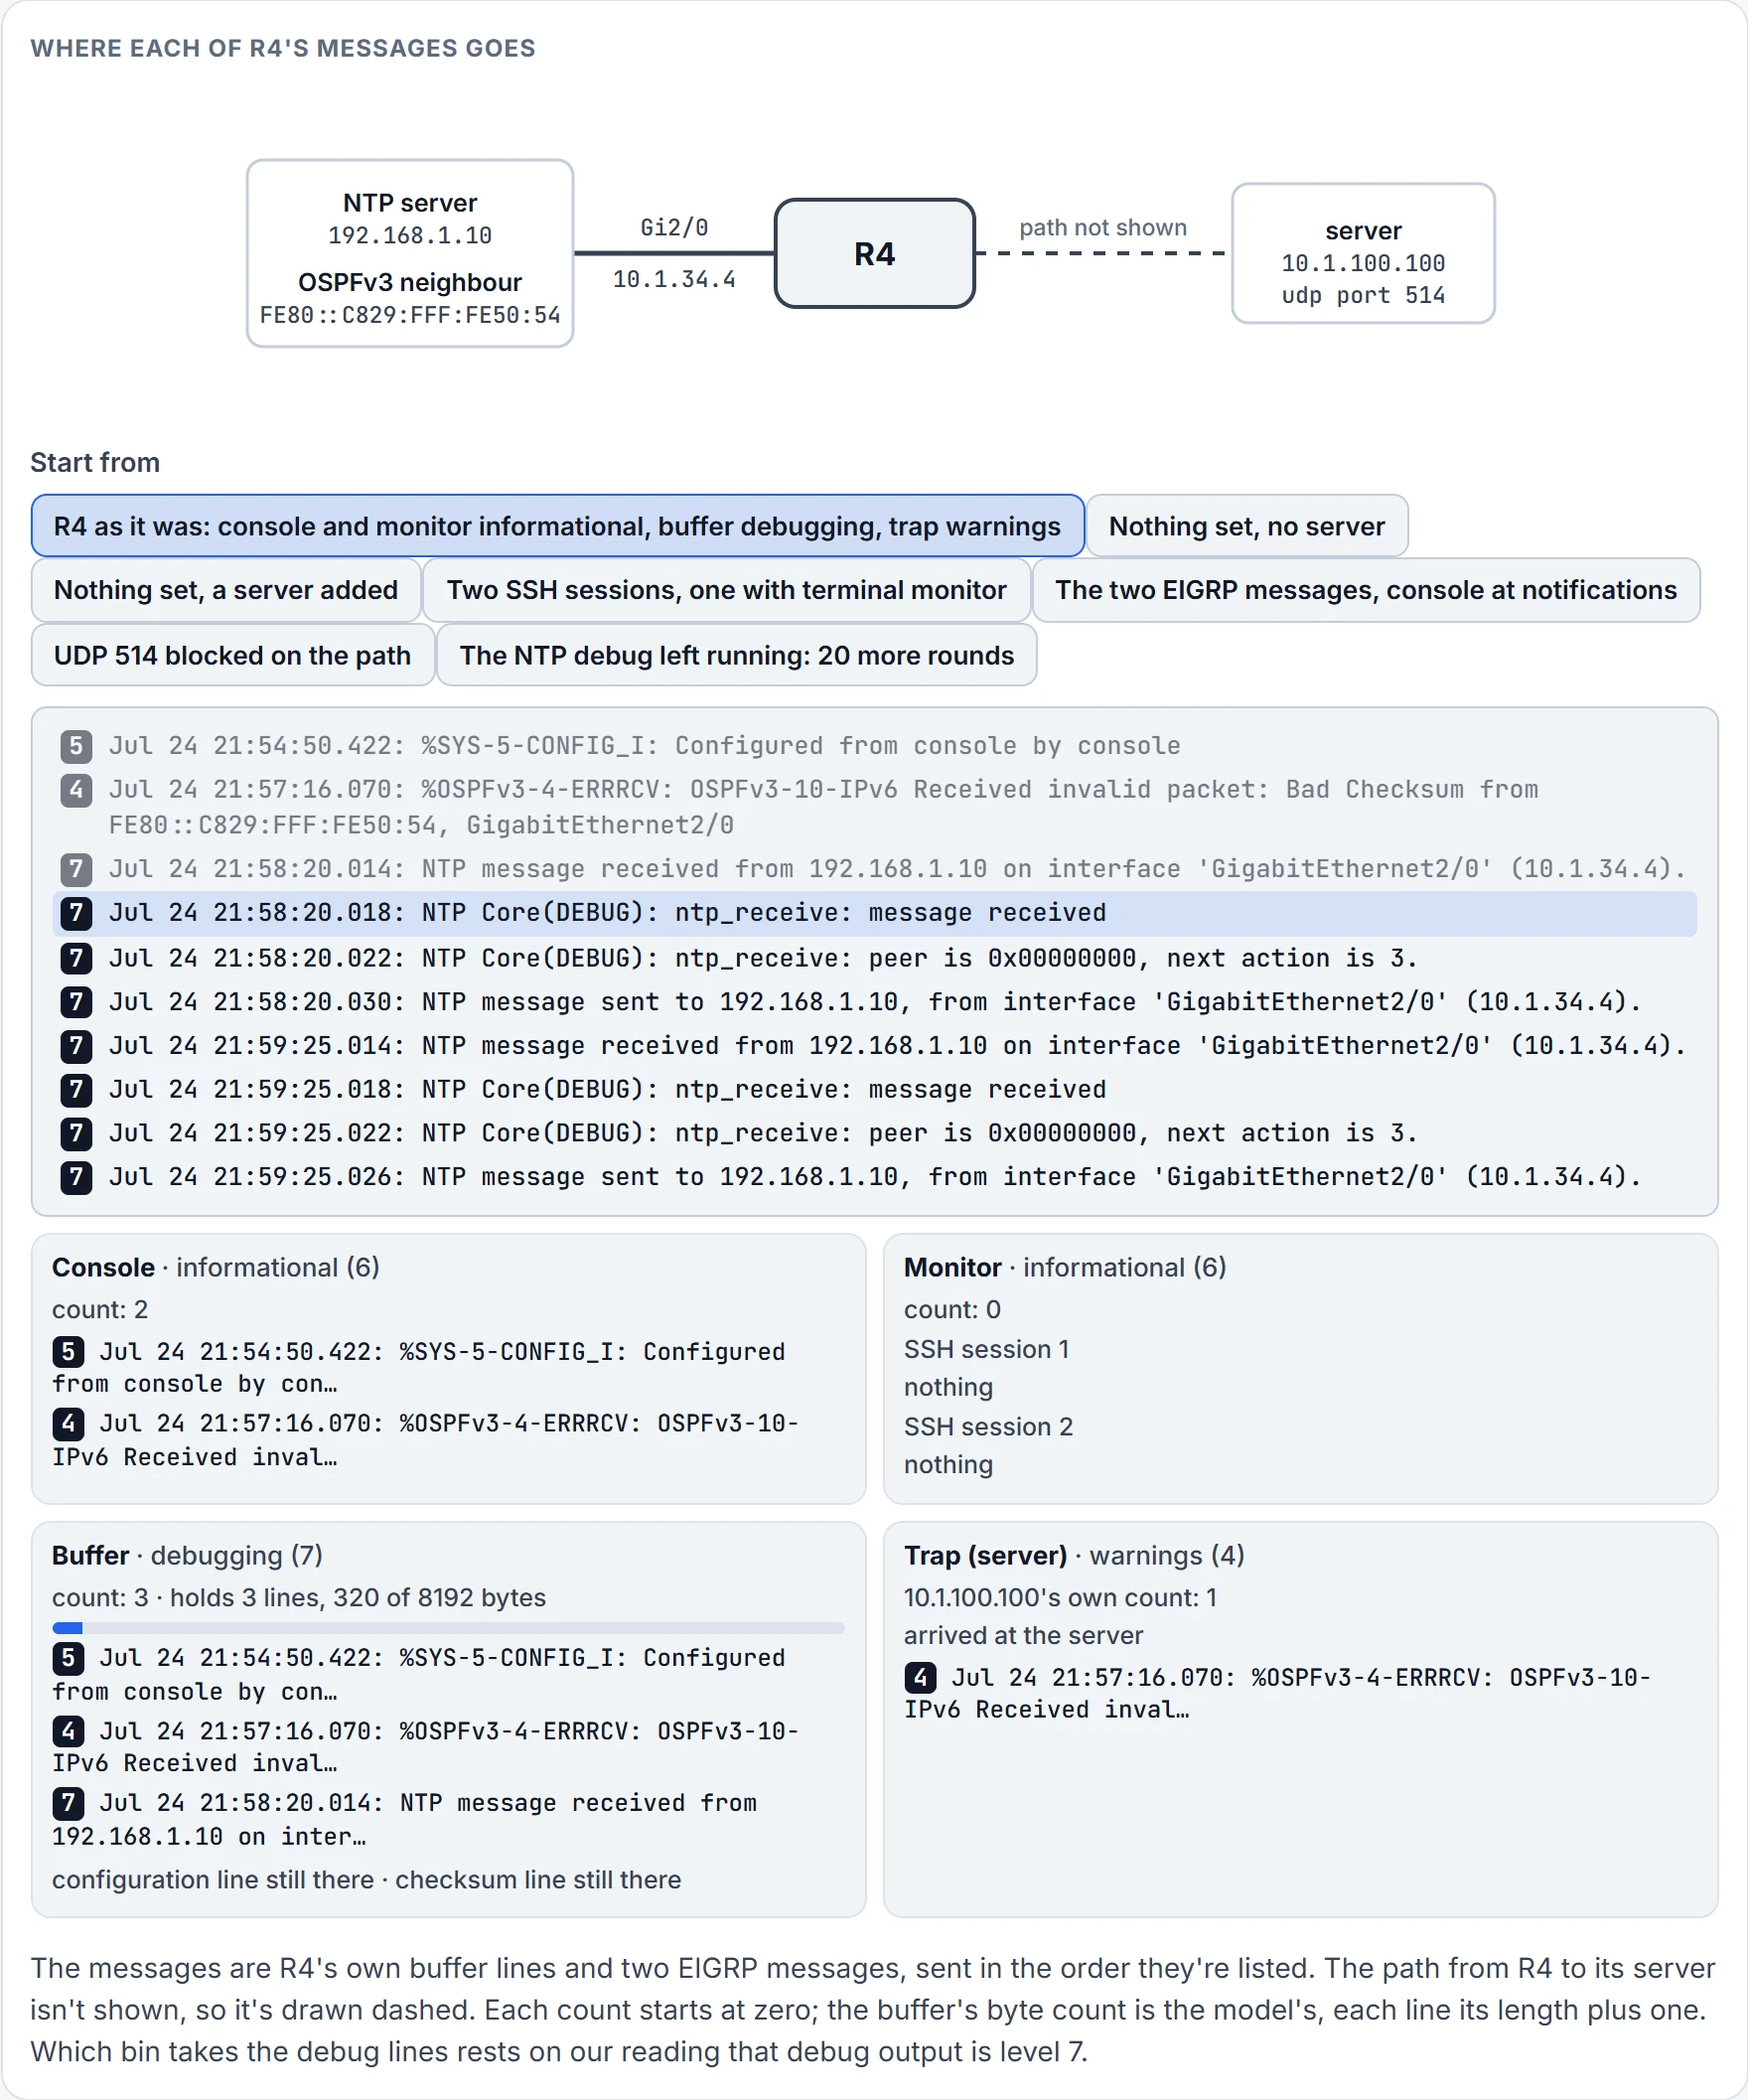
Step 4 of 11 Message 3 of 10: debug output, level 7 on our reading. Taken by: Buffer.
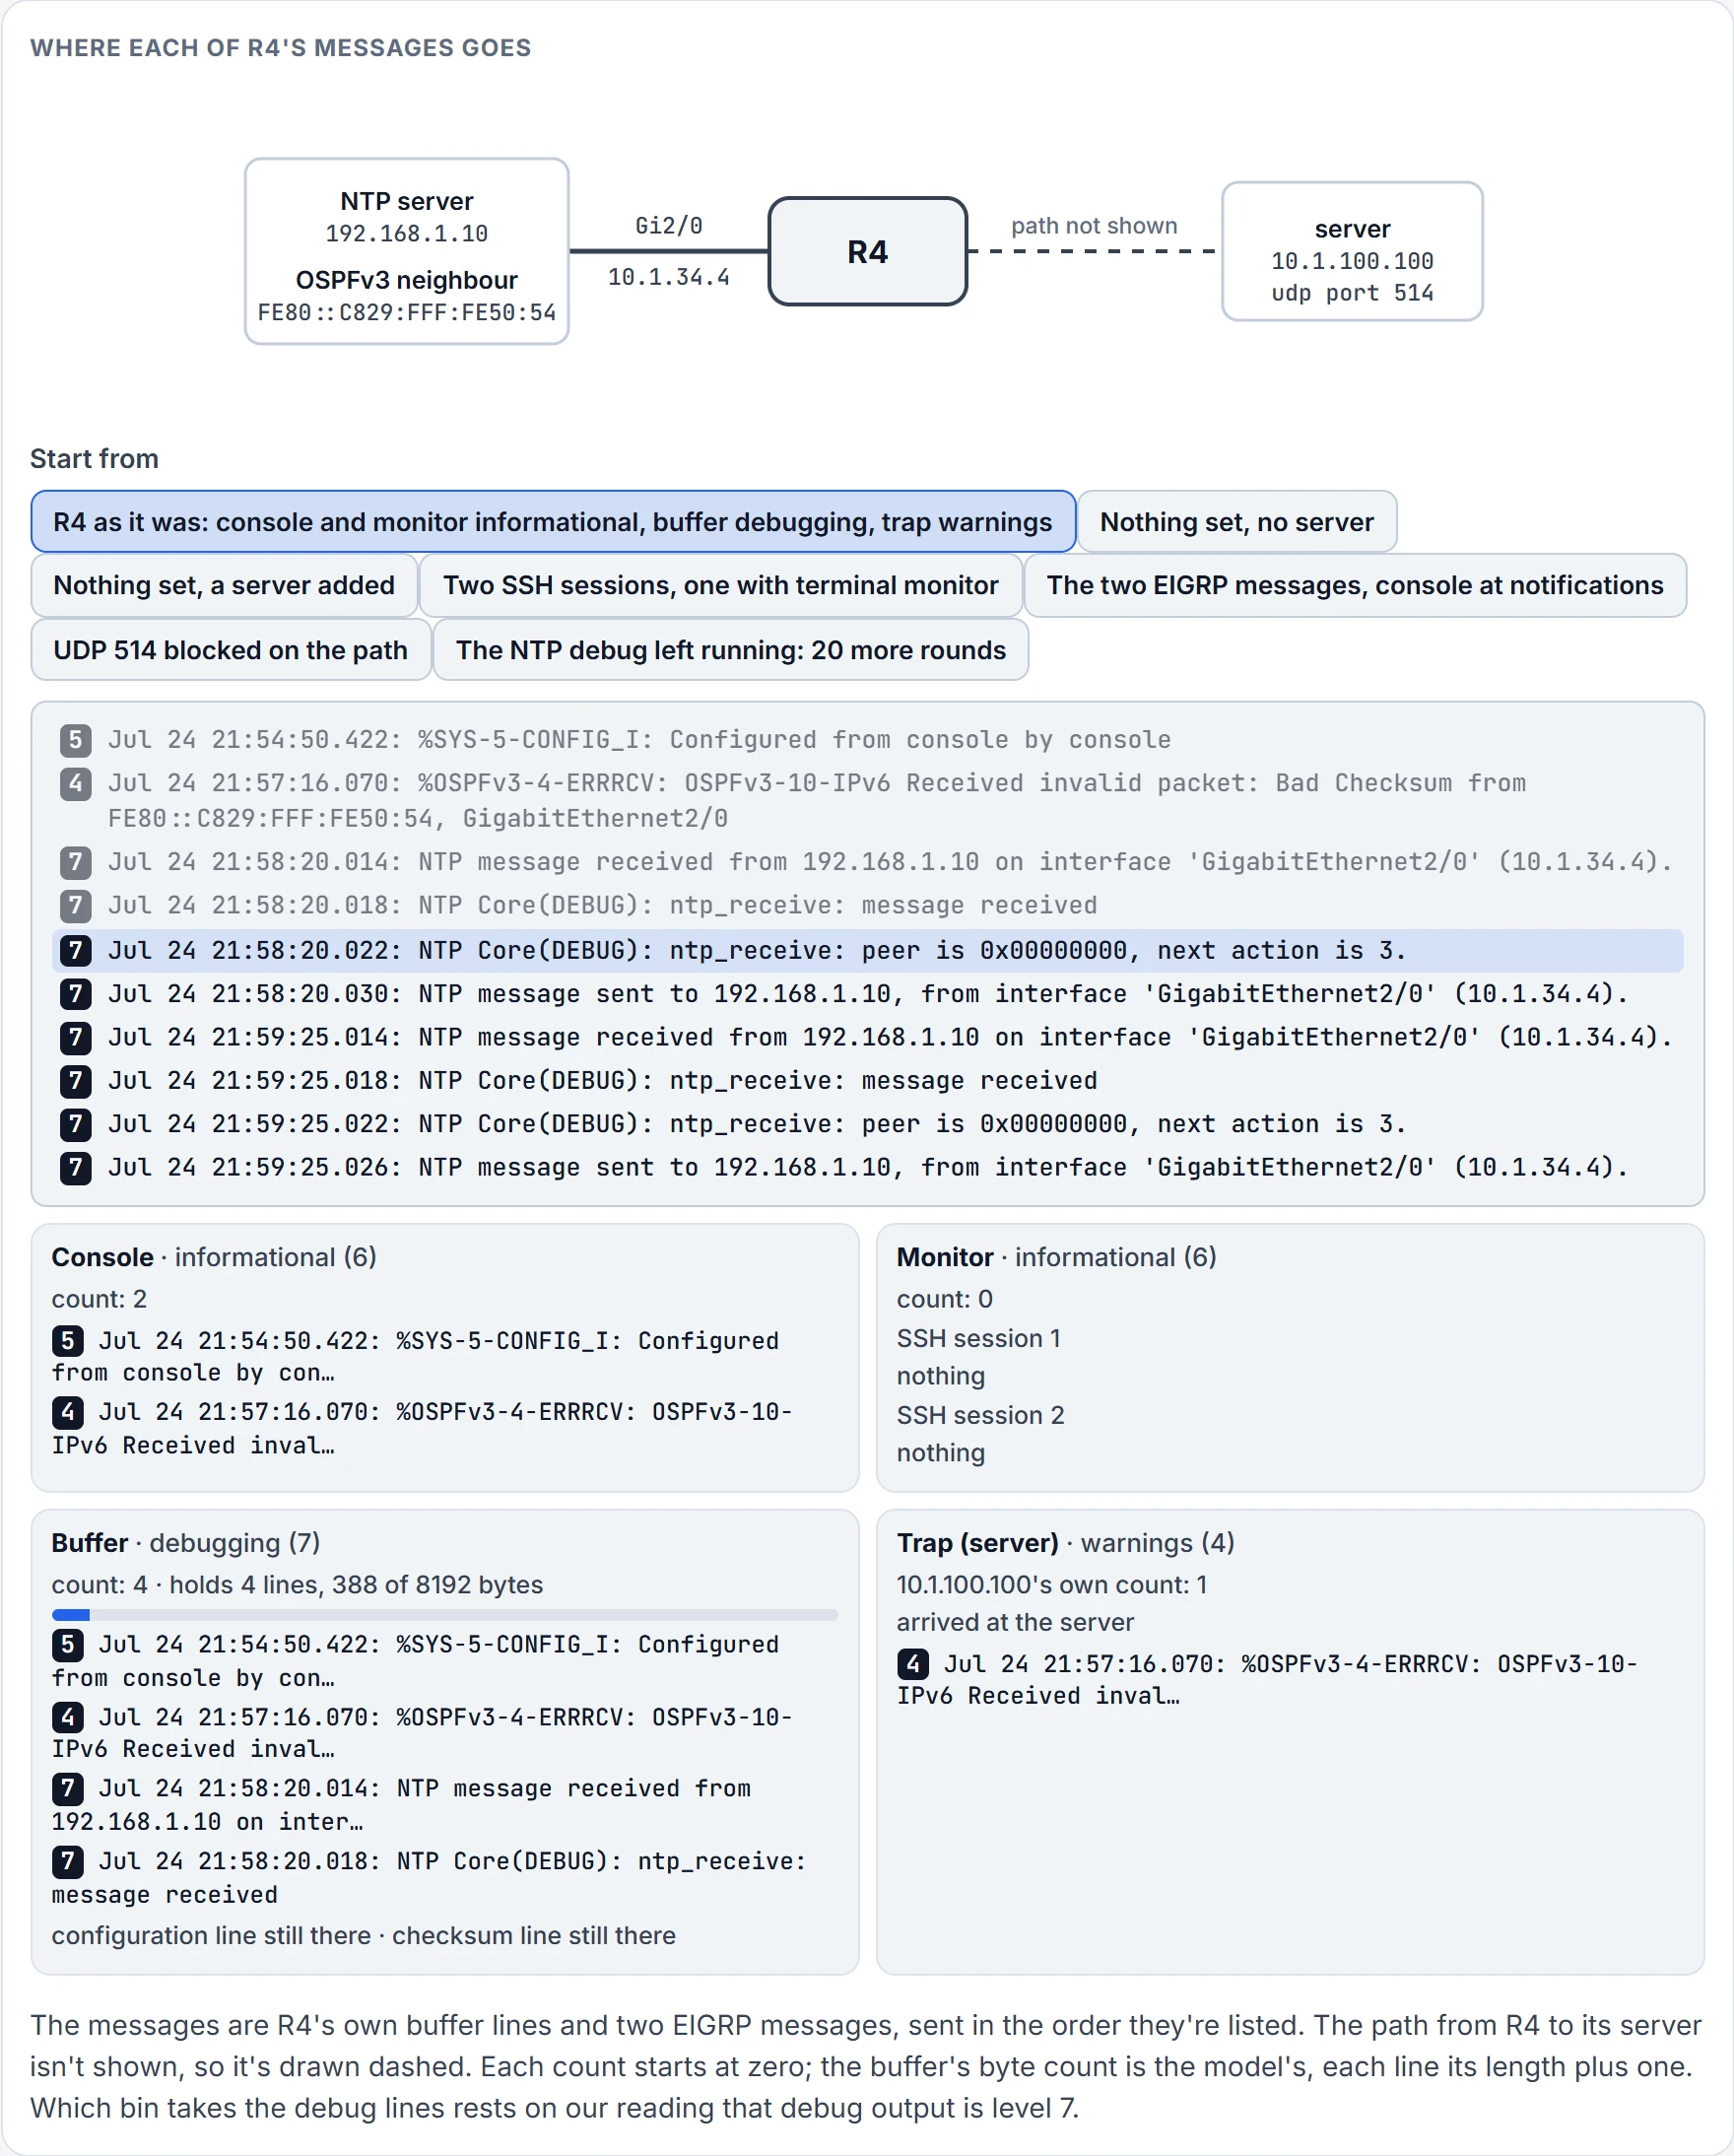
Step 5 of 11 Message 4 of 10: debug output, level 7 on our reading. Taken by: Buffer.
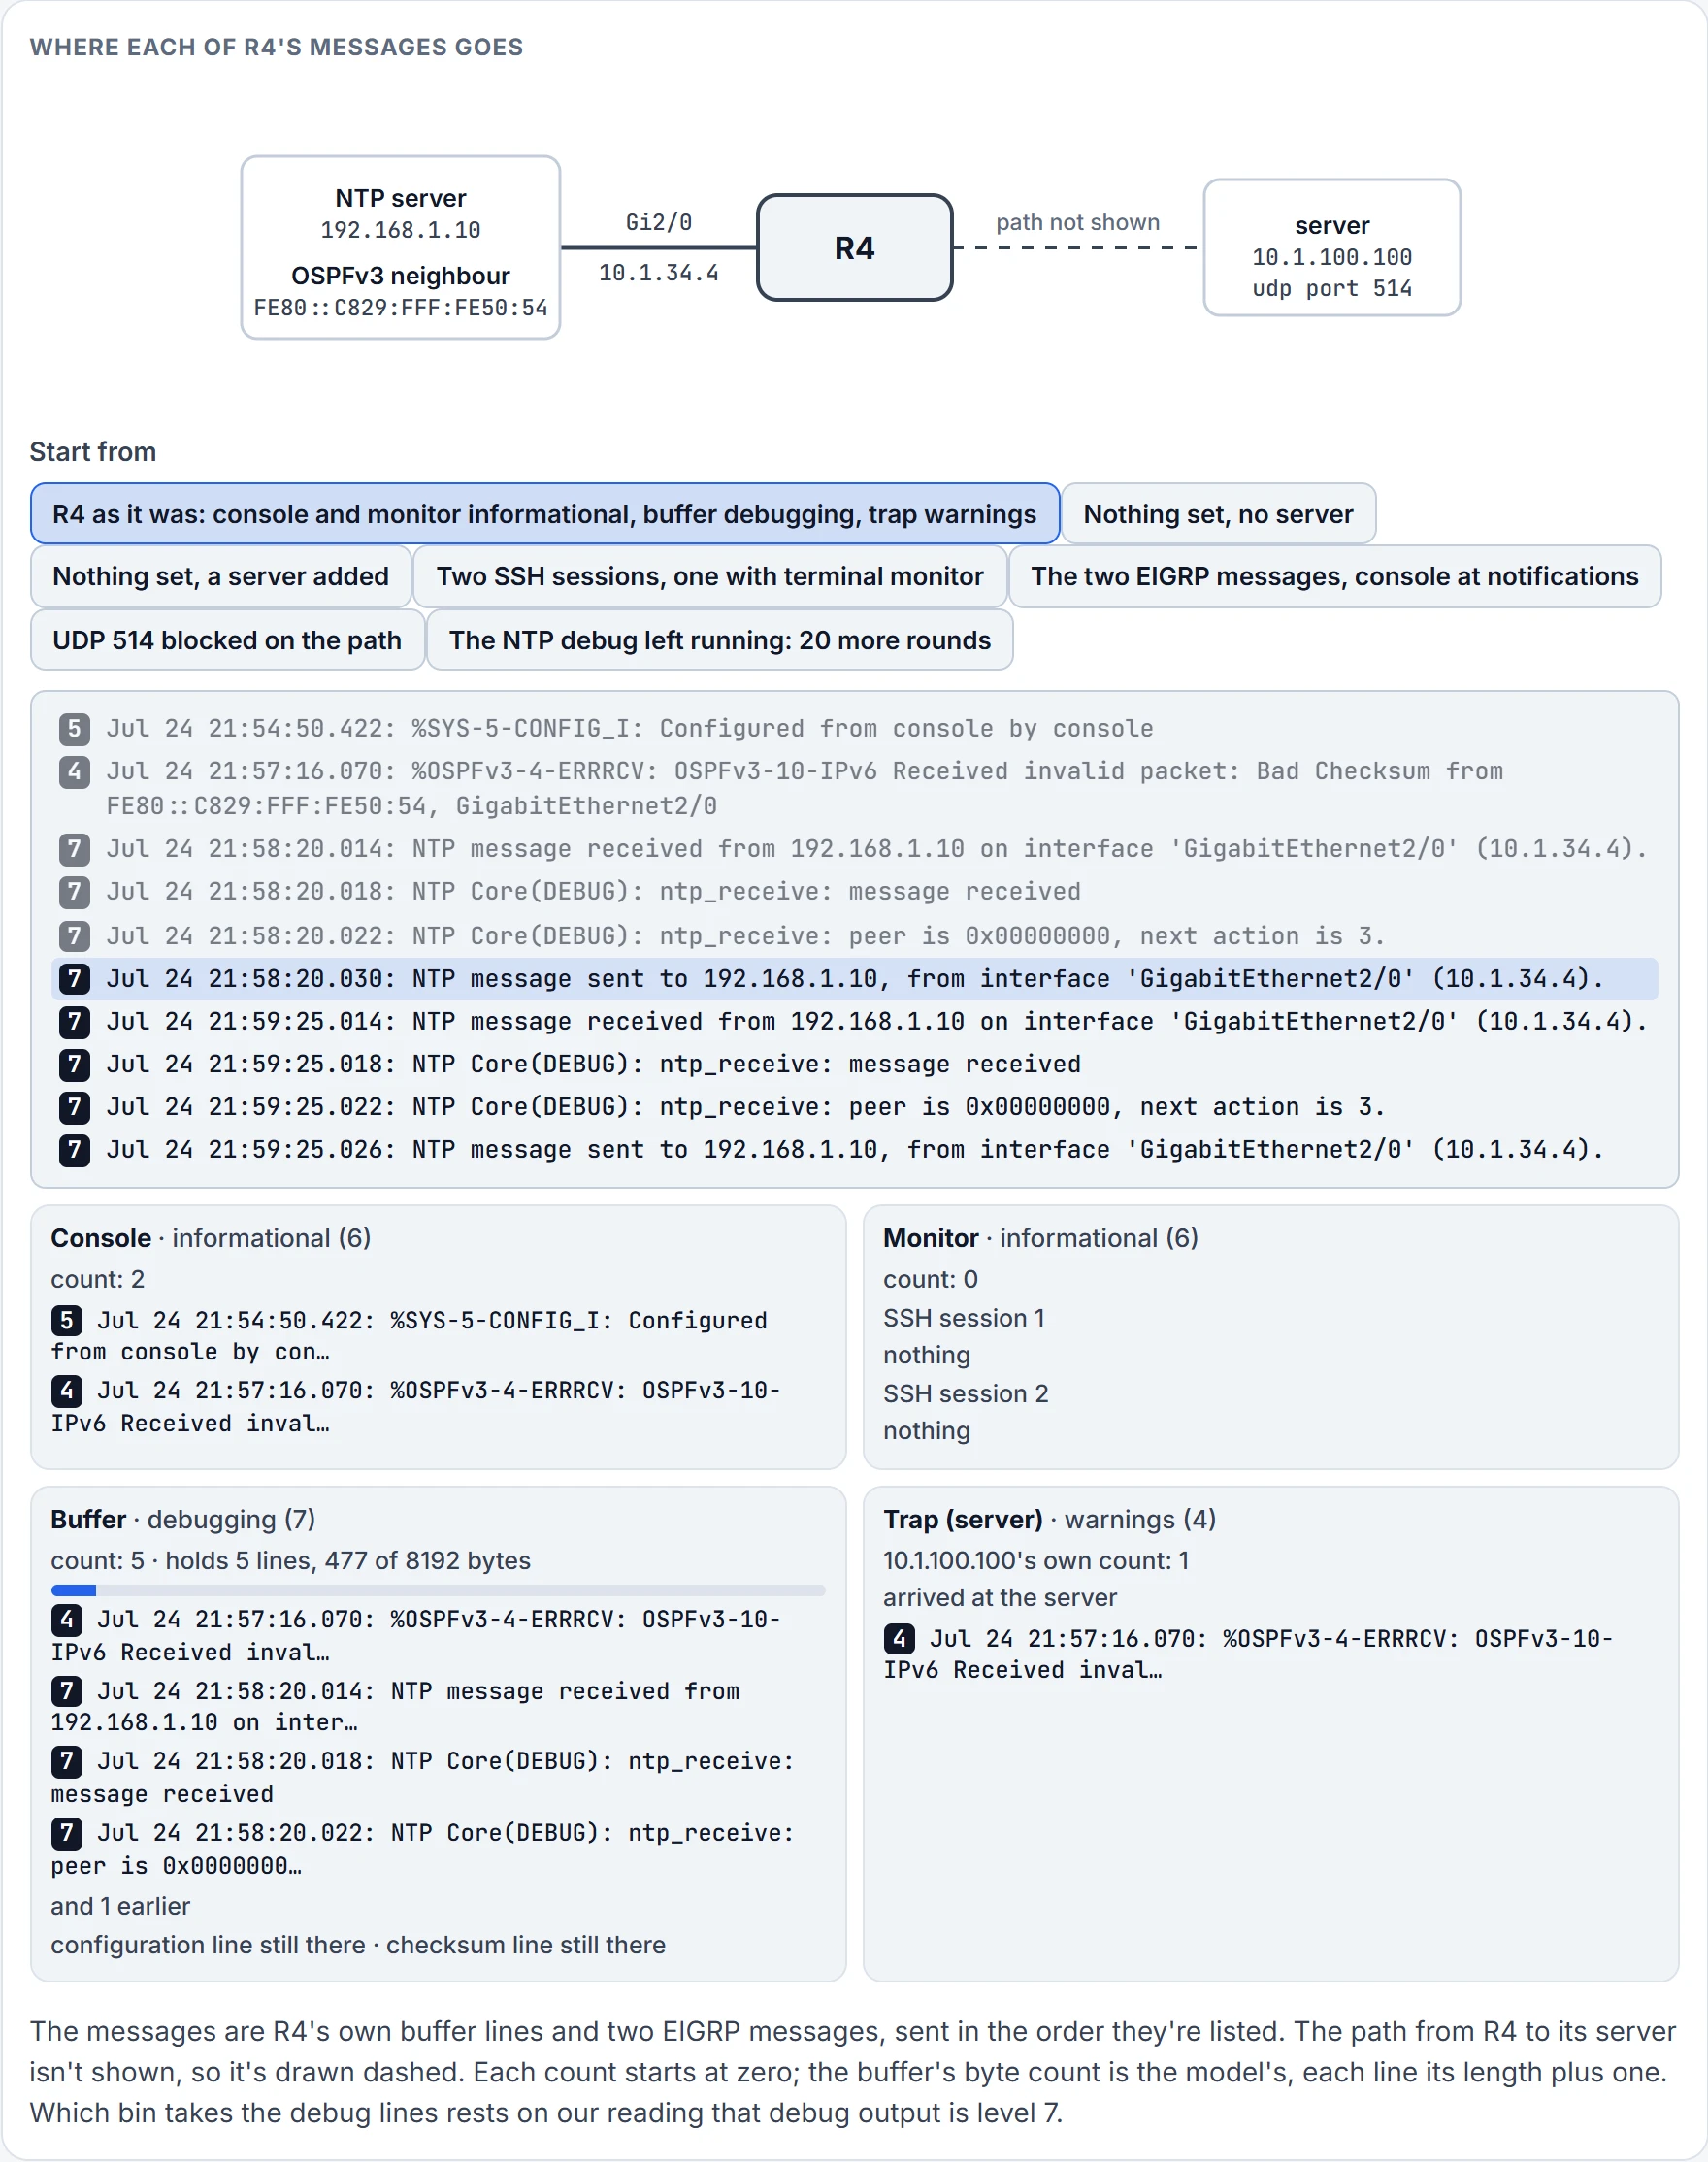
Step 6 of 11 Message 5 of 10: debug output, level 7 on our reading. Taken by: Buffer.
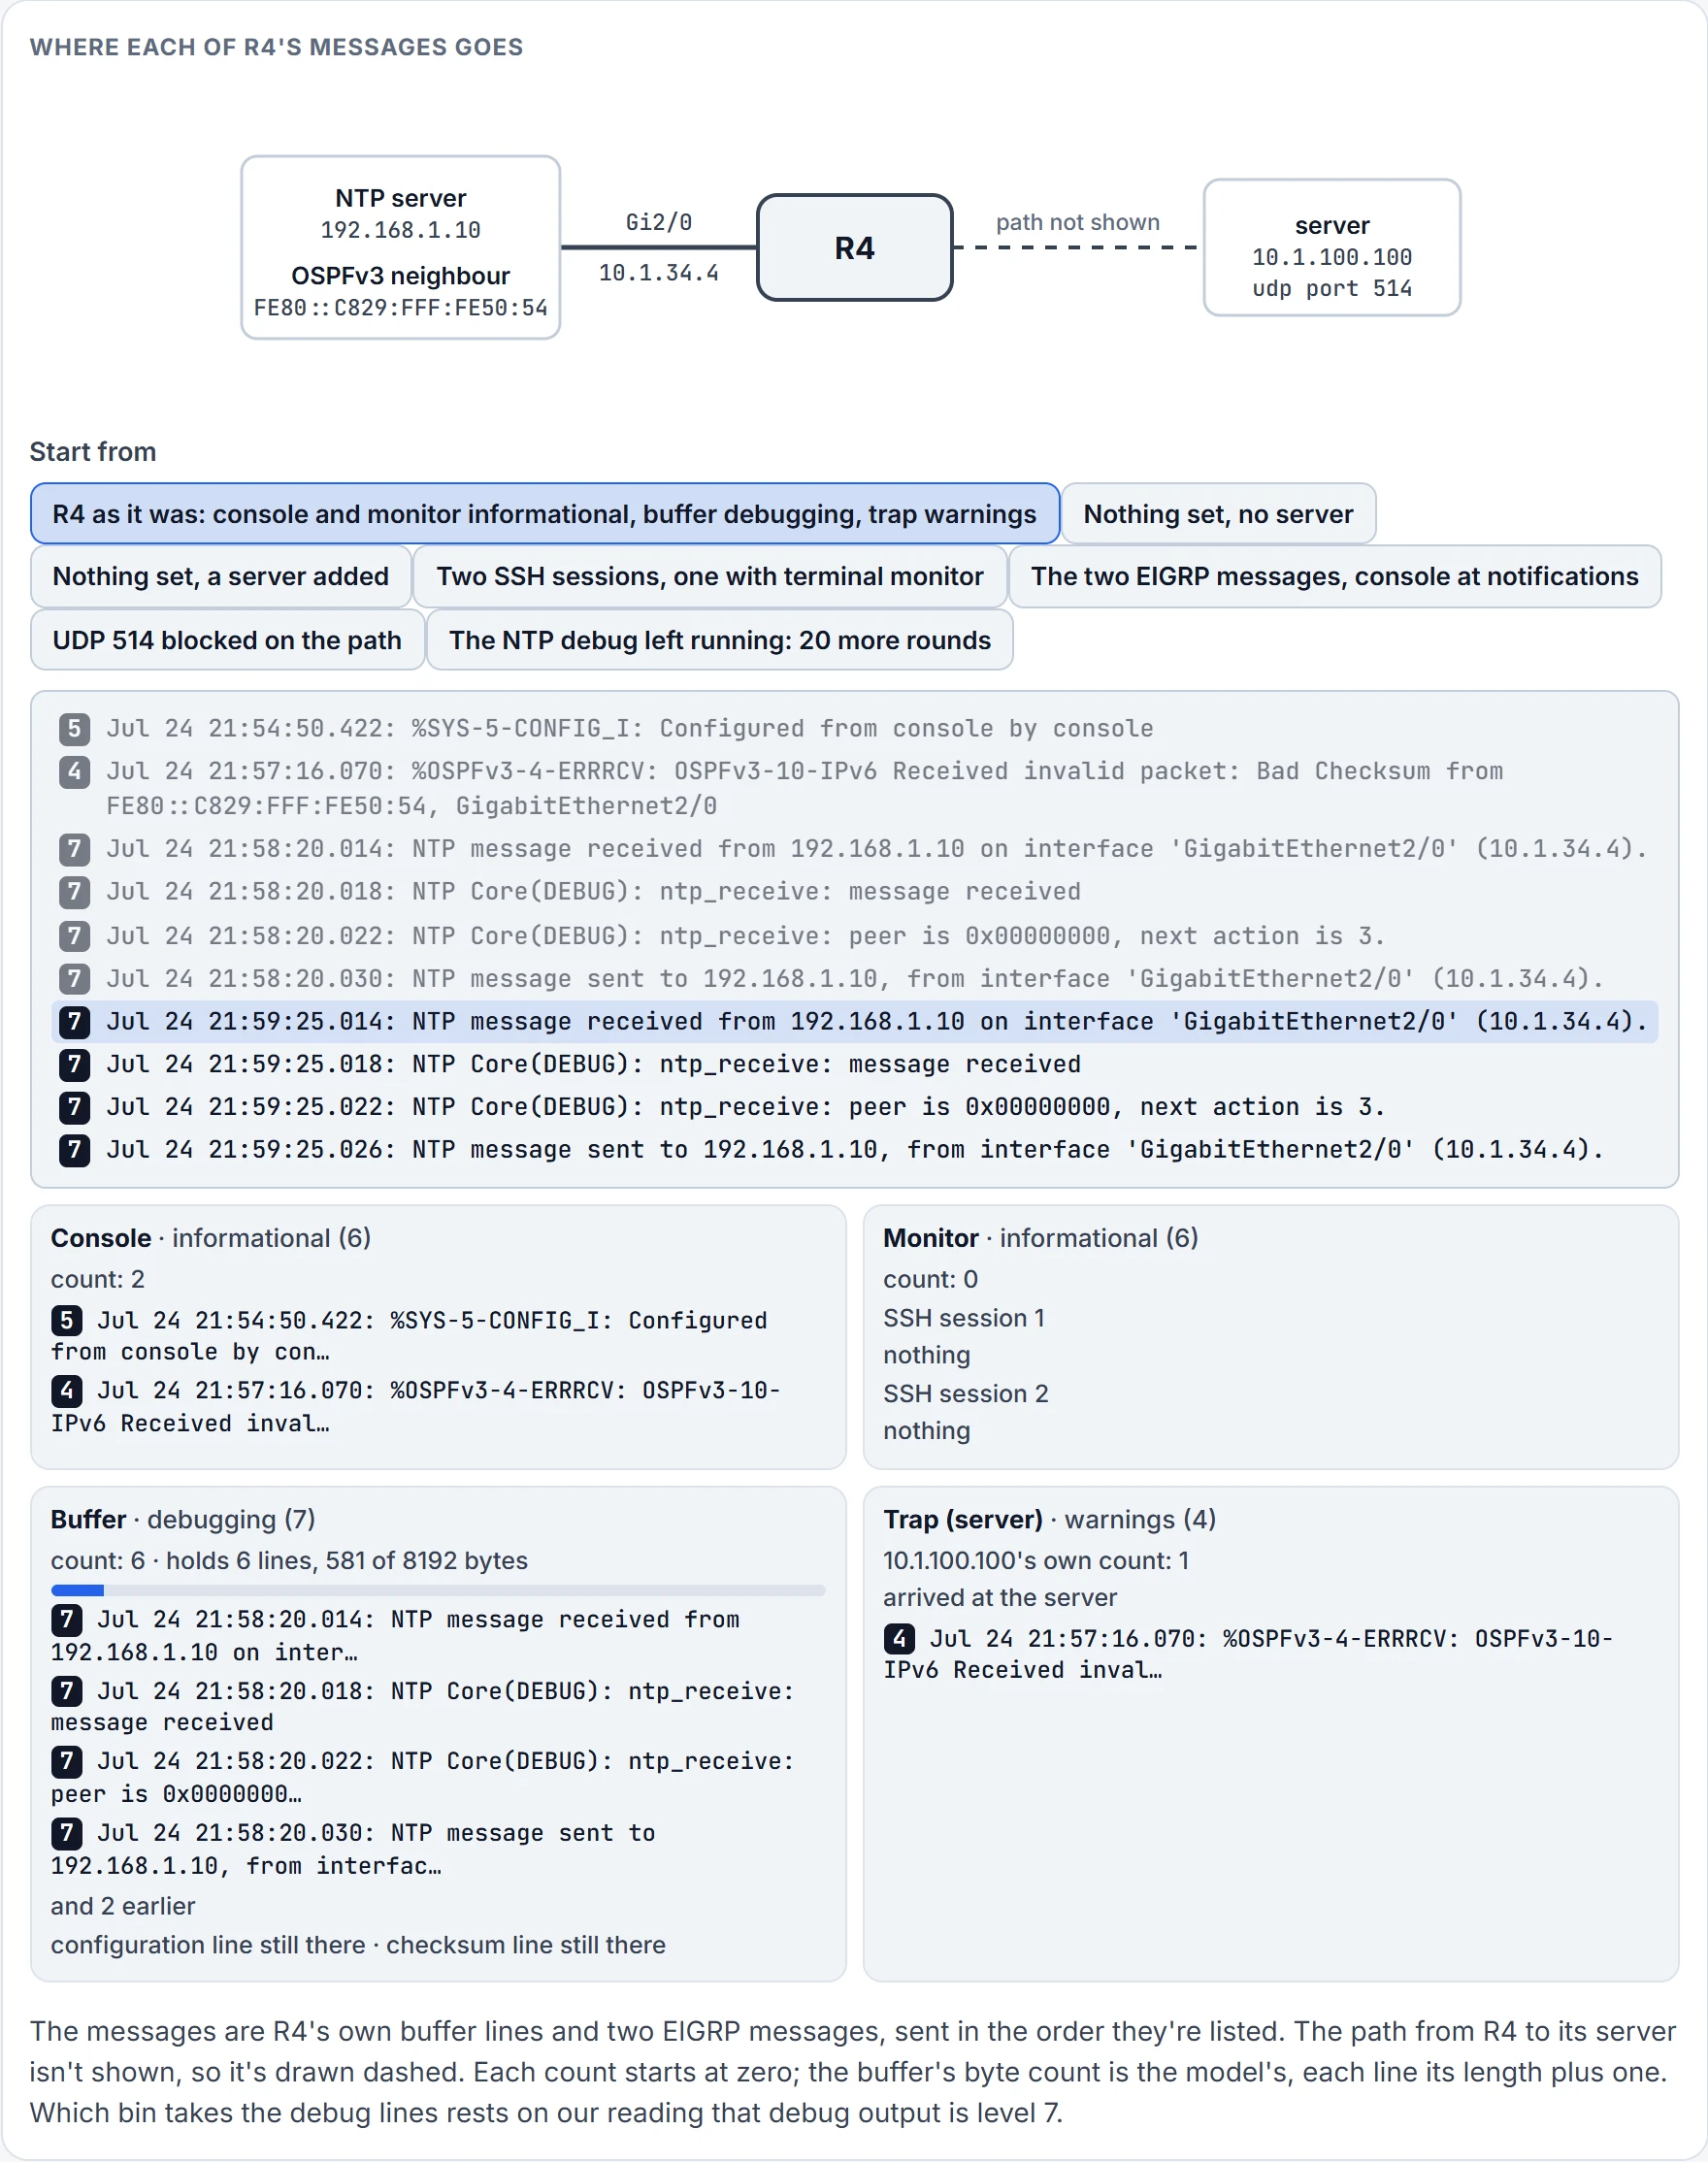
Step 7 of 11 Message 6 of 10: debug output, level 7 on our reading. Taken by: Buffer.
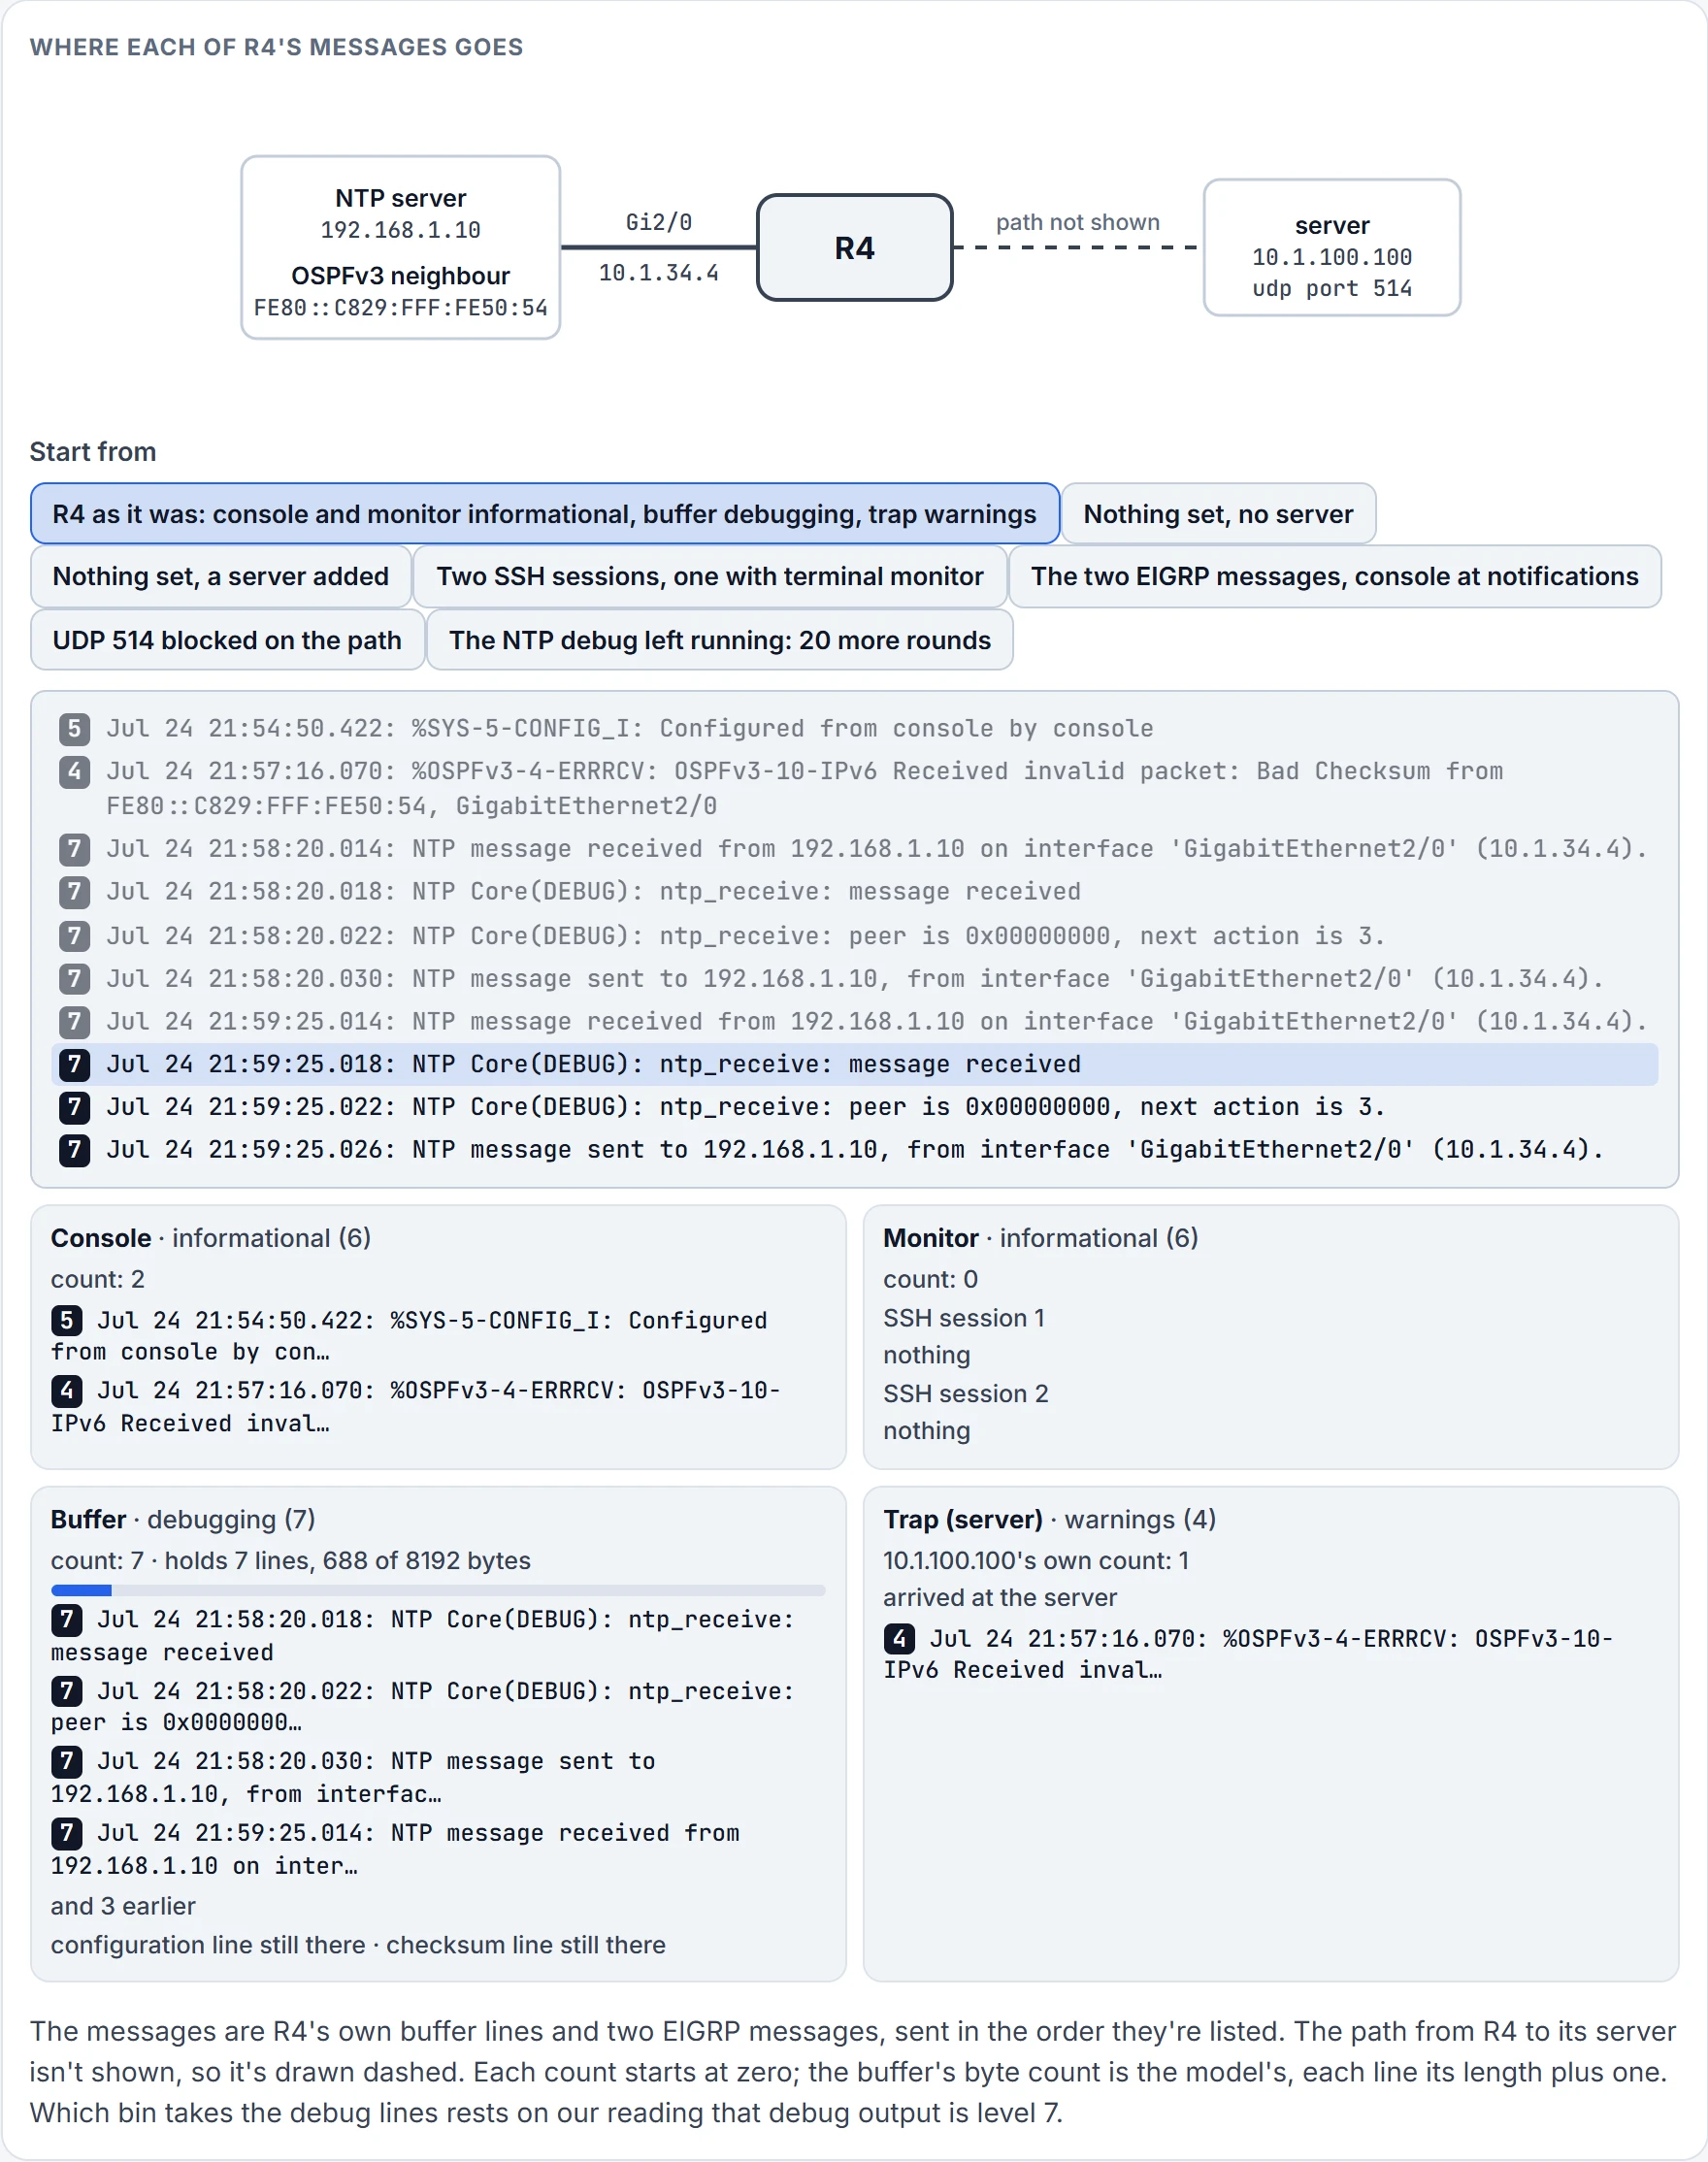
Step 8 of 11 Message 7 of 10: debug output, level 7 on our reading. Taken by: Buffer.
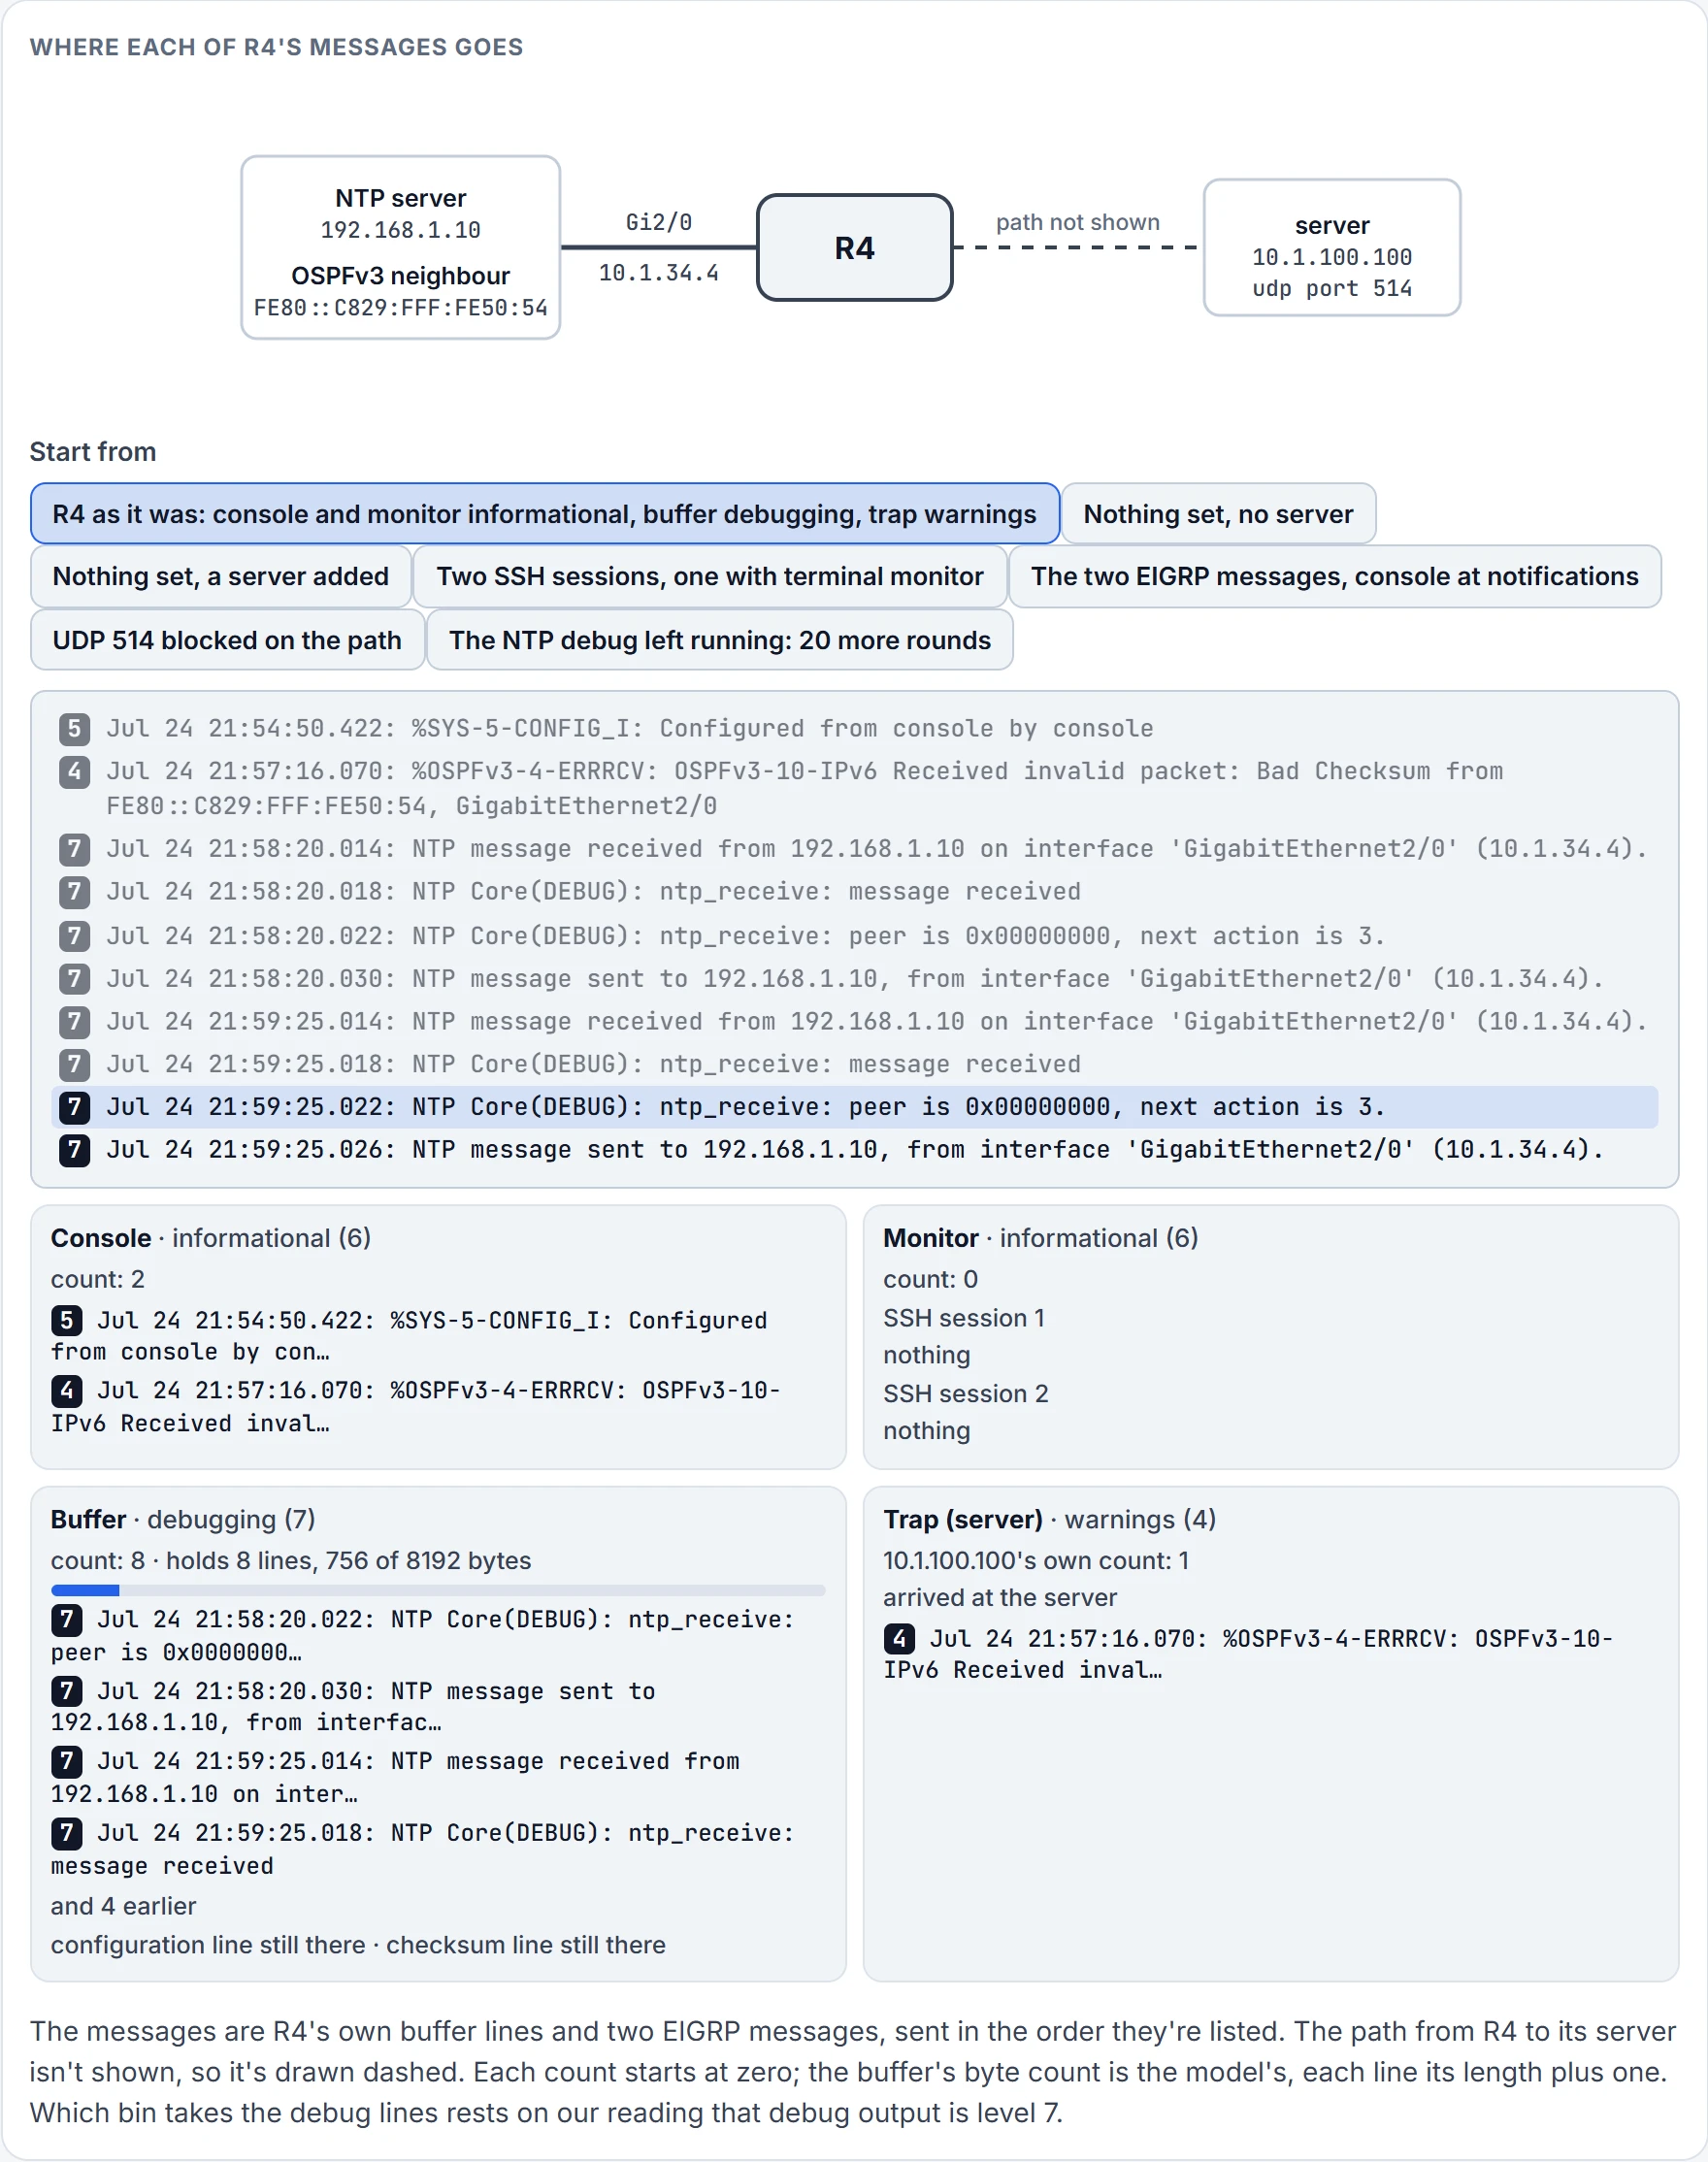
Step 9 of 11 Message 8 of 10: debug output, level 7 on our reading. Taken by: Buffer.
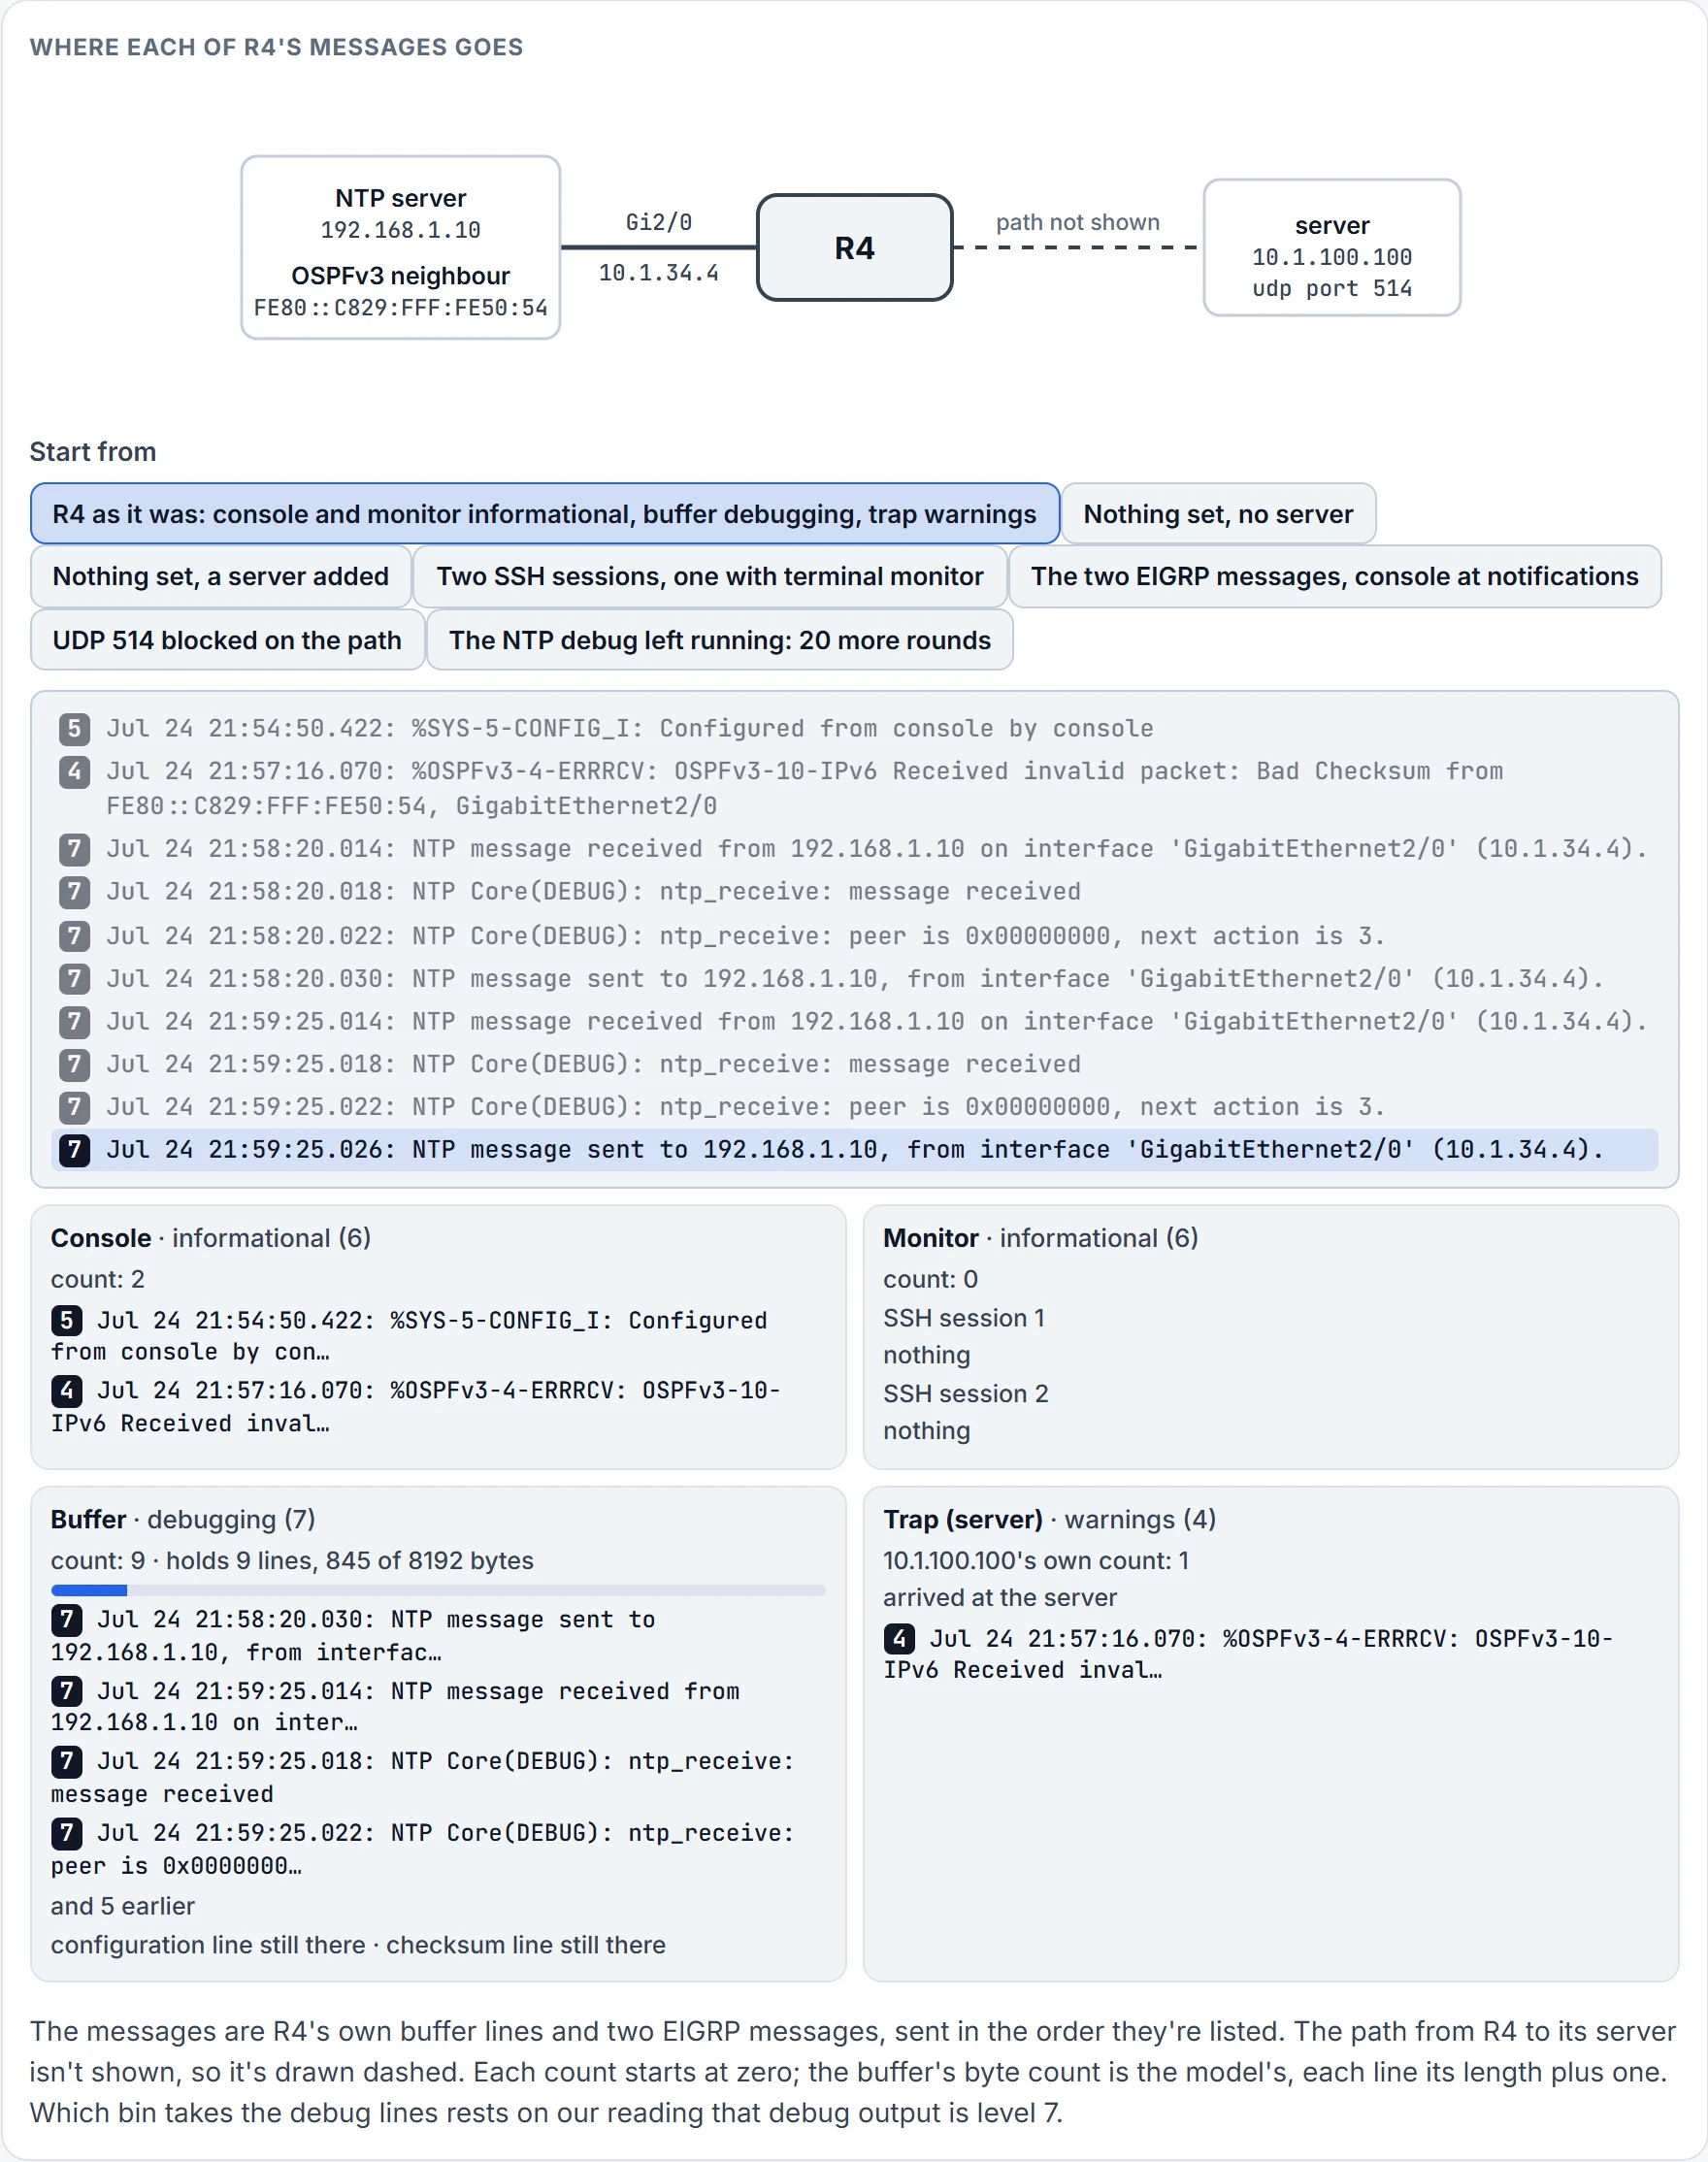
Step 10 of 11 Message 9 of 10: debug output, level 7 on our reading. Taken by: Buffer.
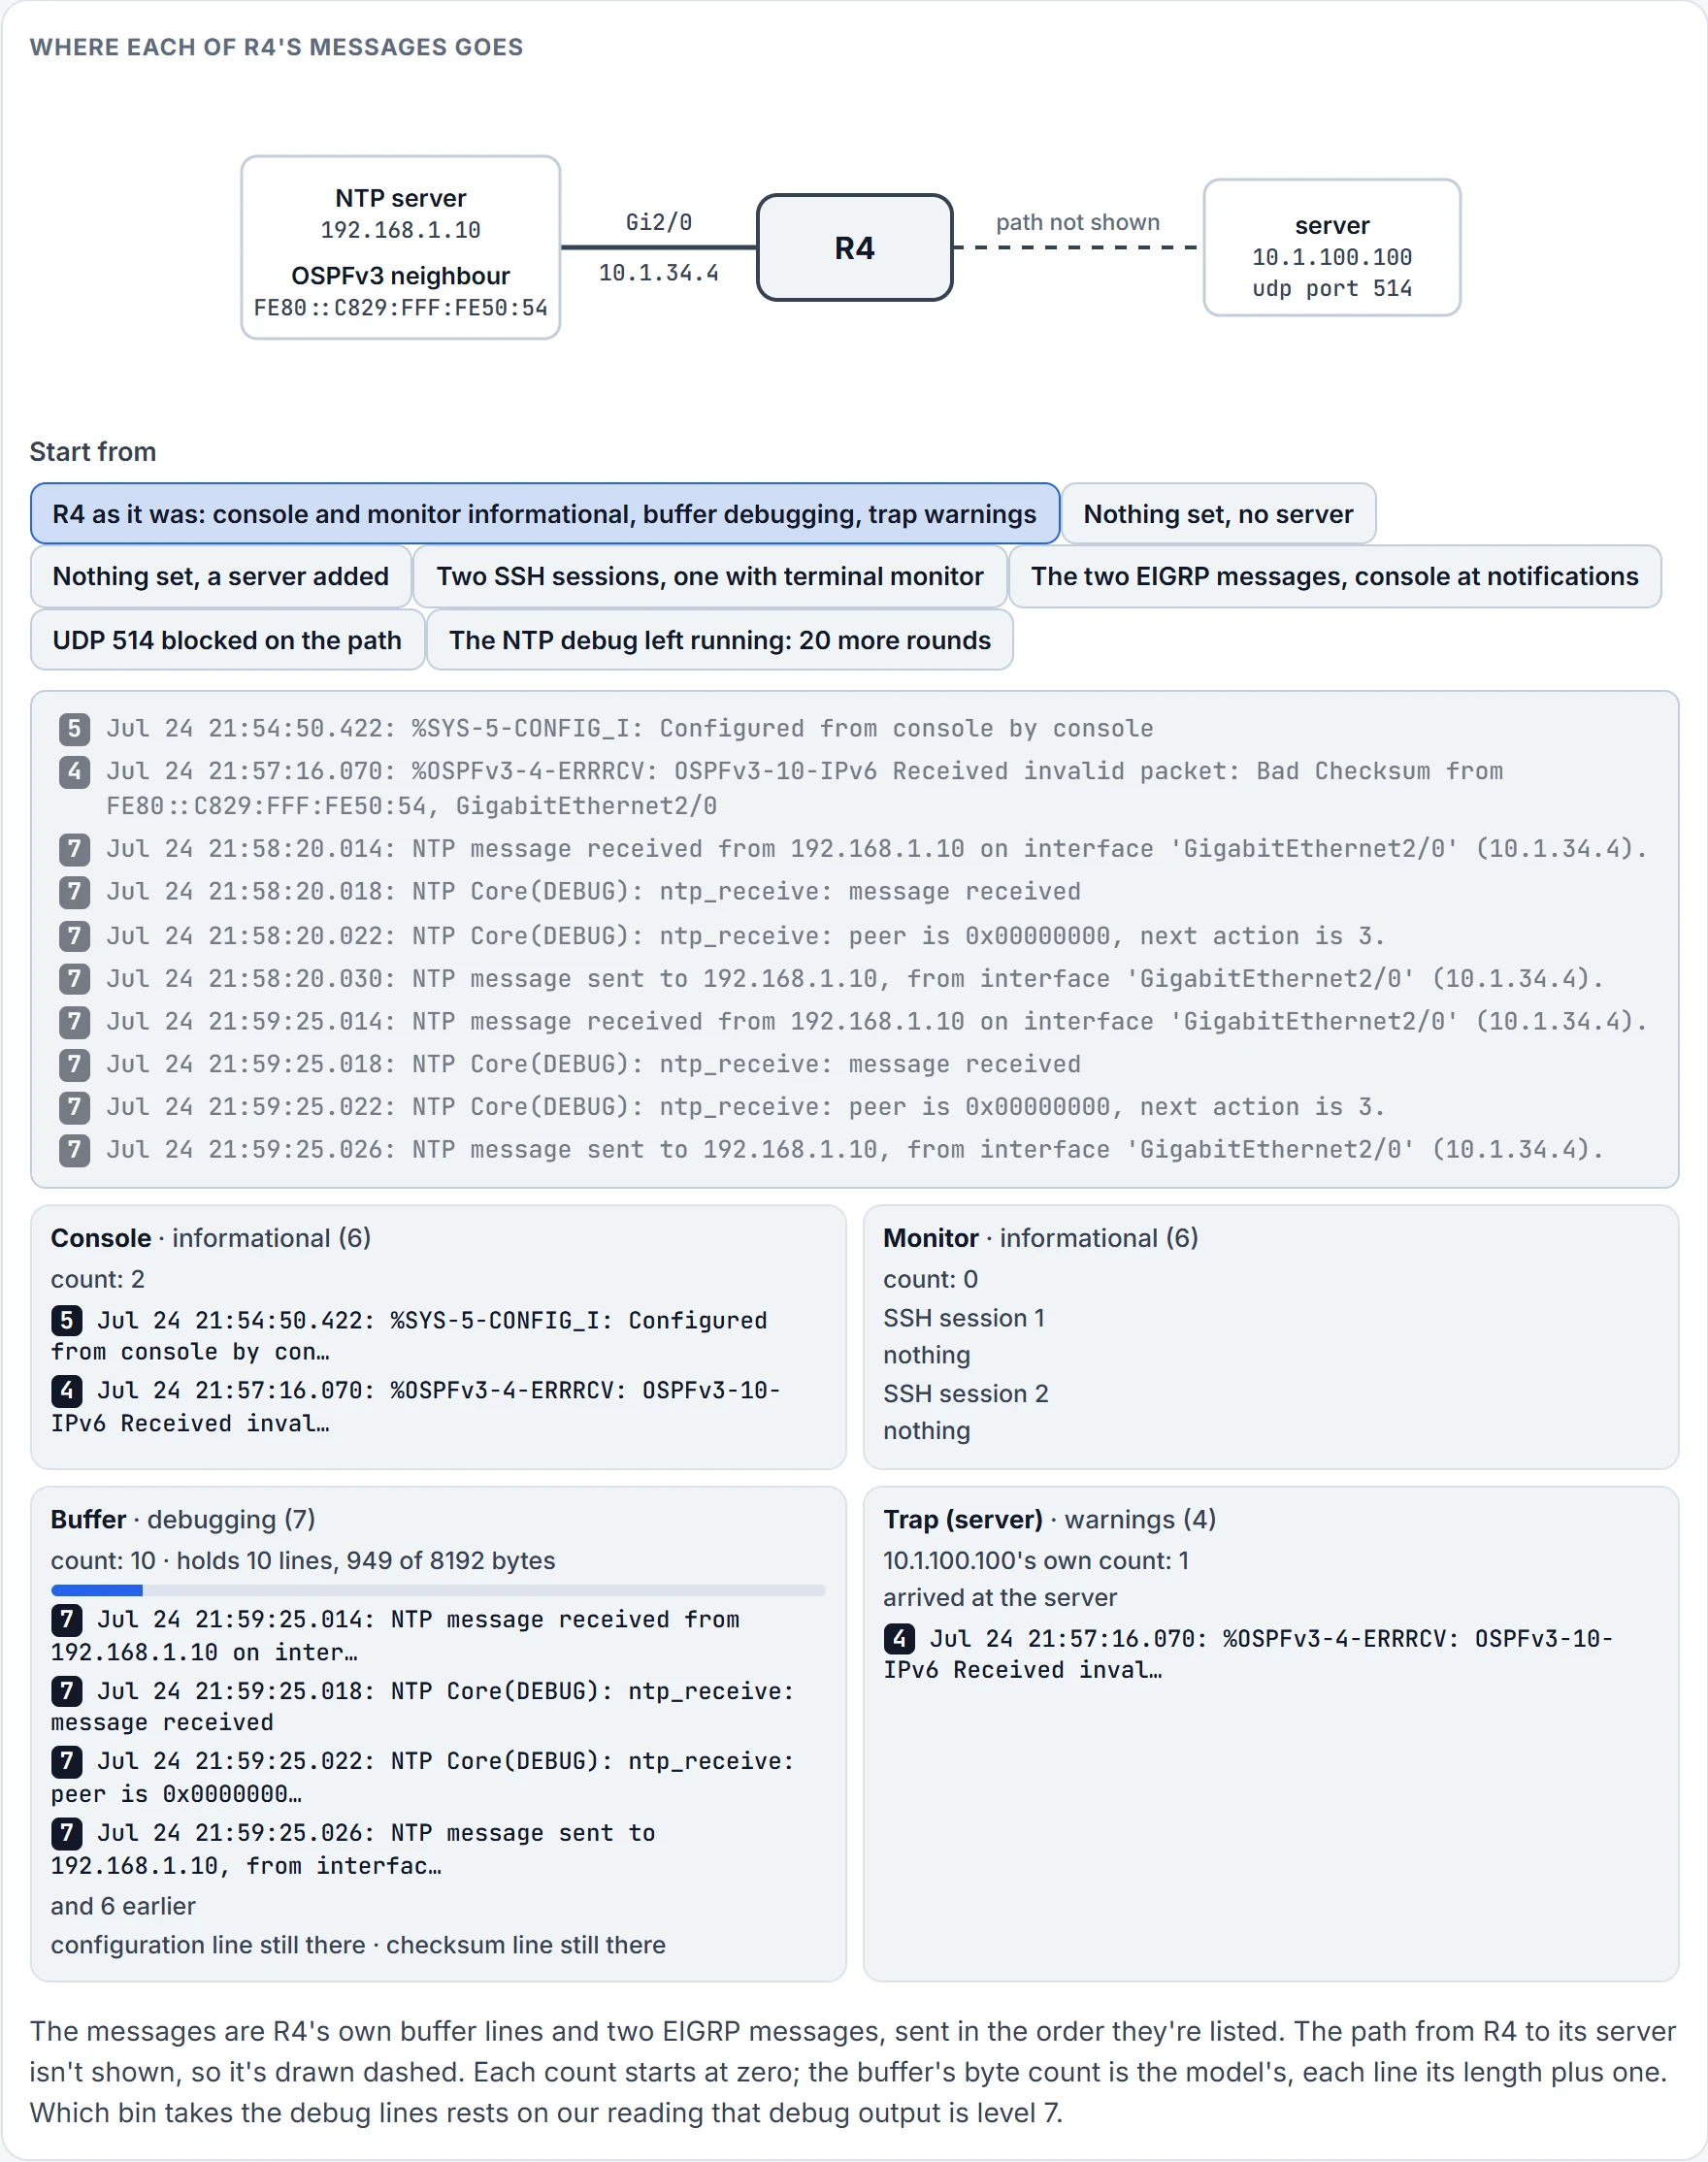
Step 11 of 11 Message 10 of 10: debug output, level 7 on our reading. Taken by: Buffer.
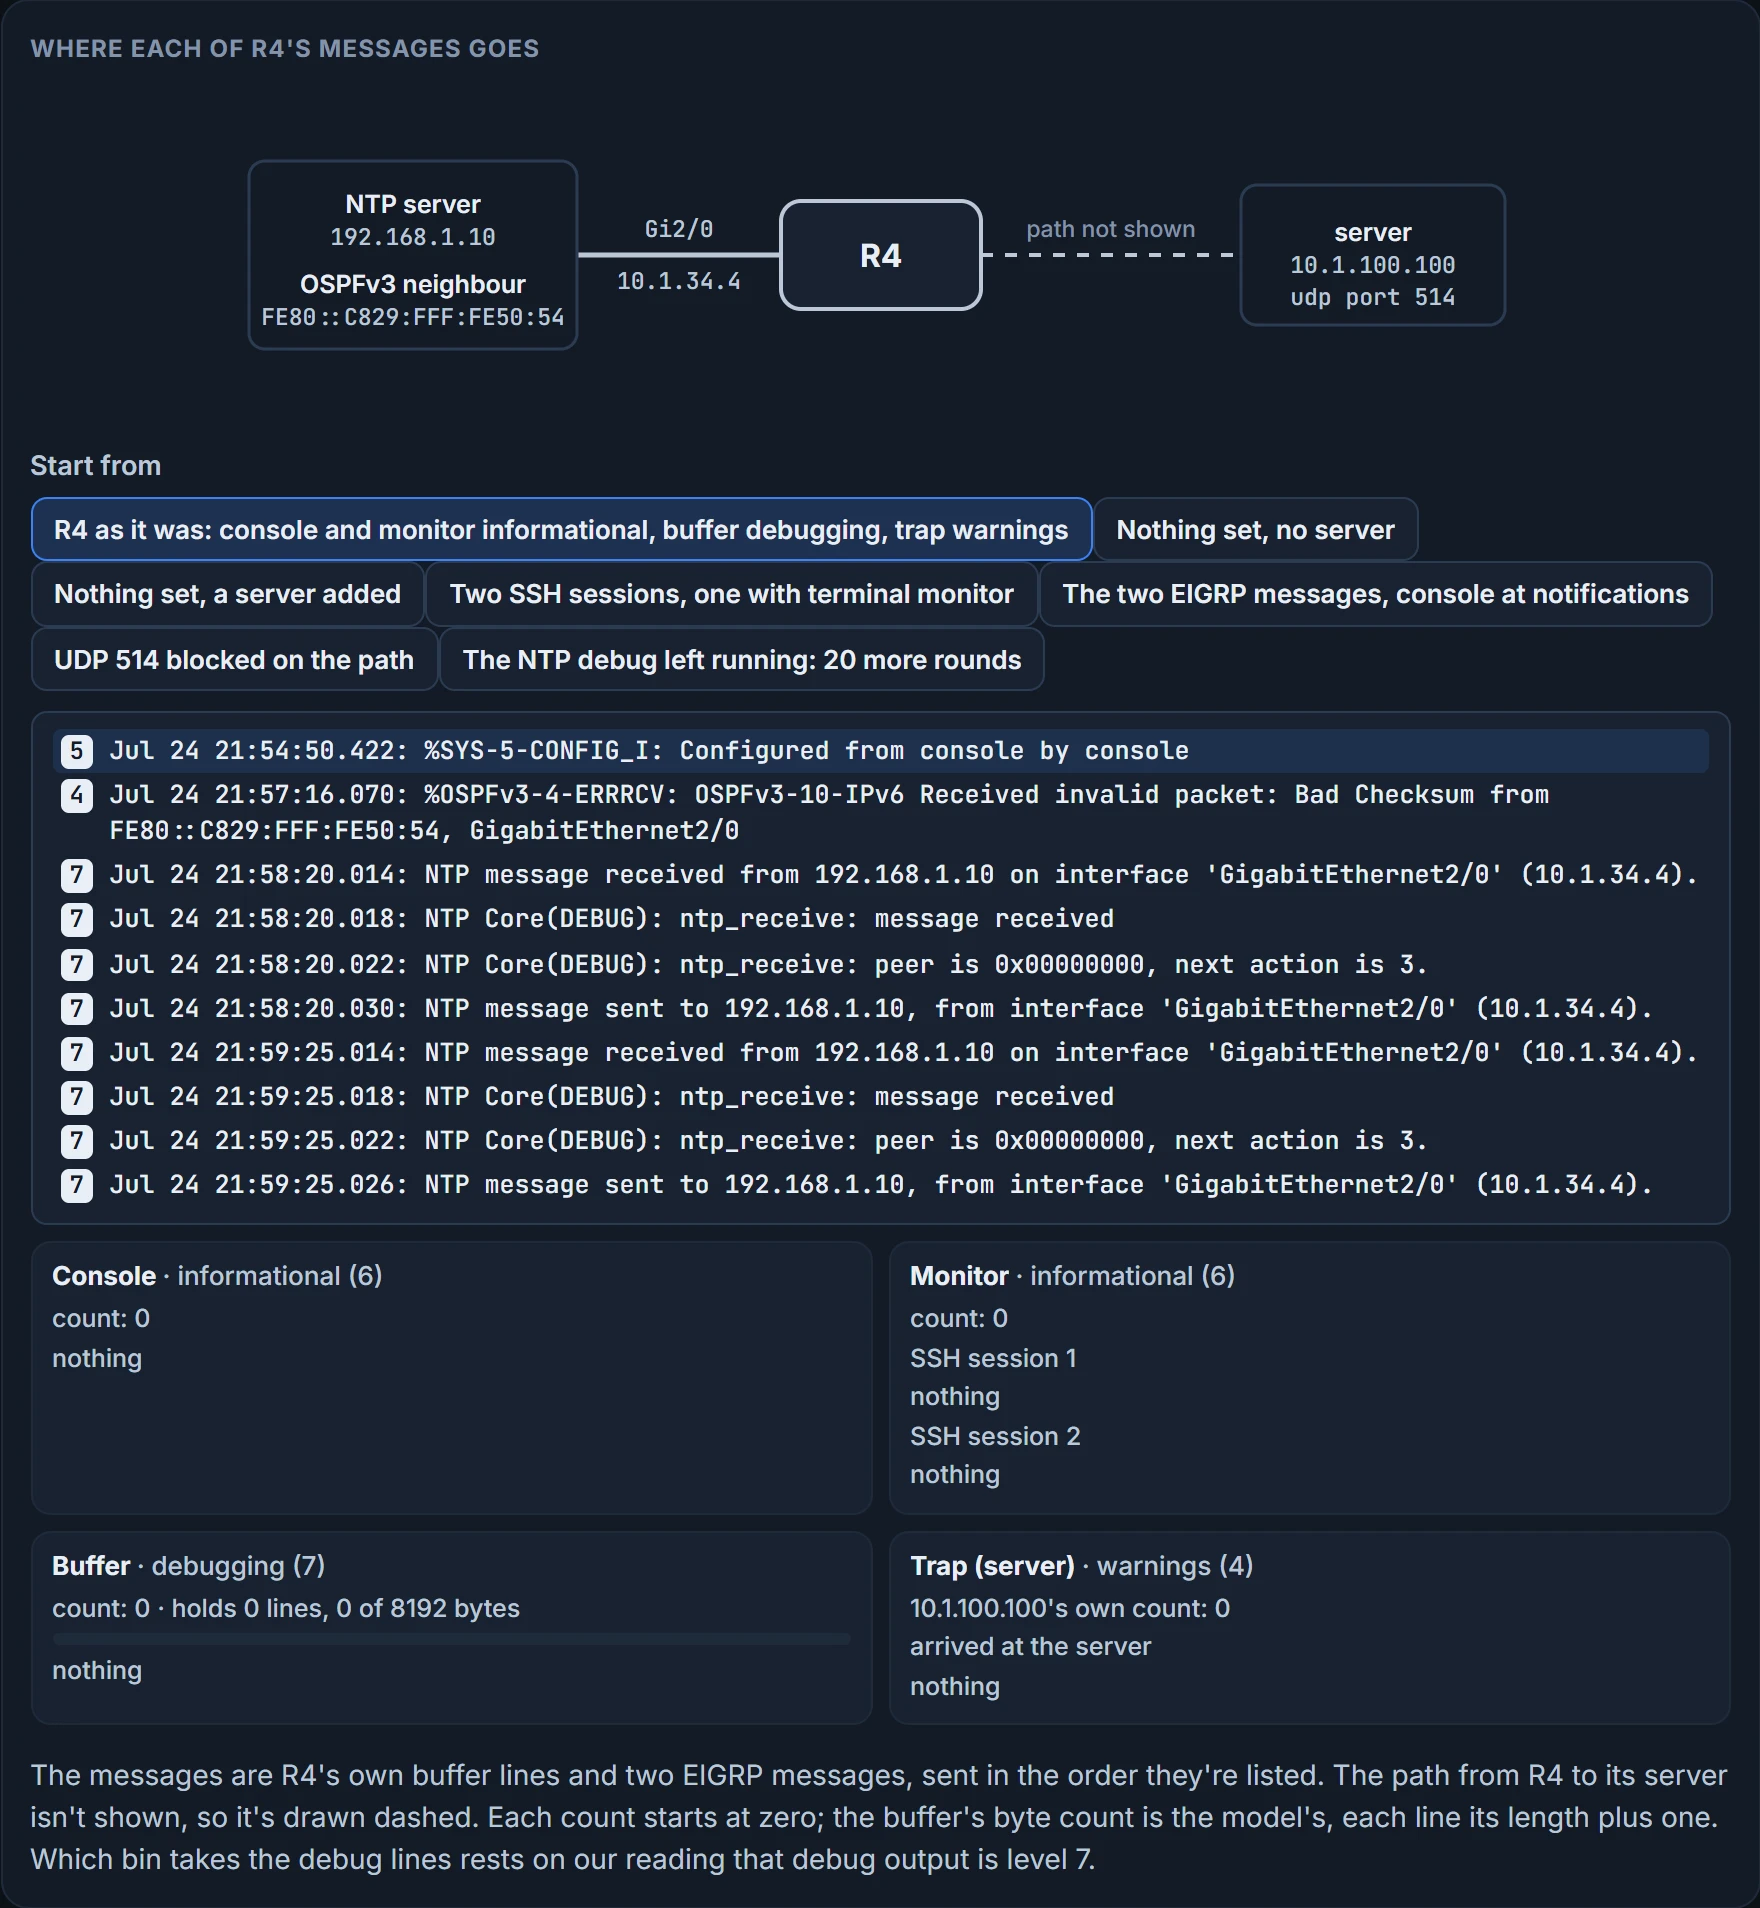
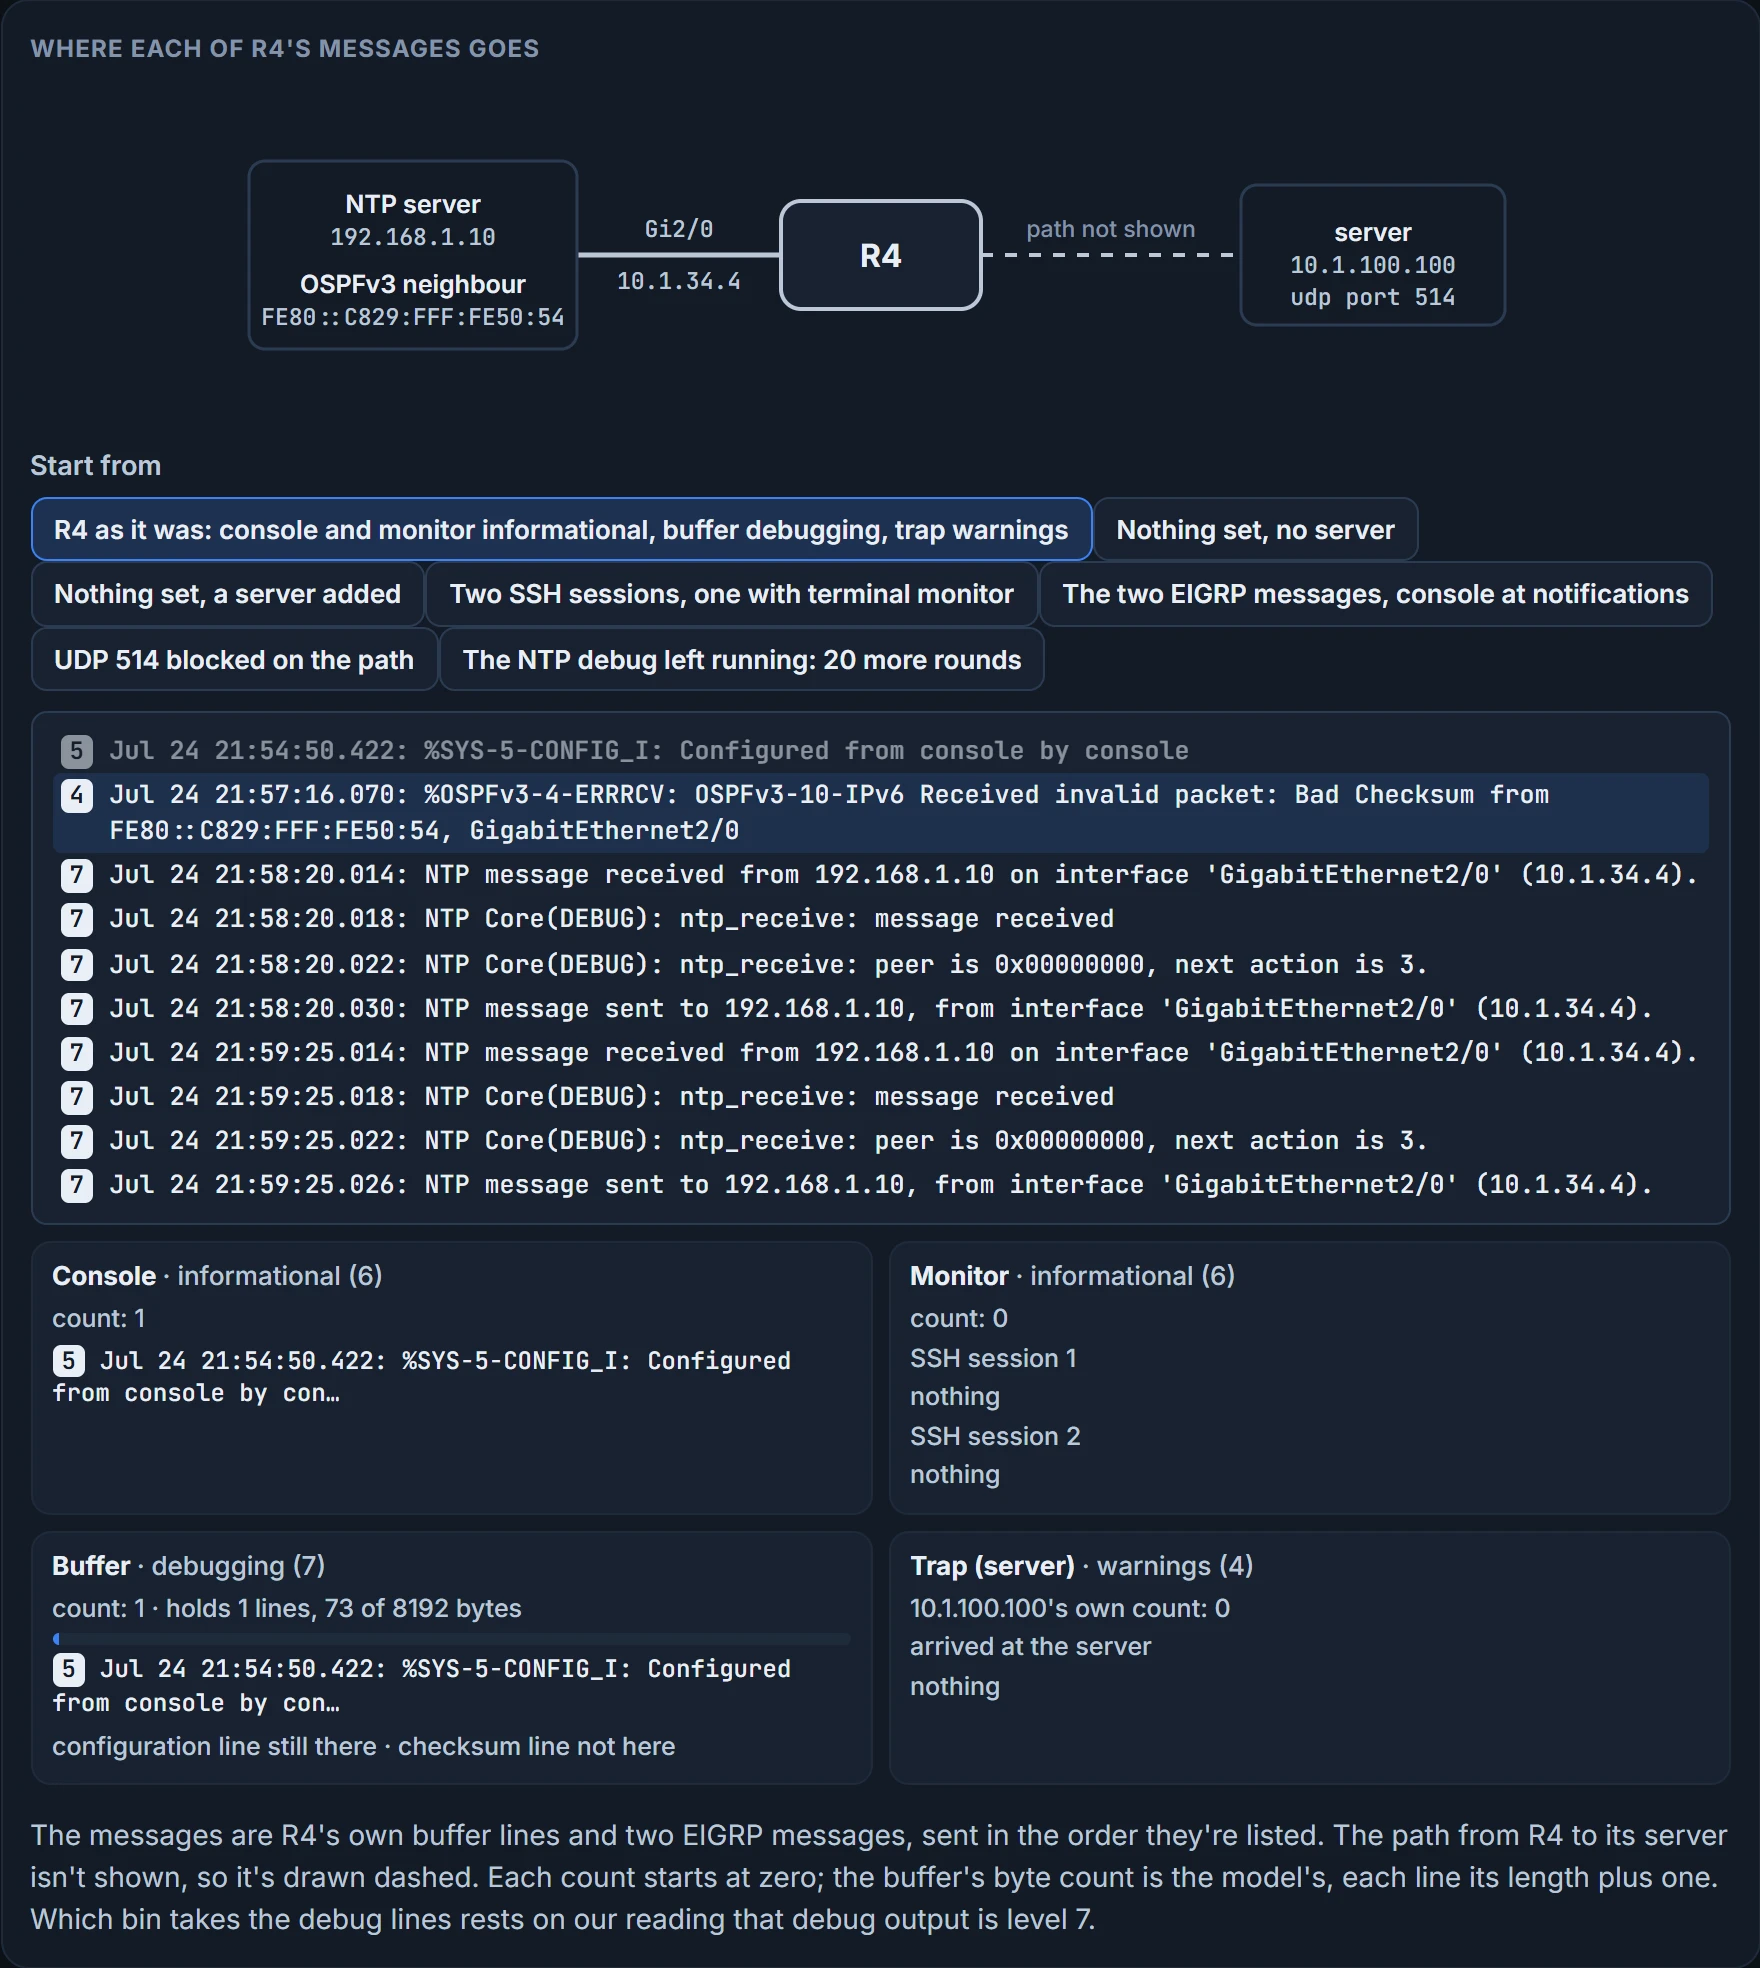
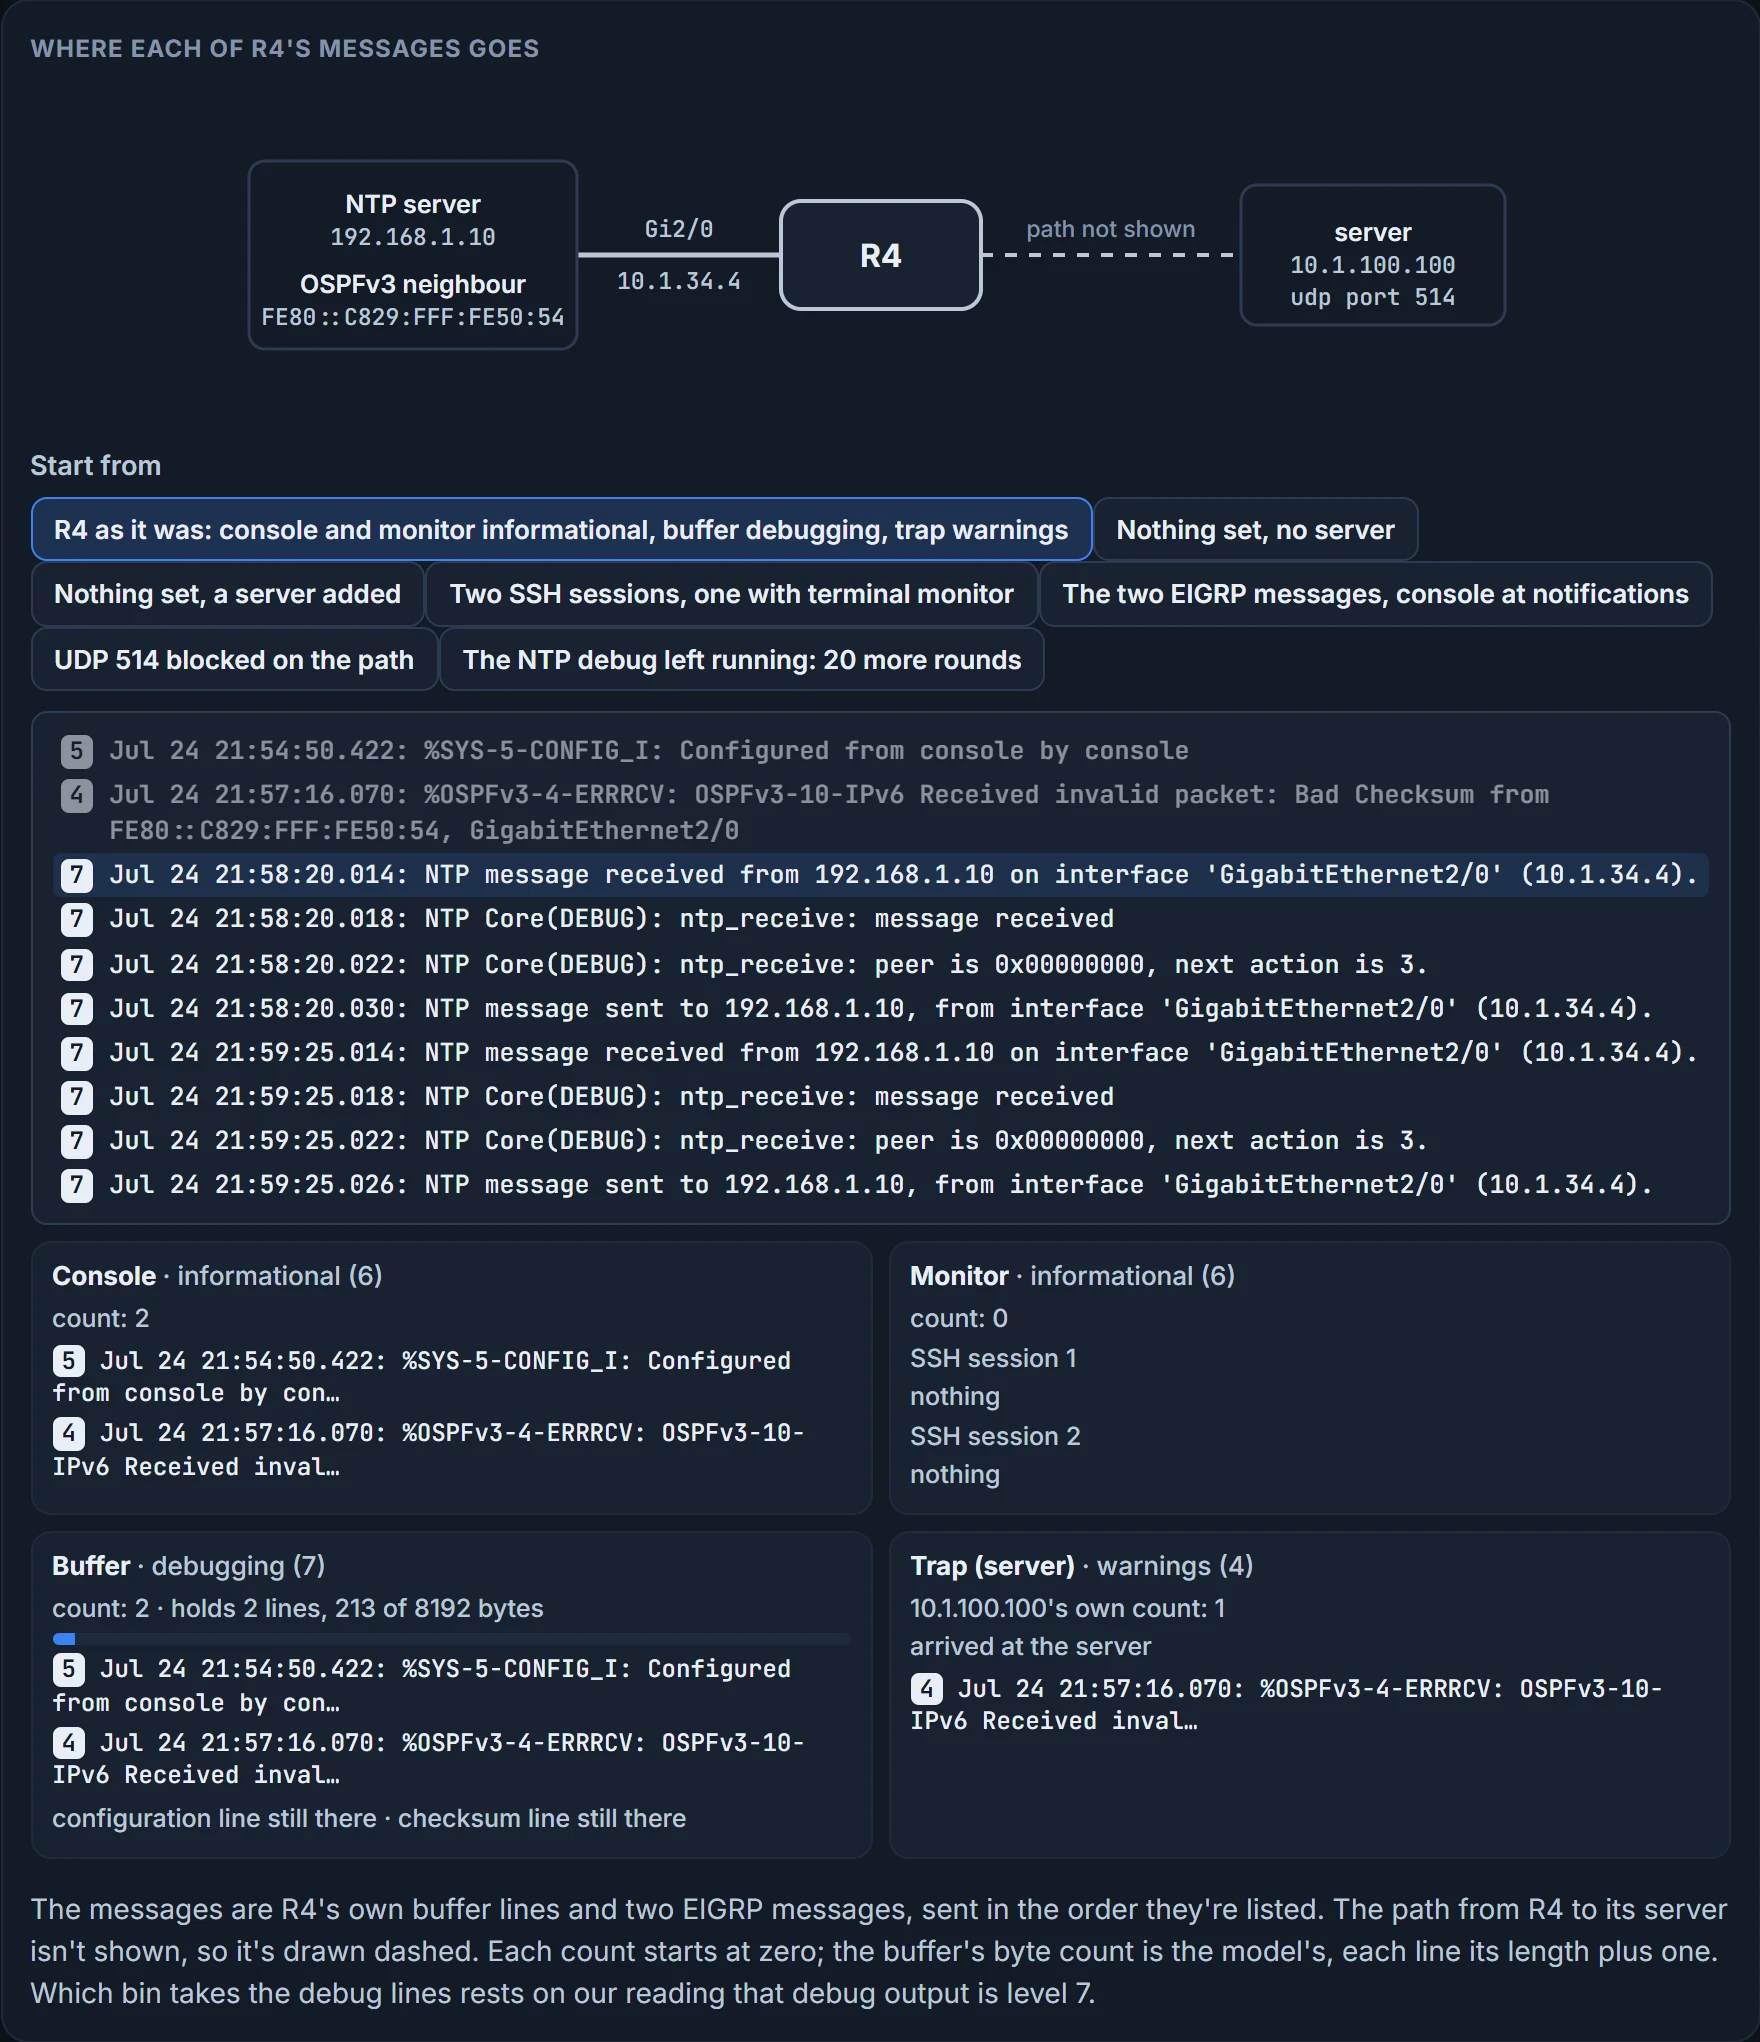
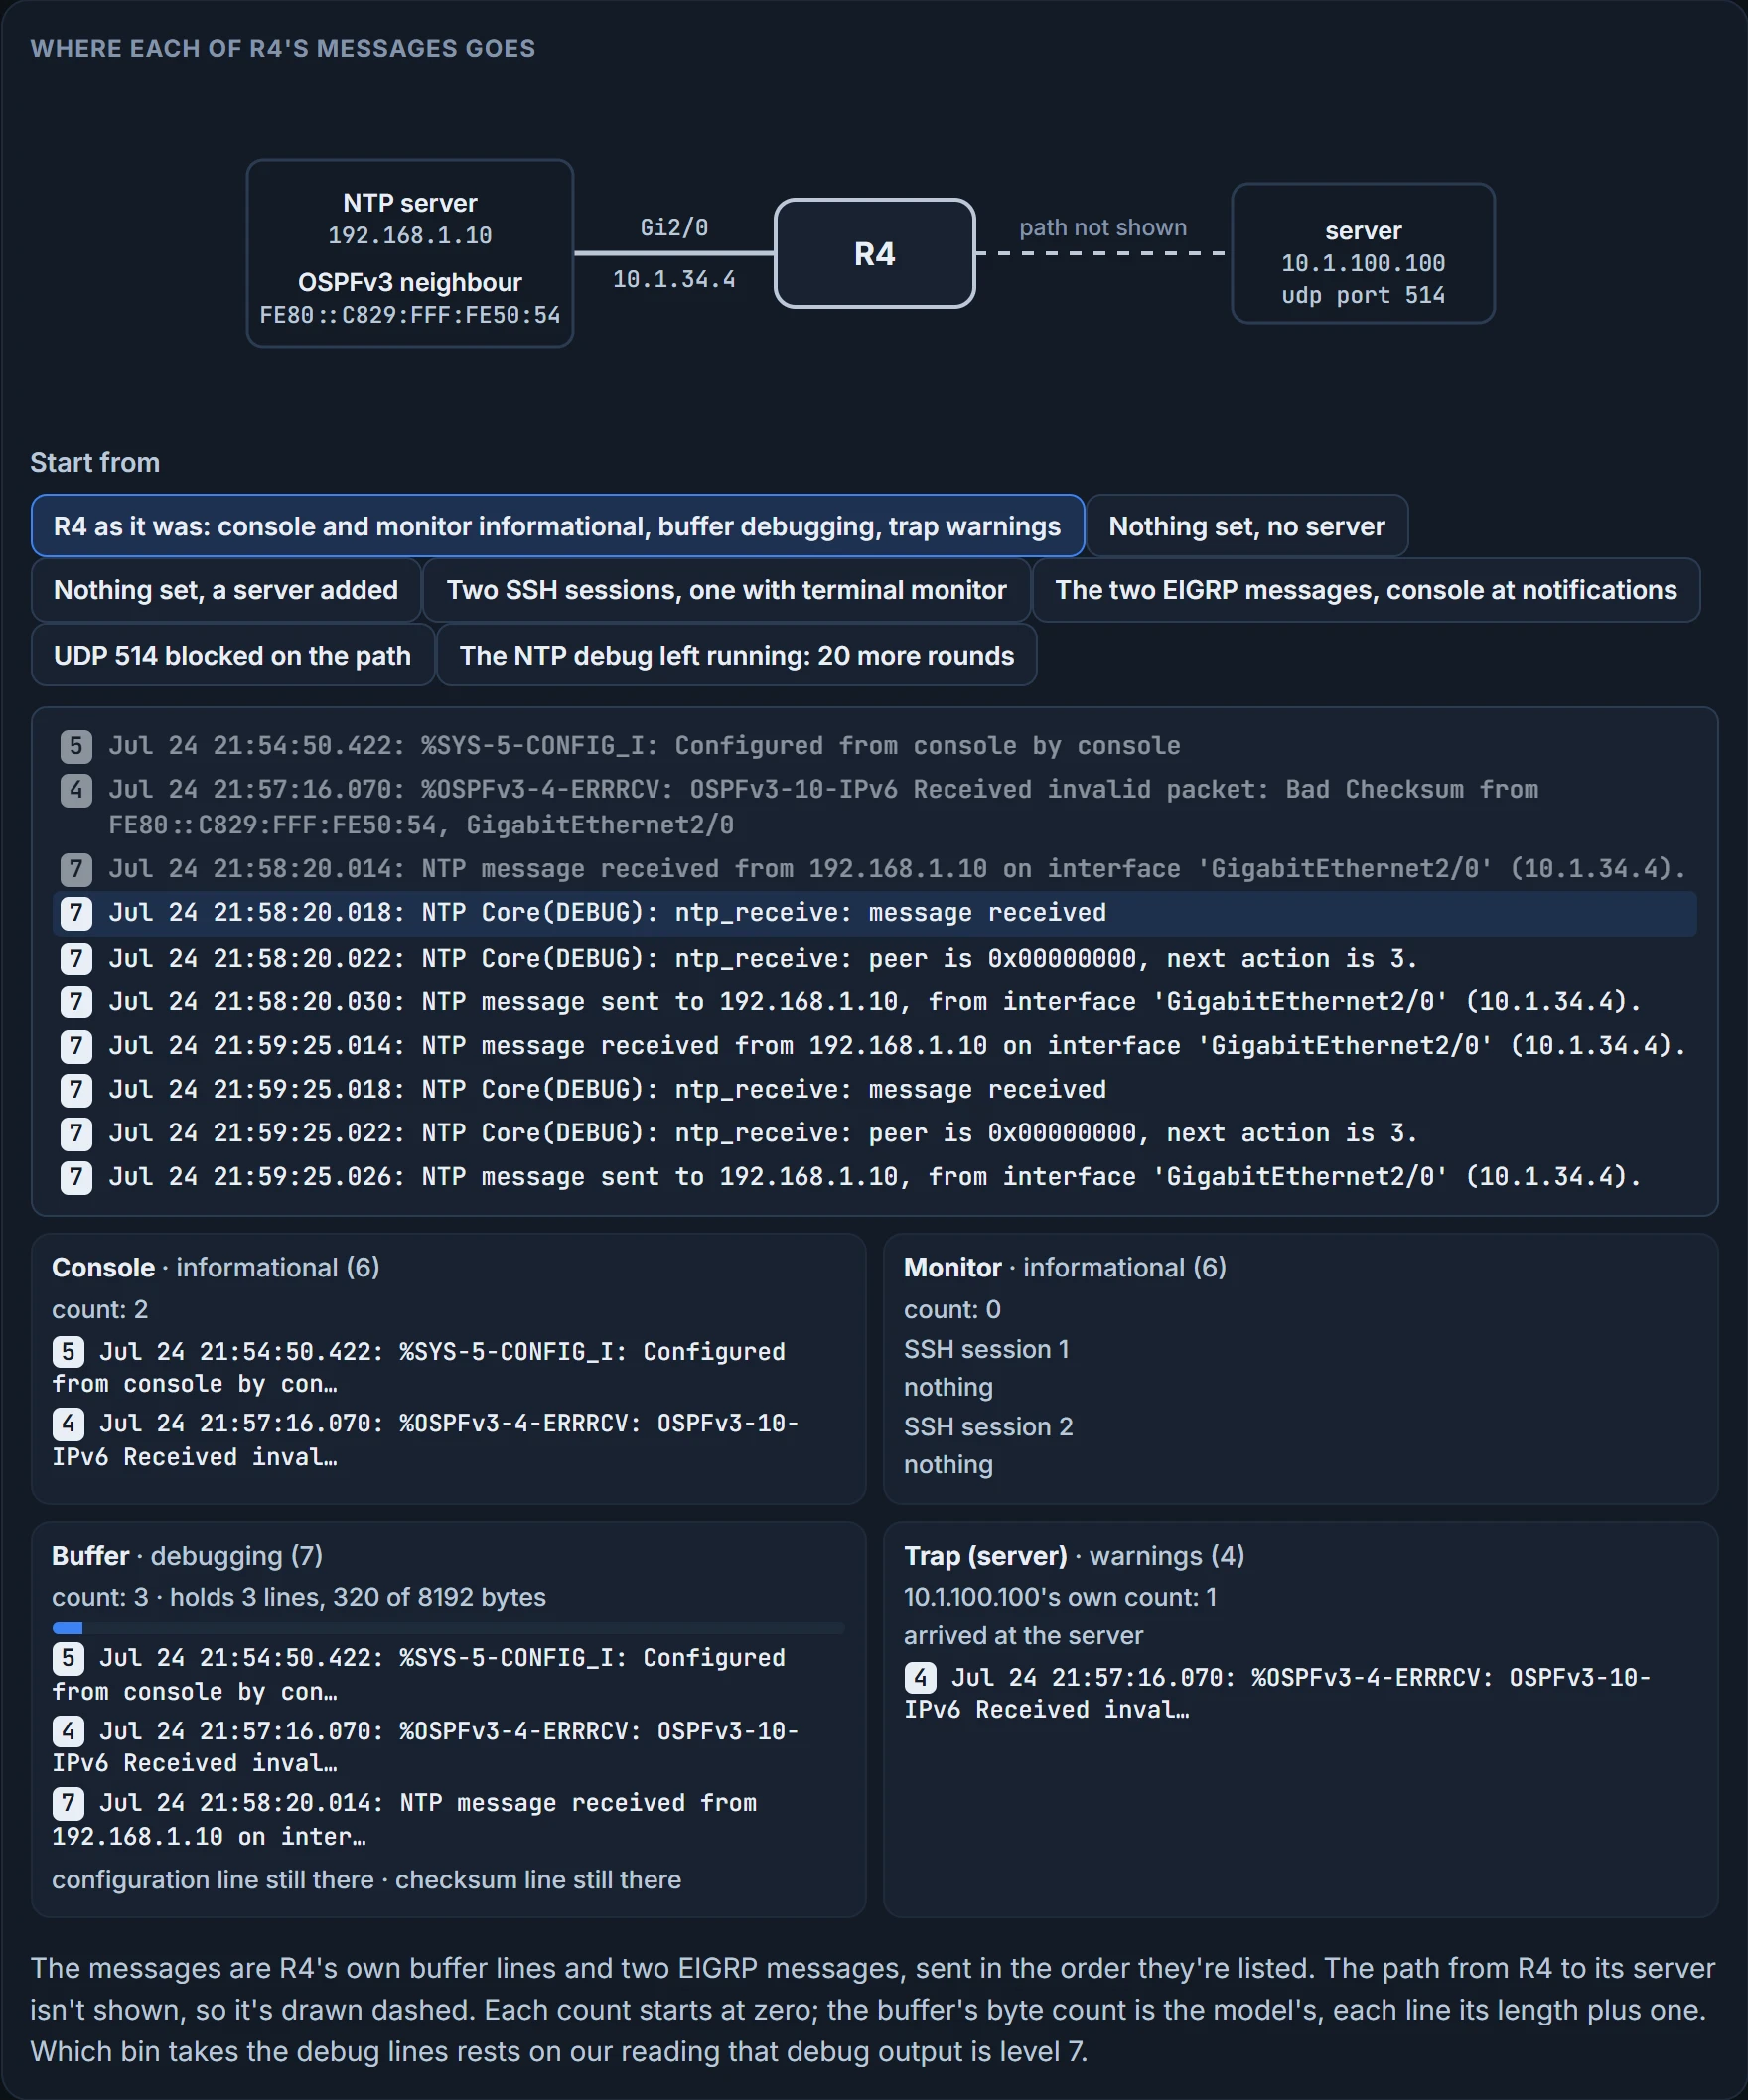
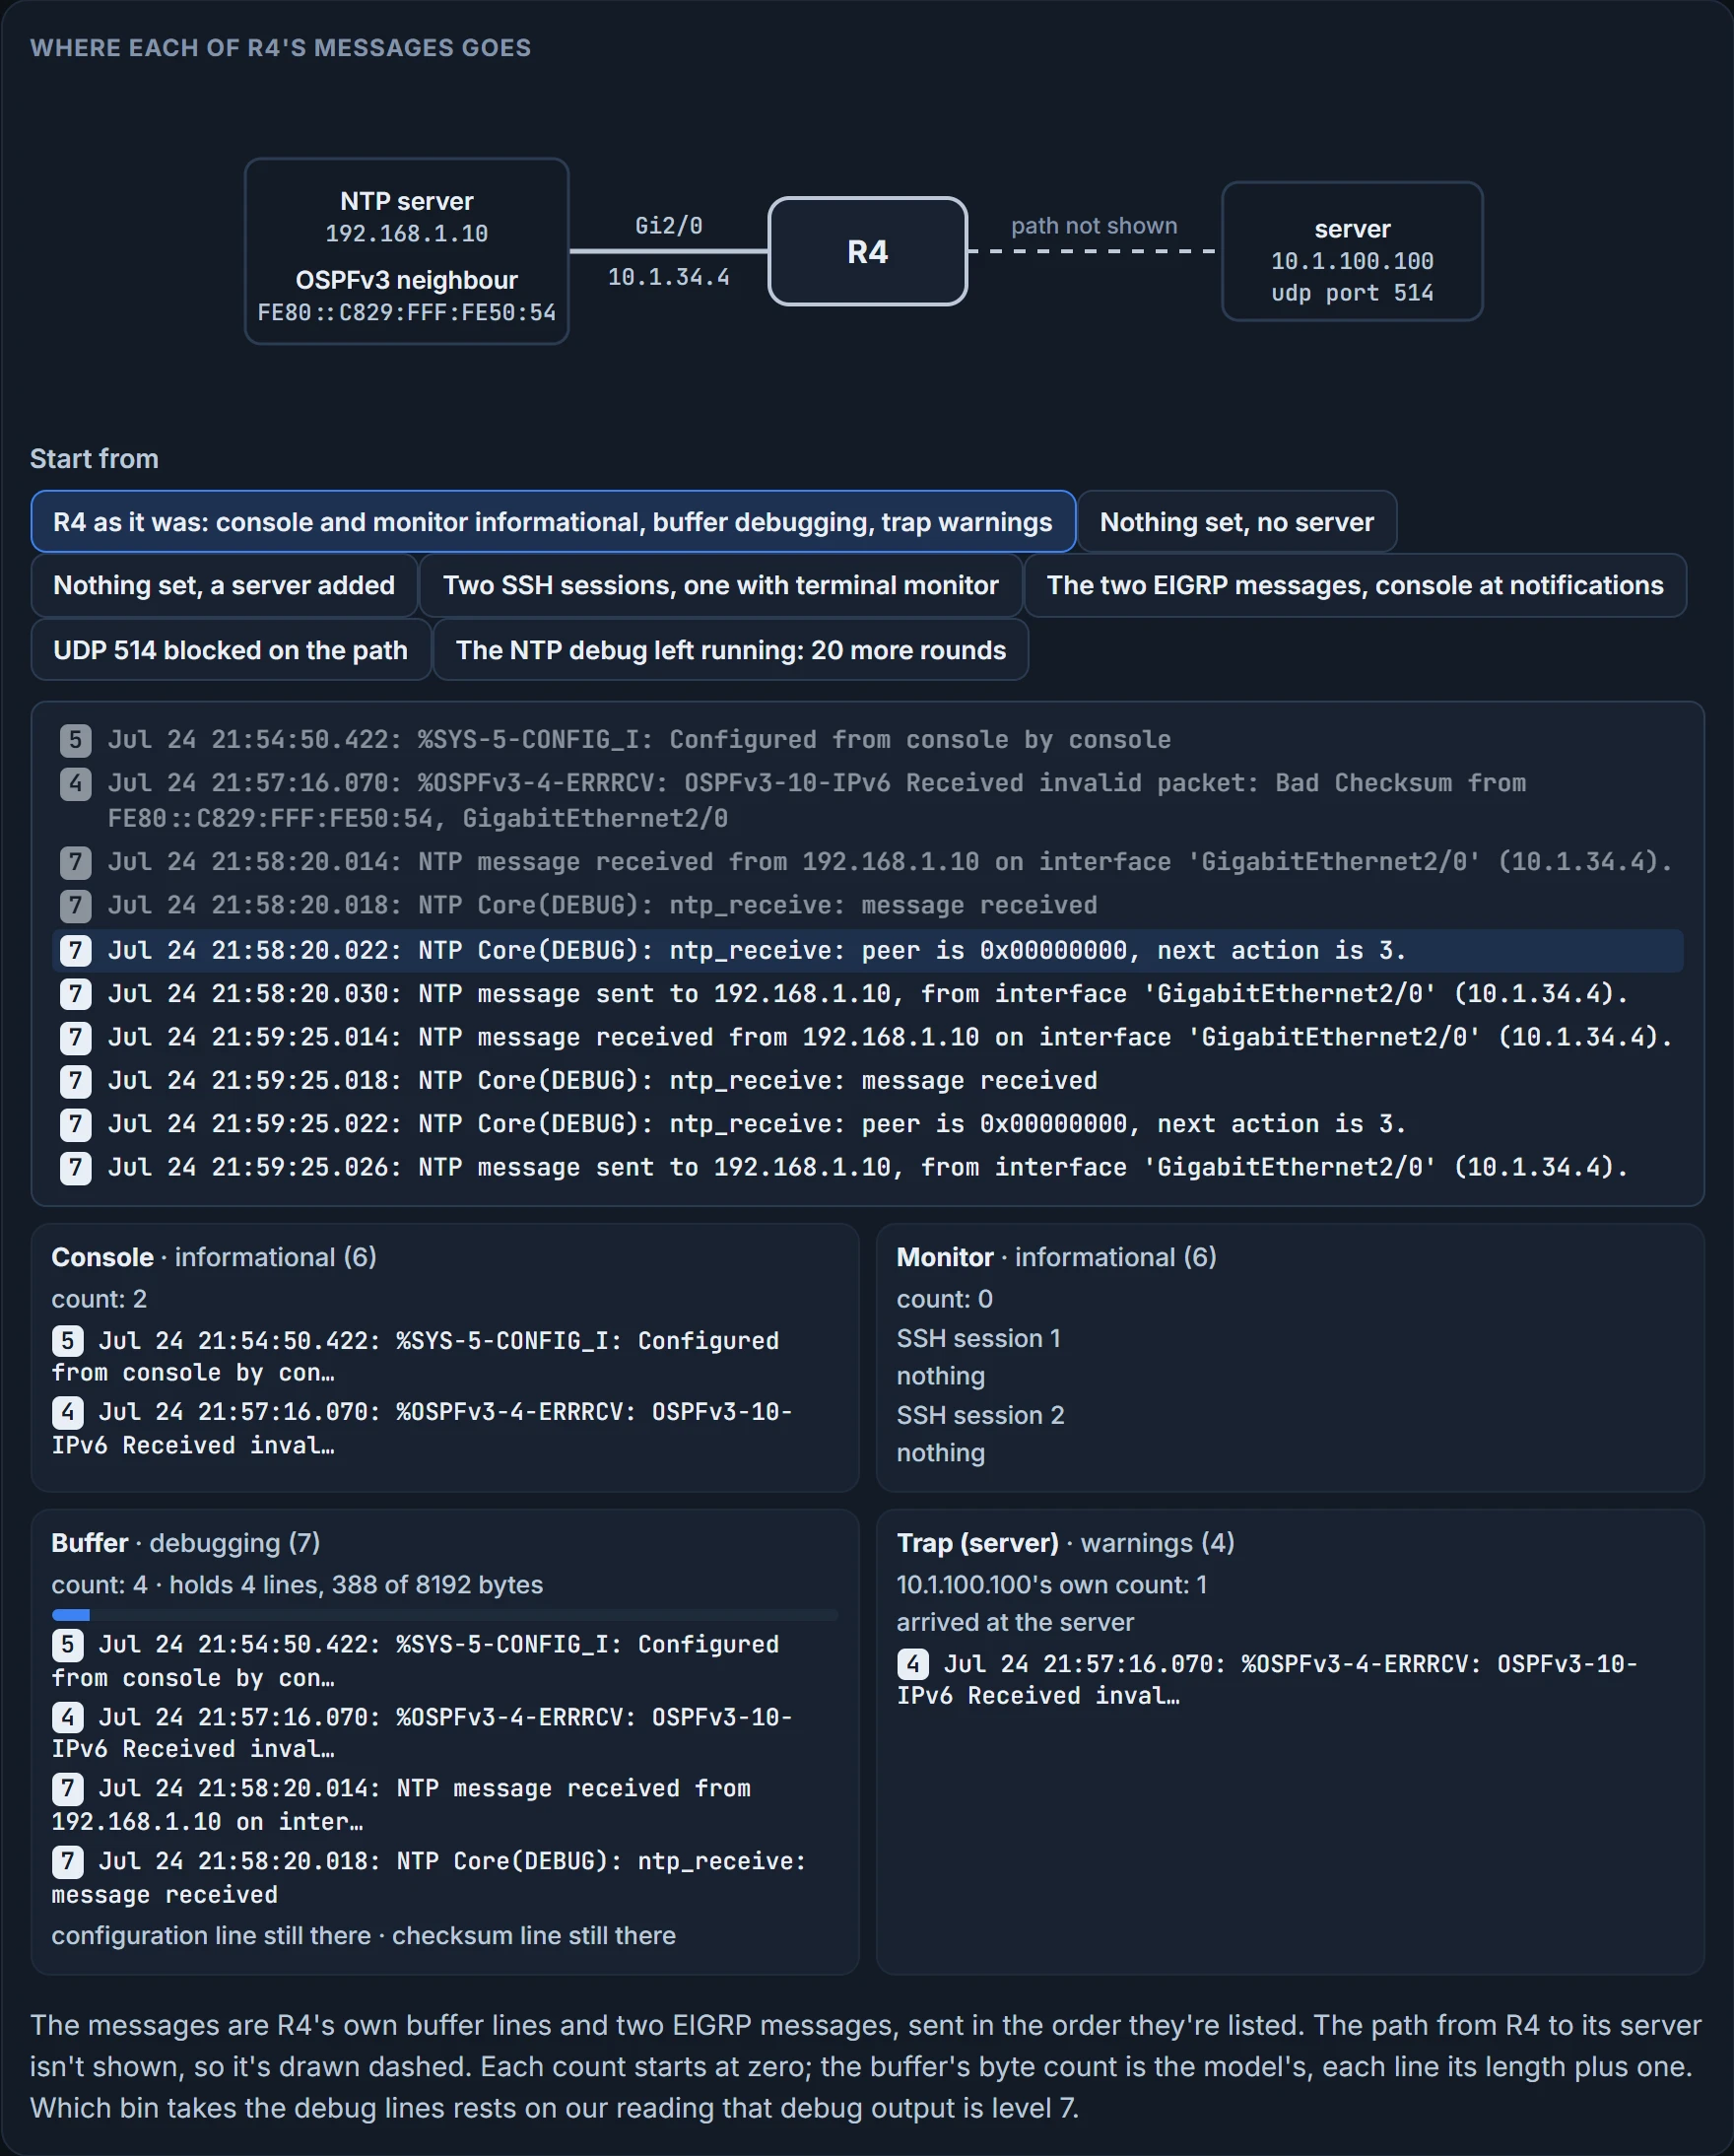
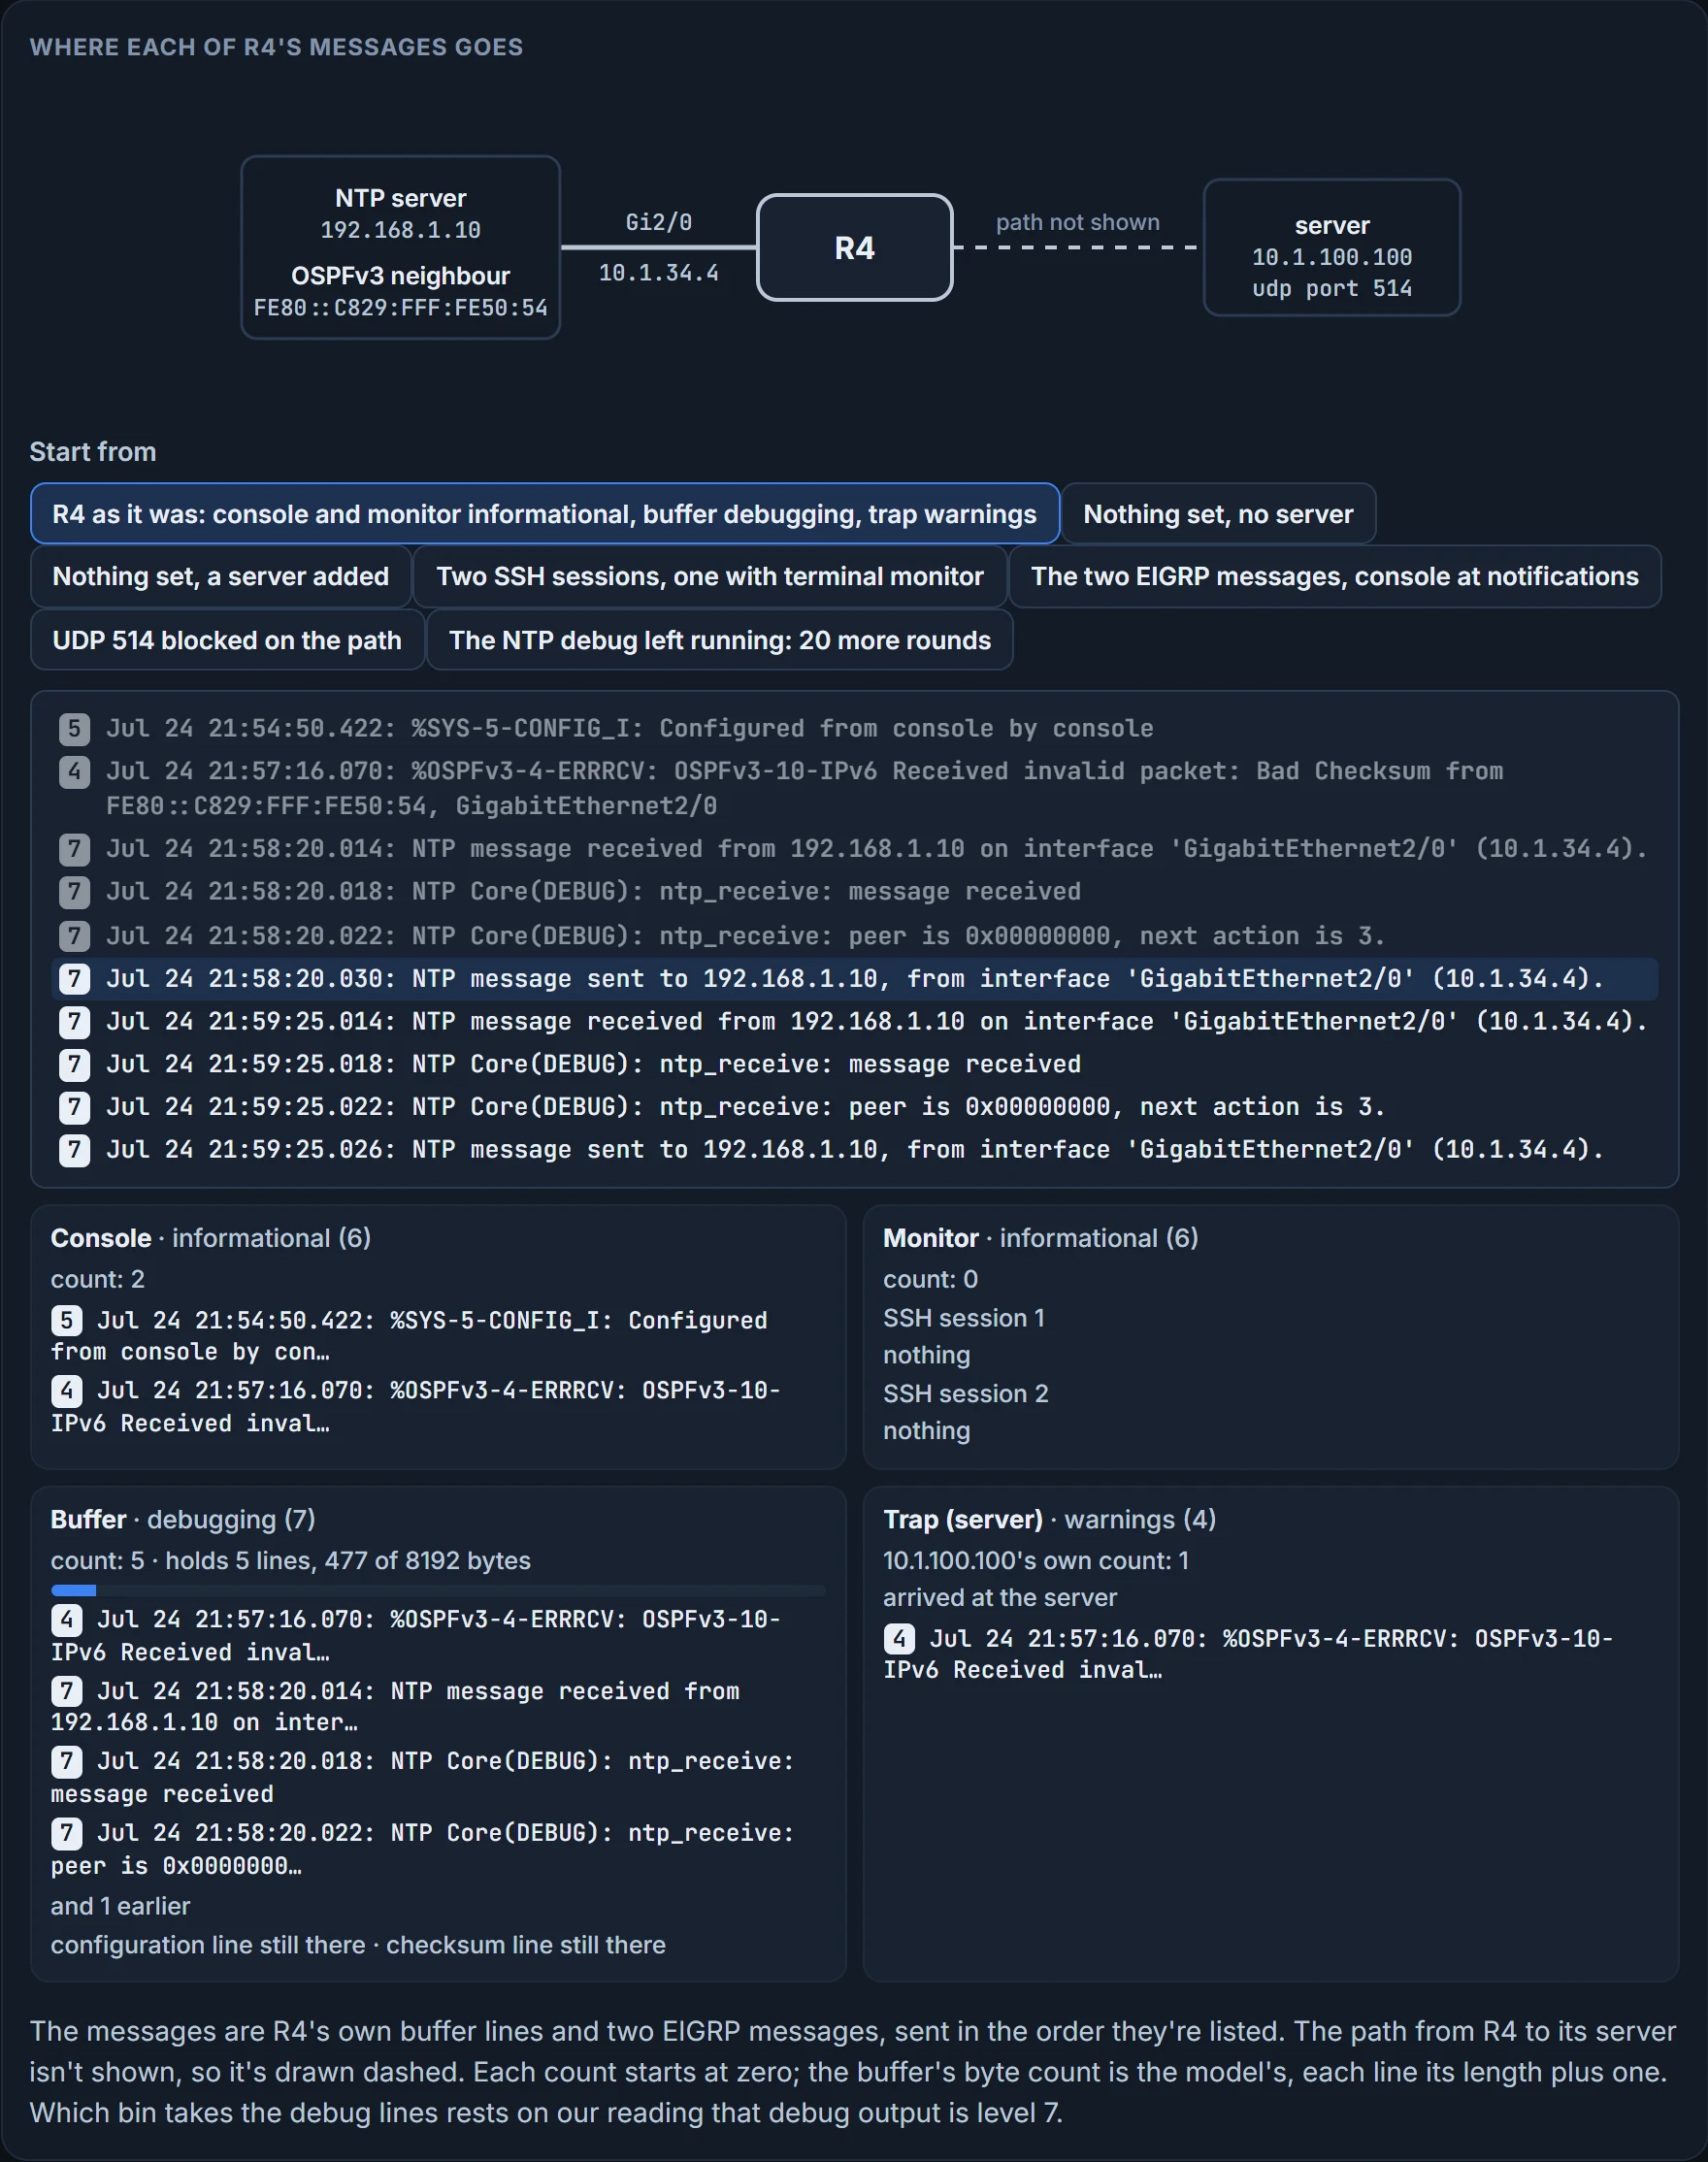
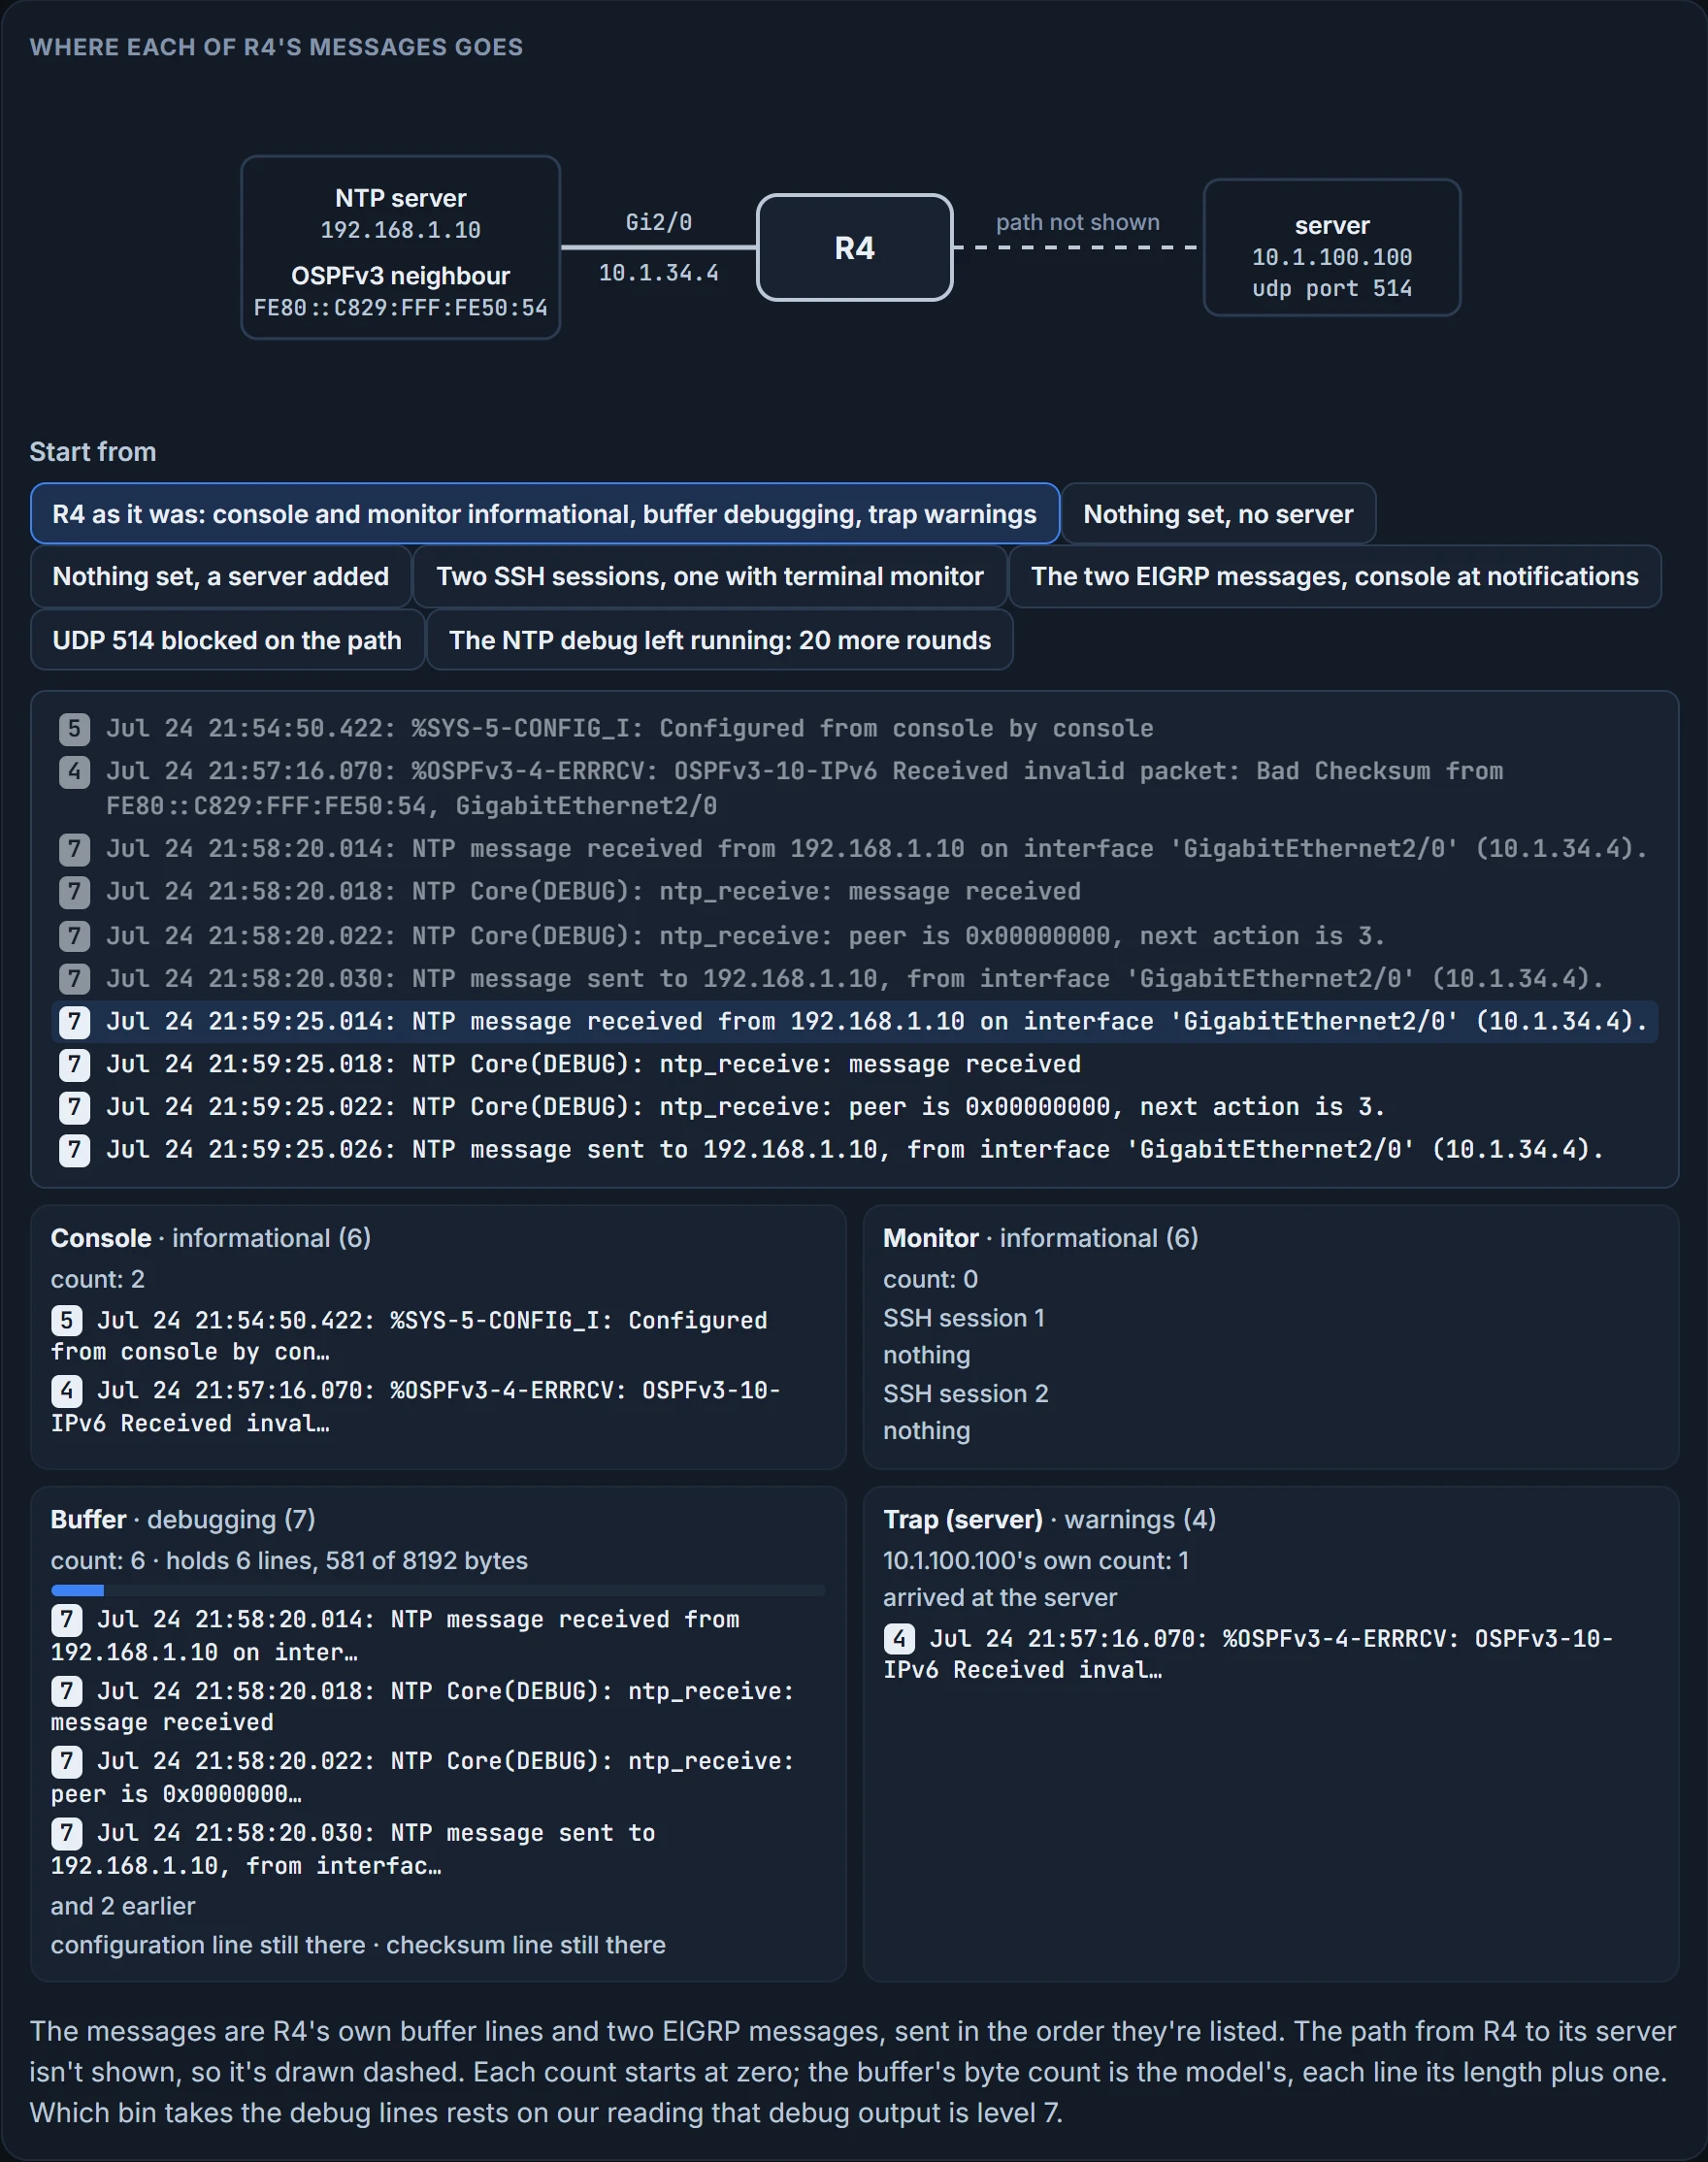
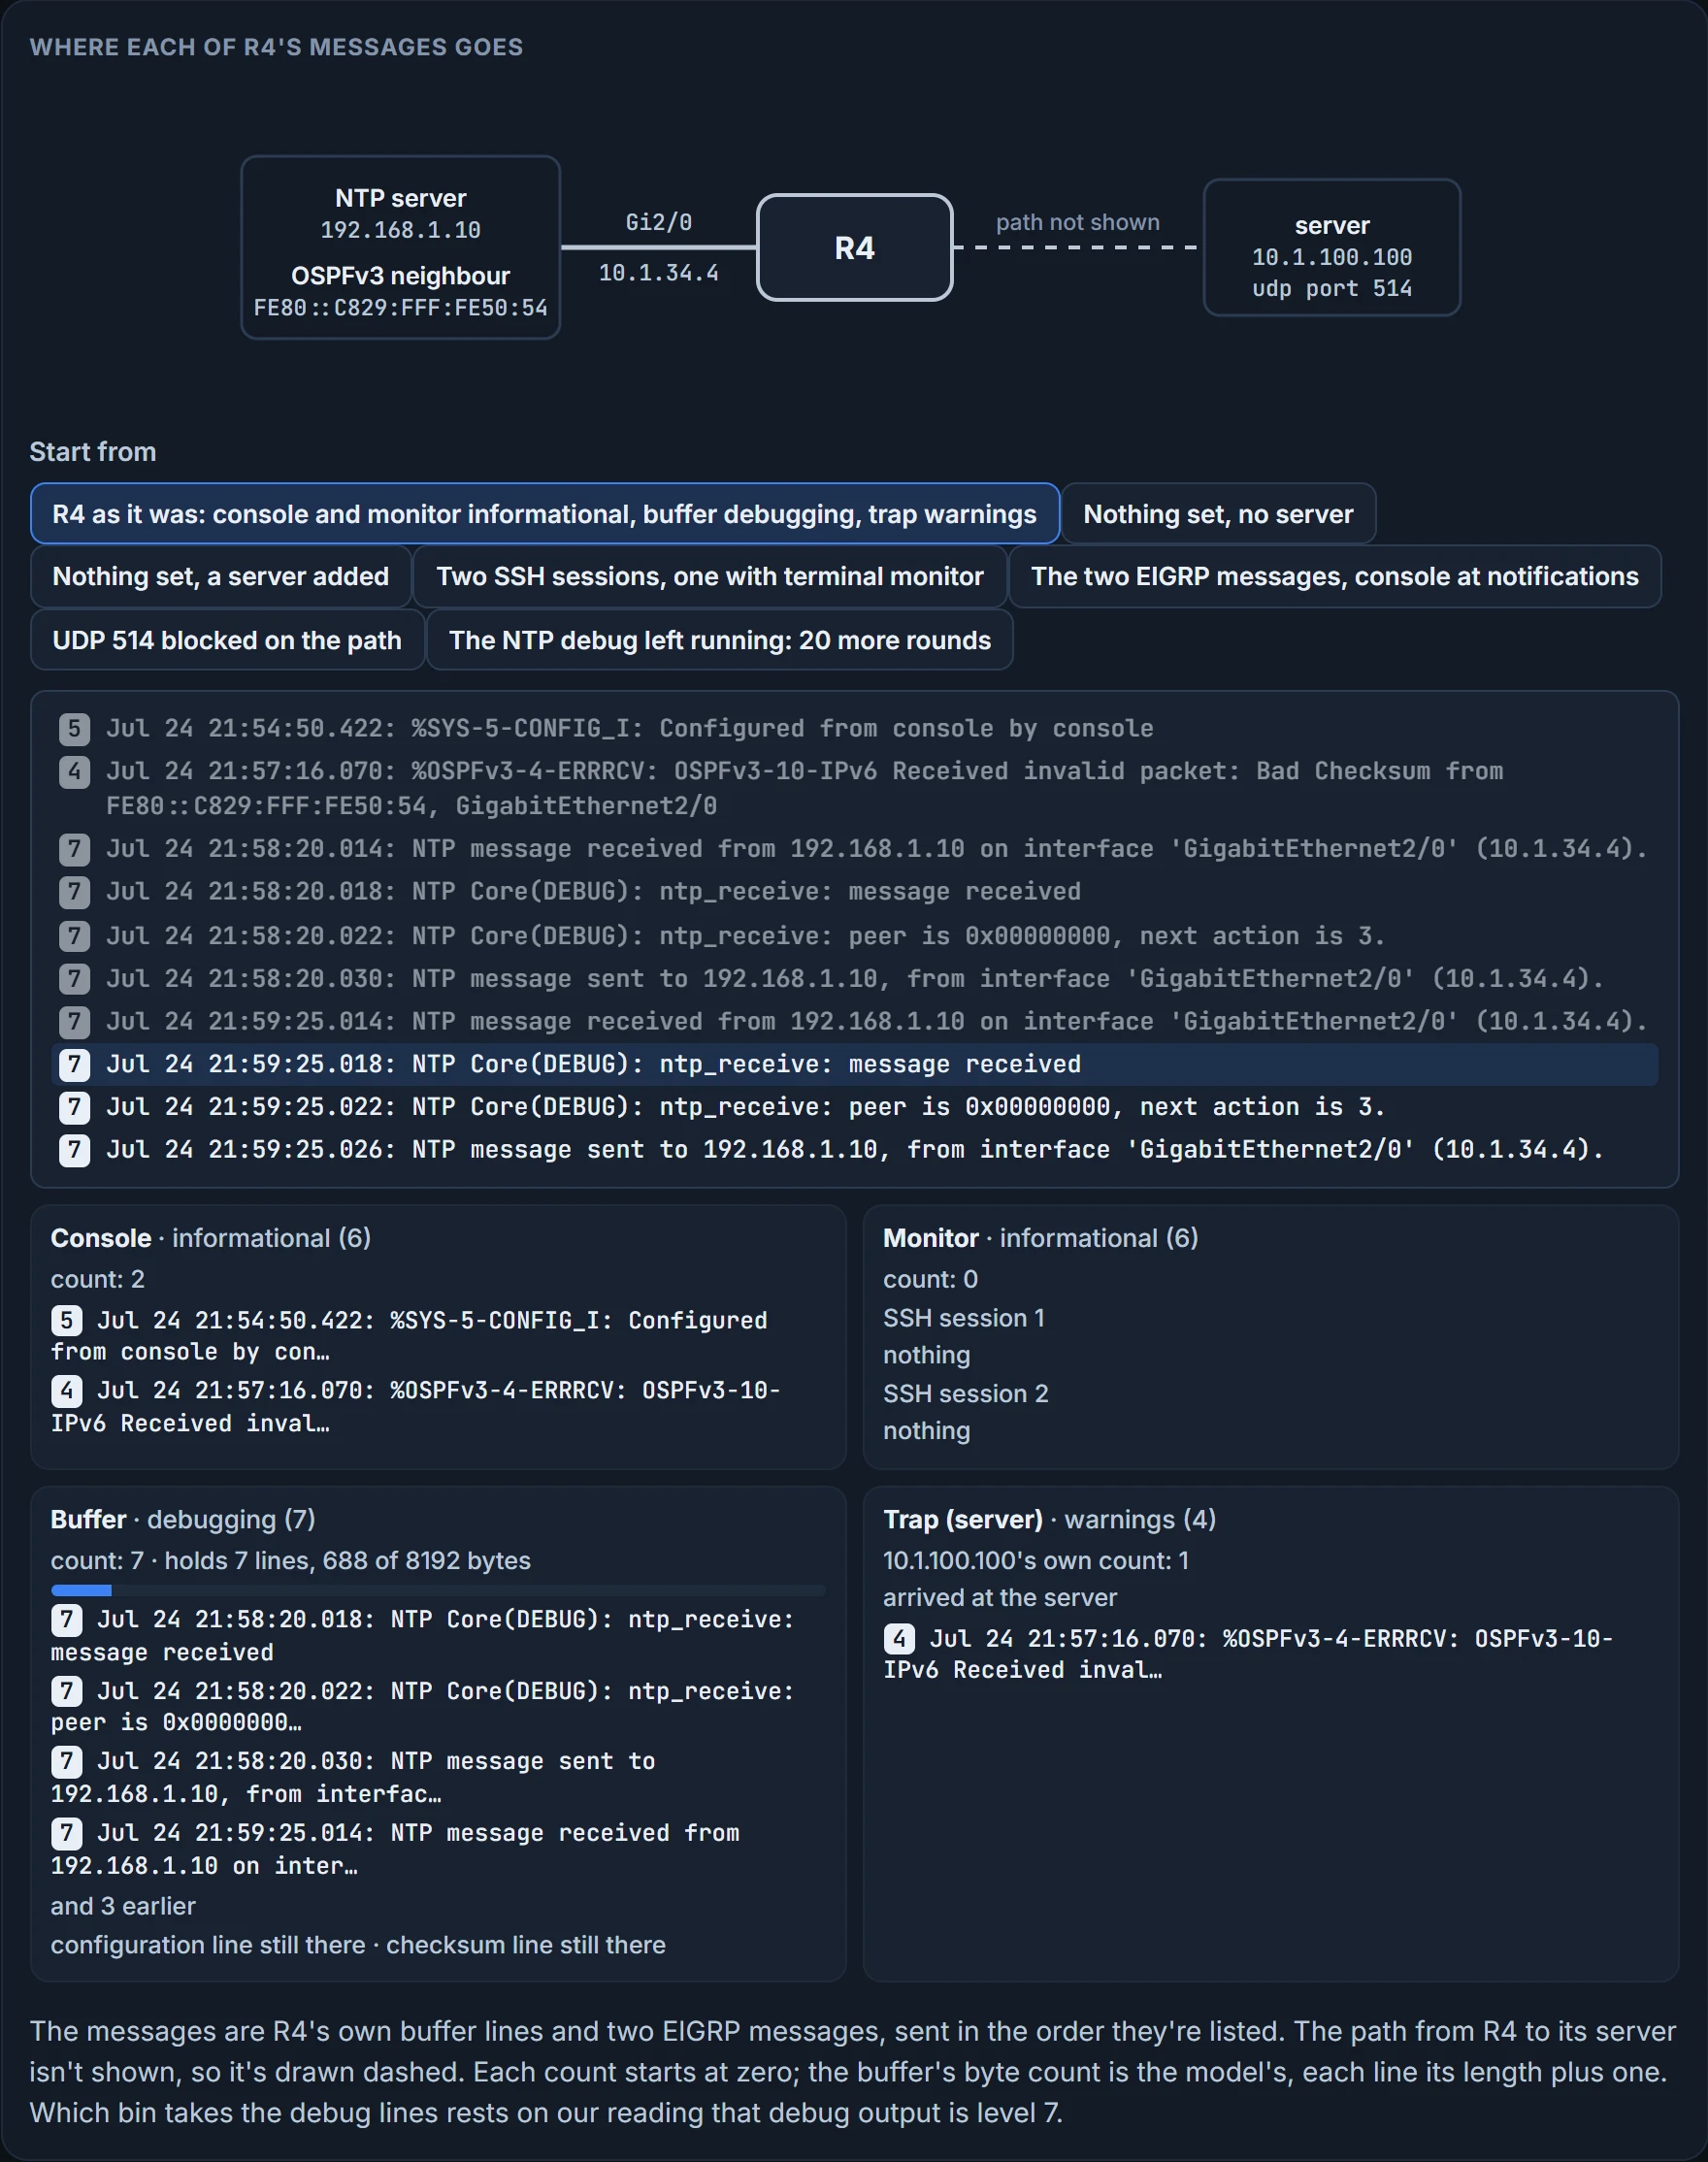
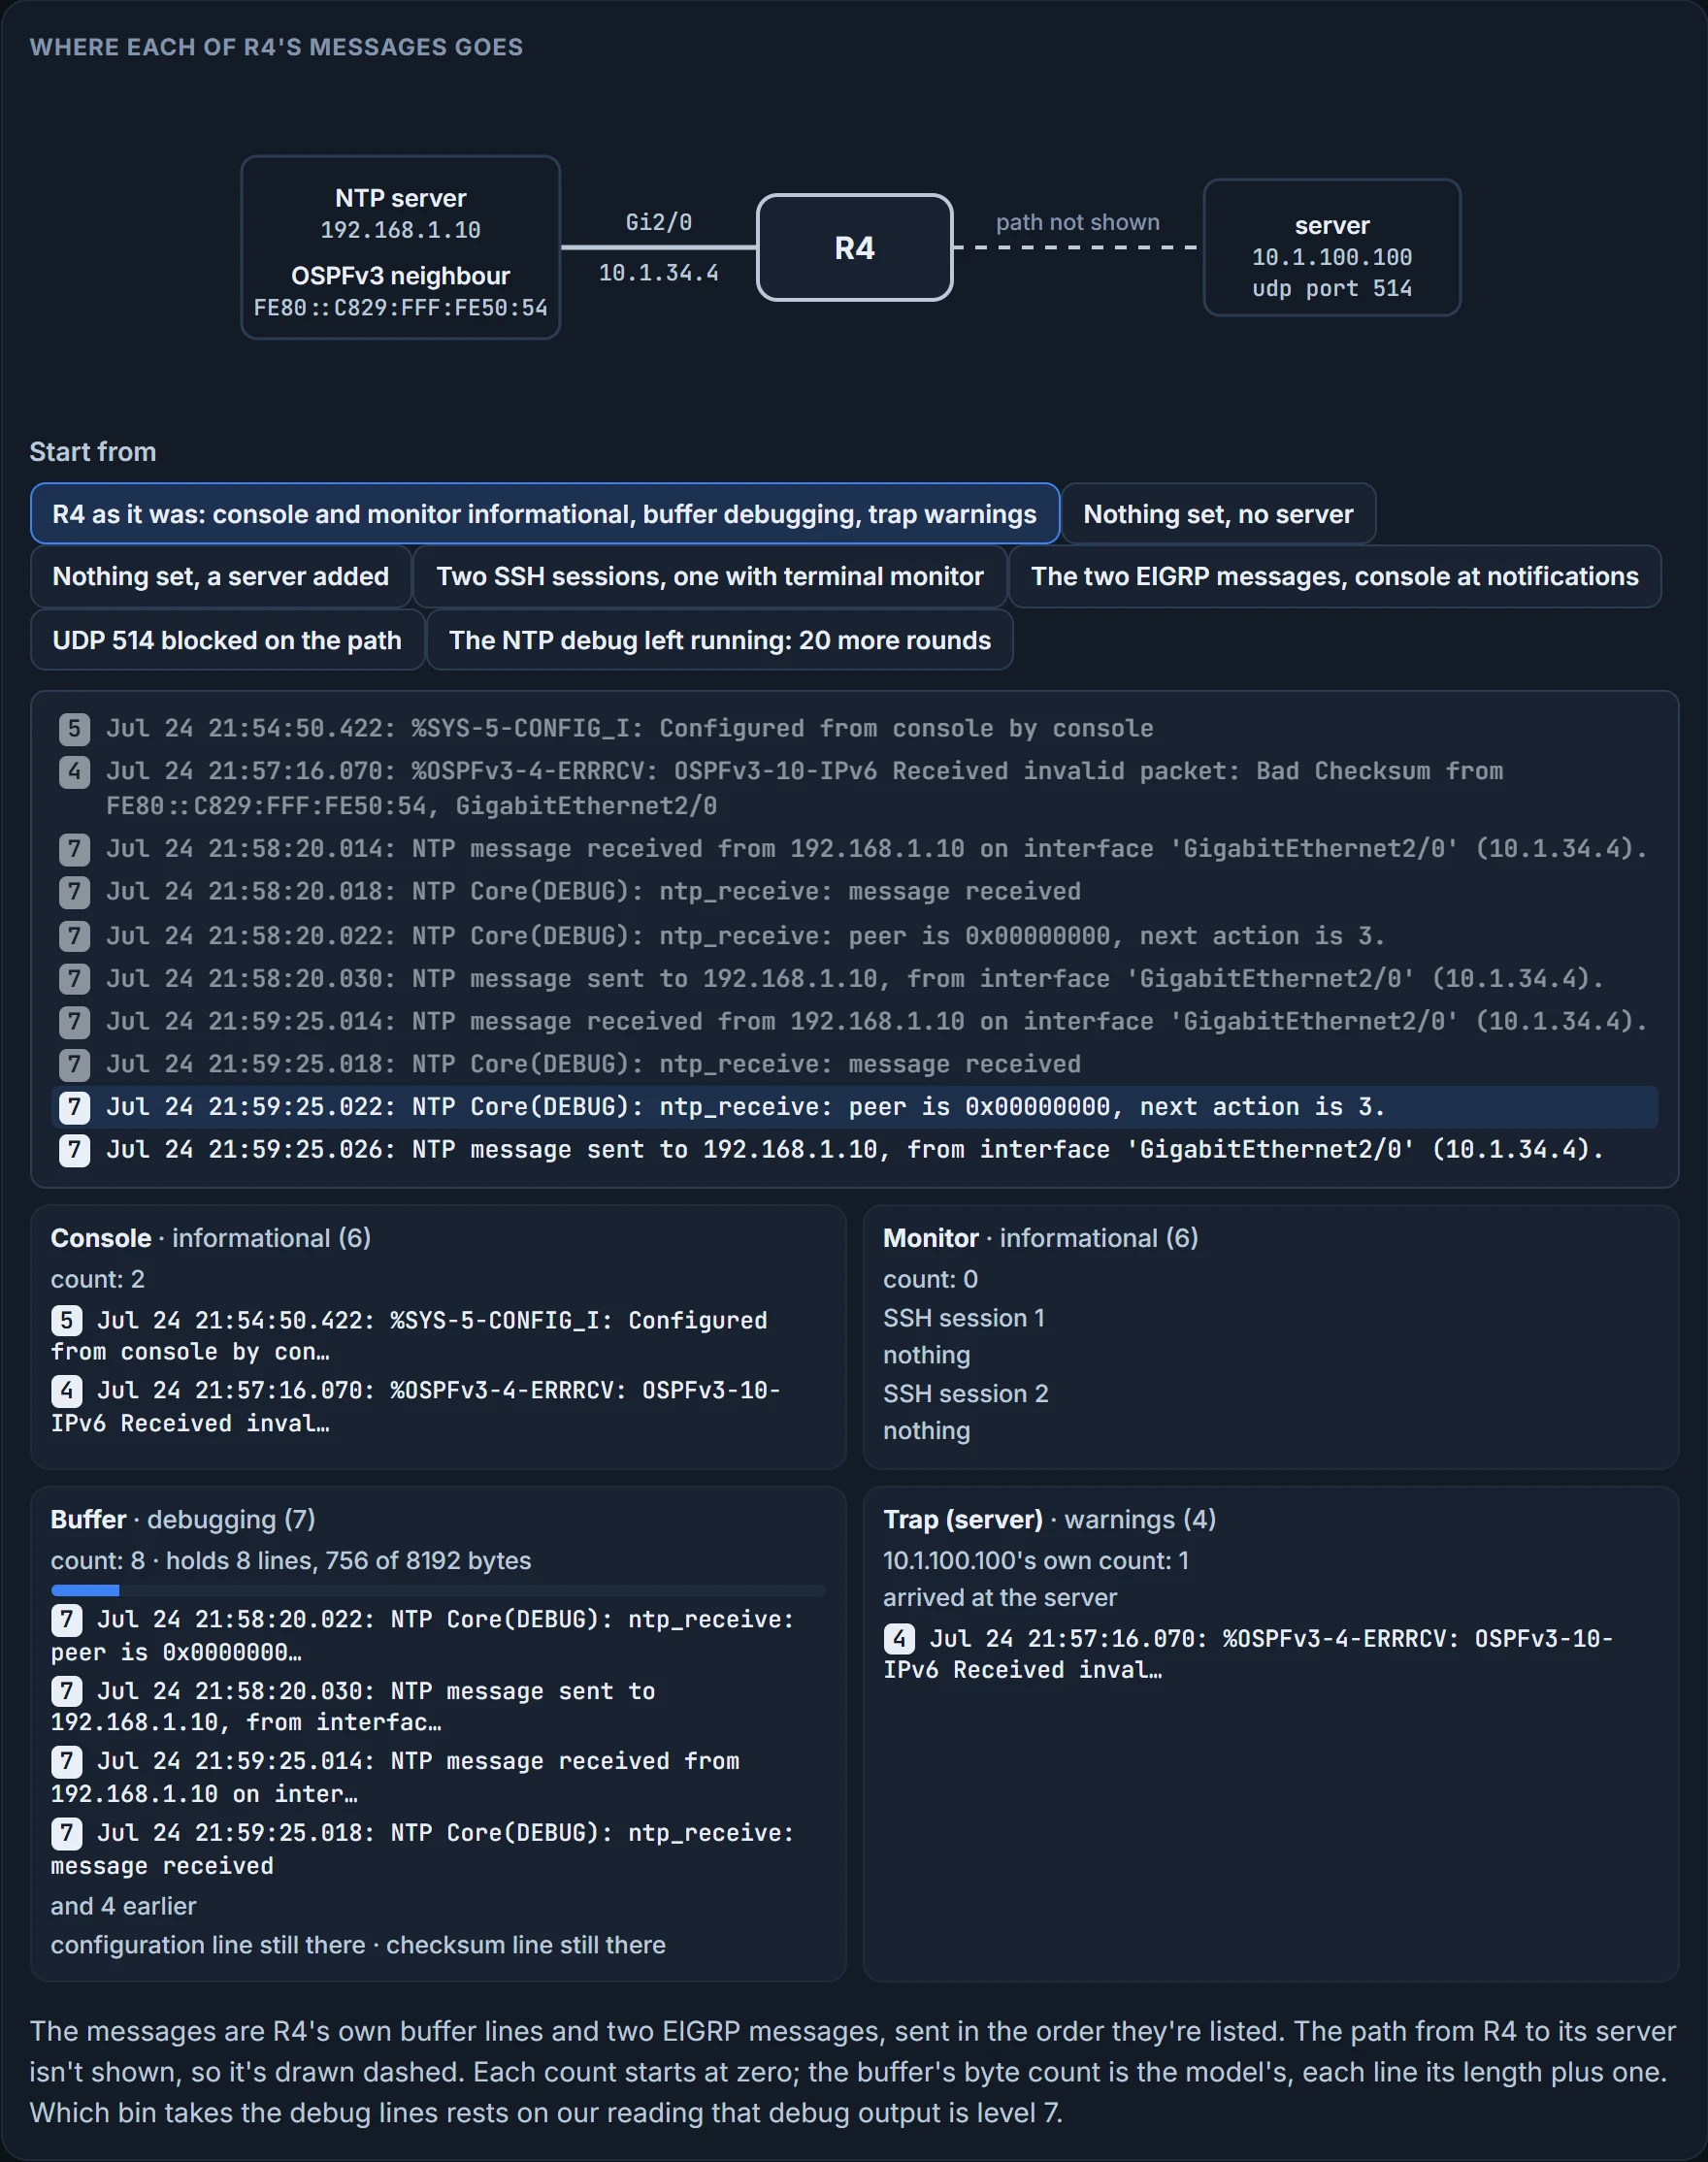
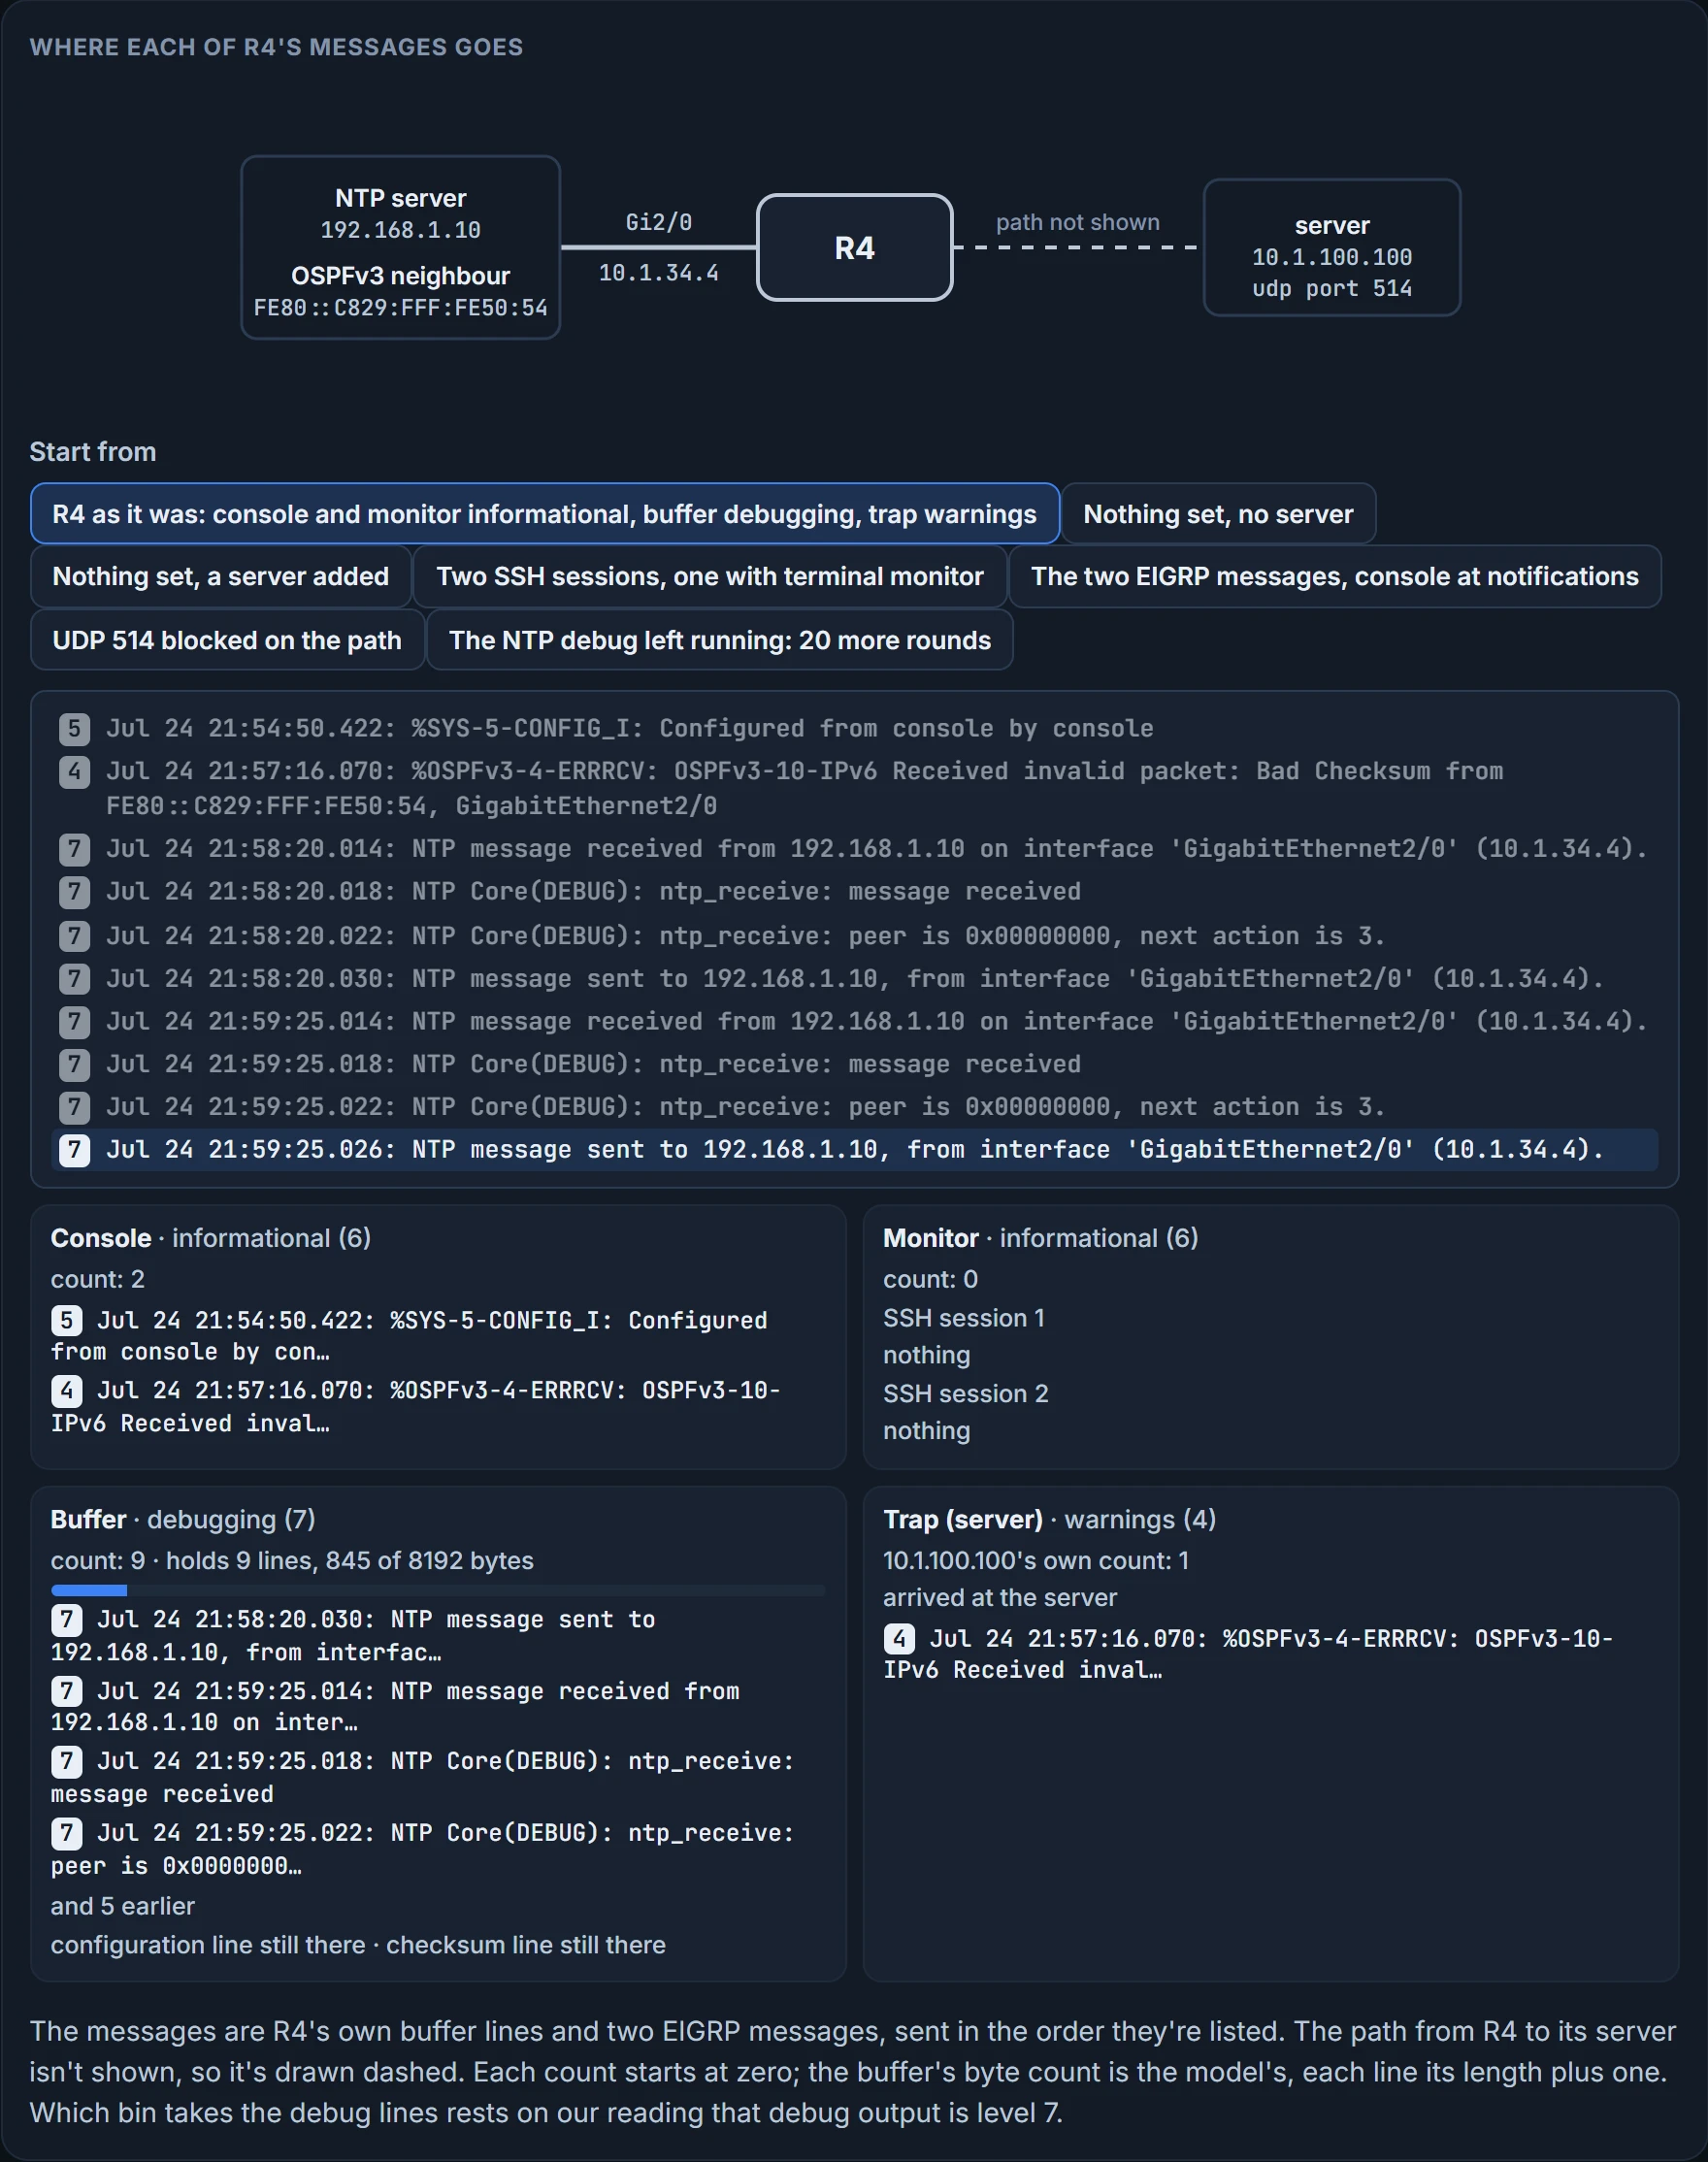
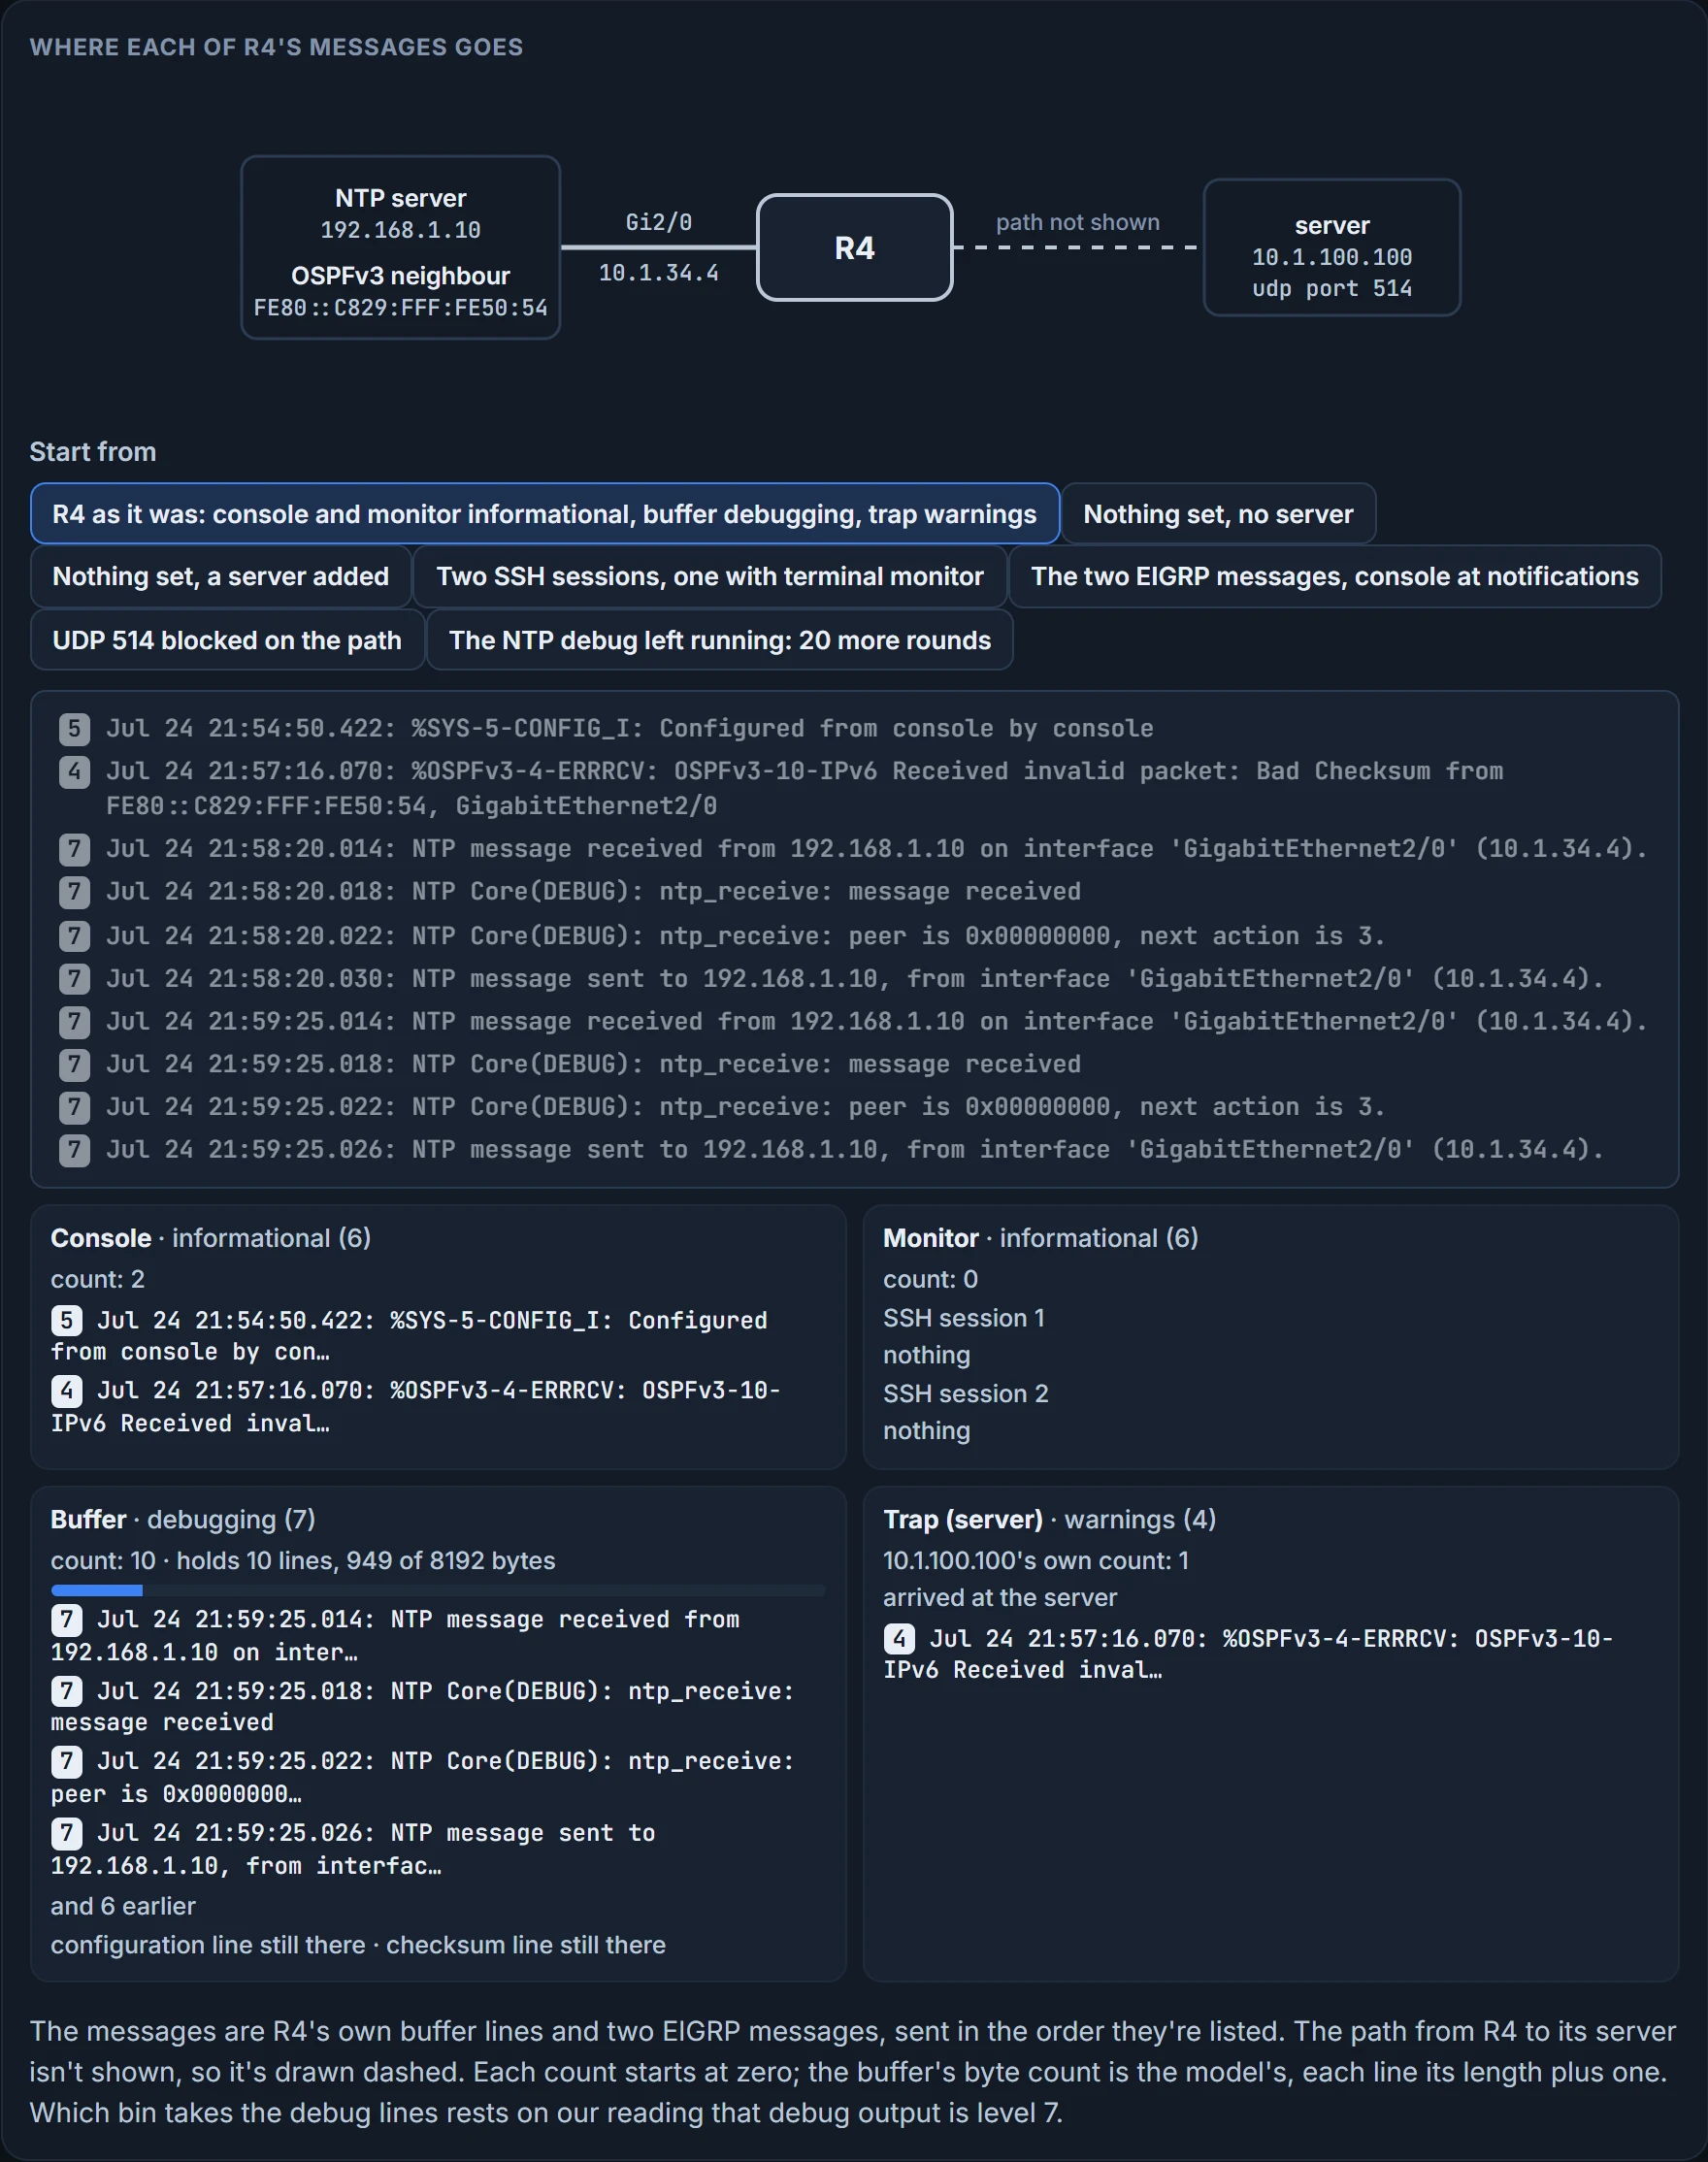
One. The OSPFv3 checksum line, severity 4. The configuration message is a 5 and the debug lines are 7s; at warnings, the server never sees them. The console, at informational, showed the 5 and the 4 and none of the debug. And the monitor destination logged nothing at all, 0 messages; the next section says why that's normal.
We haven't confirmed on a router which default a router gives its server with no logging trap line, or that debug output is logged at level 7.
Where a message survives the night
A message on the console is gone the moment it scrolls past. At 2 a.m. nobody was looking. The two destinations that keep anything are the buffer and the server, and each has its own way of losing it.
The buffer. By default it's 8192 bytes, and when it fills up, the older entries are overwritten. R4's shows it: "Log Buffer (8192 bytes)", with ten lines under it. Of those ten, the two with a severity digit are a minute or more older than the rest. Leave the NTP debug running and those two go first. That's the trap an earlier lesson pointed at, when a router's complaint could have been overwritten: lines that have to survive belong on a server. If you're using the buffer and losing messages, consider increasing its size with logging buffered size or sending the messages to a syslog server instead. The size's range is 4096 to 2147483647 bytes, with a warning not to make it so large the device runs short of memory for other tasks. Some platforms start at 102400 bytes rather than 8192. show logging prints the size in use, so read it there.
The server. Three things have to be true. The router has the correct server address, the server is reachable, and nothing stops the traffic: syslog uses UDP port 514, so make sure no ACL blocks traffic destined to UDP 514. A server is added with logging followed by its name or IP address, as in logging 125.1.1.100, and entering the command more than once builds a list of servers that all receive the messages. One trap level covers the whole list: logging trap limits what goes to the syslog servers. An IPv6 server is added the same way in principle.
Notice what the router can and can't tell you. R4's output prints a count beside every destination: "116 messages logged" for the console, 0 for the monitor, 175 for the buffer, "108 message lines logged" beside trap logging, and, under the one server, "2 message lines logged". Nothing in the output says what any of them counts. Our reading: each counts what that destination took since some starting point the output doesn't show. So the 2 under 10.1.100.100 is the count that belongs to that server, and it covers at least the one line you found above. And even a server's own count is only what the router handed over. Nothing comes back: the syslog protocol has no acknowledgment of delivery, and over UDP nothing else answers either. The server's own list is what proves receipt.
The terminal. You met this one in the management-access lesson. Connected over Telnet or SSH and seeing no syslog messages? The answer is that you haven't issued terminal monitor, and it lasts only for that session. That's why R4's monitor line reads "0 messages logged" with a level of informational: nobody with a remote session had asked for them. And the session needs both, the command and a level that admits the message: terminal monitor on a session where the monitor level is warnings still won't show you a notification.
One cost to keep in mind. Where messages go isn't free: the overhead ranks the console highest, a virtual terminal less, a syslog server less again, and the internal buffer least of all. It matters most for the loudest messages there are, which is the debug section.
The figure above has all three.
We haven't confirmed on a router the buffer's starting size, the command's IPv6 form, or why trap logging says 108 and the server 2.
What time it says
Having log and debug messages timestamped is critical for troubleshooting. The question was "what happened at 2 a.m.", and a message without a time can't answer it. If there's no timestamp on either log or debug messages, it's because the no service timestamps command has been executed. That's the exam's answer, too. Some platforms leave log messages unstamped by default. Again, configure it and stop caring.
The command is service timestamps [debug | log] [datetime | uptime]. Two separate settings, then: one for log messages, one for debug output. datetime puts in the date and time the message occurred, which is why you need an accurate calendar and time, and NTP is the way to keep it. uptime gives the time that has passed since the last reboot. datetime takes options: msec for milliseconds, localtime, and show-timezone for the zone's name. R4's stamps, "Jul 24 21:54:50.422", have the milliseconds and no zone name.
So a datetime stamp is a reading of the router's clock. Hold that.
Neither, almost certainly. The gap is exactly four hours, the zone's offset, to the minute. One of the two is reading the clock in UTC.
It's the log. Syslog messages are displayed in UTC by default, so if your system clock shows your local time zone and not UTC, the messages won't show the time that's on the clock. You might issue show clock and get 13:35:00, and a recent syslog message might display 17:35:00. Both are right. If you want the messages in the same time as show clock, add the localtime option:
R2(config)#service timestamps log datetime localtime
And now think twice before you type it. When you have devices in different time zones, it's best to keep your messages in UTC for troubleshooting. One clock for every router's messages means you can lay two routers' logs side by side without arithmetic. The price is the arithmetic on every ticket that arrives in local time, like "2 a.m.".
One more turn. A router's clock reads 20:10:43 EST, and lines arriving a few seconds later are stamped 01:10:50 the next day, five hours and one date later. The missing piece is the localtime option. But look at what kind of lines they are: debug output, a BGP scan, not log messages. The setting that stamps them is service timestamps debug, and the line above sets log only. Change the setting that stamps the lines you're reading.
Debug: the loudest message
debug commands are fantastic troubleshooting tools if you use them properly. Every Cisco IOS service and feature has debug commands that give real-time information about what's happening with it; show commands, by contrast, only give snapshots in time. A show answers "what is it now?". A debug answers "what is it doing, as it does it?"
The cost is that the router does the writing. Use a debug at the wrong time and you could overload the router's CPU and make it unstable and crash, and a physical reboot would be your only option at that point. Take NAT. show ip nat translations gives you a snapshot of the translations that have happened as of the moment you typed it; debug ip nat translations shows you, in real time, every translation as it occurs, and in a very busy environment the number of translations could overwhelm the router and crash it, so using that debug at the wrong time would be disastrous. Debug output is assigned high priority in the CPU process and can render the system unusable, so use debugs for specific problems, best during periods of lower traffic and fewer users.
So you pick the narrowest debug that answers the question. debug eigrp packet debugs every EIGRP packet; if you only want the hellos, debug eigrp packet hello is better. Use the best debug command to get exactly the information you need, no more, no less, so you don't jeopardize the router's performance.
You've seen a broad one already: debug eigrp packets on a router whose neighbors were in the wrong AS:
R1# debug eigrp packets
 (UPDATE, REQUEST, QUERY, REPLY, HELLO, UNKNOWN, PROBE, ACK,
SIAREPLY)
EIGRP Packet debugging is on
R1#
EIGRP: Sending HELLO on Gi0/0 - paklen 20
  AS 100, Flags 0x0:(NULL), Seq 0/0 interfaceQ 0/0 iidbQ un
R1#
EIGRP: Sending HELLO on Gi1/0 - paklen 20
  AS 100, Flags 0x0:(NULL), Seq 0/0 interfaceQ 0/0 iidbQ un
R1# u all
All possible debugging has been turned off
Three more hellos like these are left out of the middle, Gi0/0, Gi1/0, Gi0/0, and each hello's second line stops short, at "iidbQ un", in the listing we have. The list in brackets is what this debug covers: every packet type. Here it's two lines per hello, and only hellos going out: R1 isn't receiving any from its neighbors, whose AS doesn't match. On a busy router with working neighbors, every update, query and reply as well. And look at the last two lines: u all, which reads as undebug all abbreviated, turns every debug off at once. no debug all does the same thing, with the same answer. Know it before you start a debug, not after.
Continue the lesson
The whole lesson, with its drawings and its questions. 3 more sections after the ones above.