
NTP and Syslog
A log message carries a timestamp, a facility, a severity level from 0 to 7, a mnemonic and a description. The lower the level, the more severe: 0 is emergencies, 7 debugging. Logs from many devices only line up if their clocks agree, which is NTP's job: ntp server makes a device synchronise with a server and then serve time to others.
By Arif, founder of Daveth · Updated
The full 18 min walkthrough is in Daveth Pro (Network). See what the plan opens
What this page answers
What are the syslog severity levels?
0 emergencies, 1 alerts, 2 critical, 3 errors, 4 warnings, 5 notifications, 6 informational, 7 debugging. The lower the number, the more severe; a logging level setting lets through that level and every lower number. Read it in “What a log message says”
What is NTP (Network Time Protocol)?
The protocol that keeps devices' clocks in agreement, so their log timestamps line up. ntp server address makes a router a client and server: it synchronises with that server and can then serve time to others. Read it in “Making the clocks agree”
One fibre, two stories
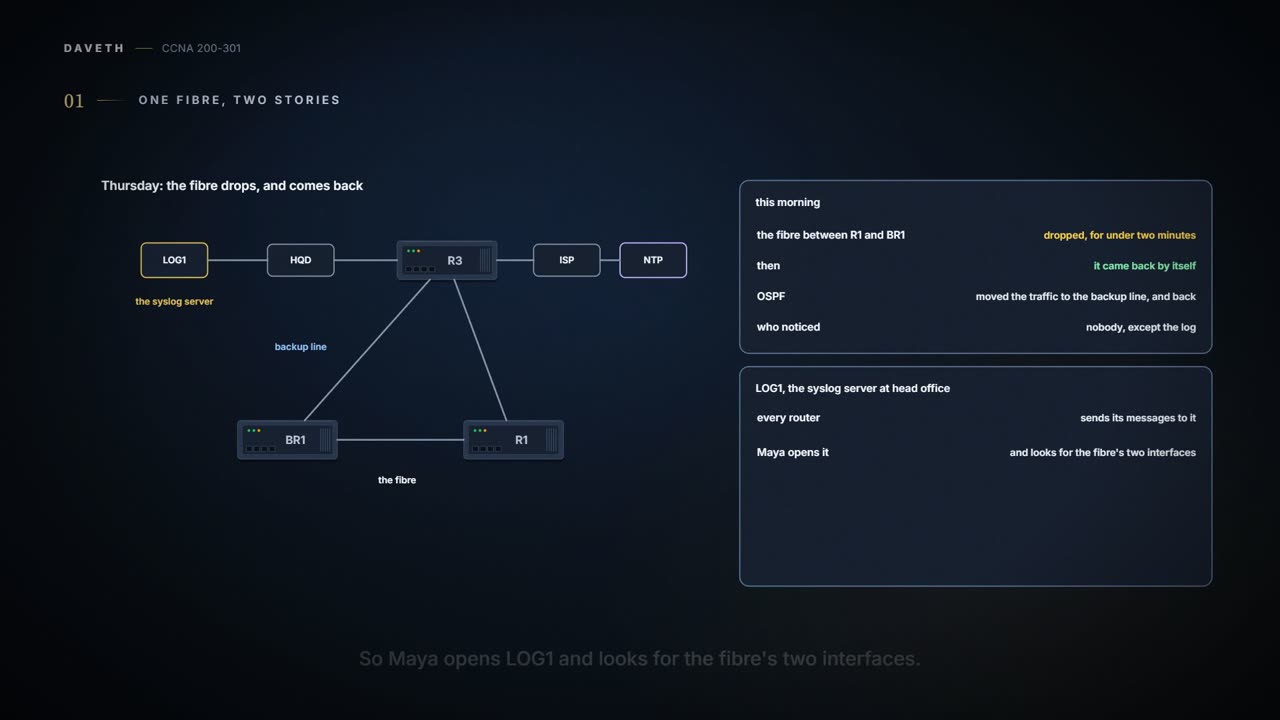
Thursday, month six. The fibre between R1 and BR1 dropped this morning, for under two minutes, and came back by itself. OSPF moved traffic to the backup line and back, and nobody noticed except the log. Maya opens LOG1, the syslog server at head office that every router sends its messages to, and looks for messages about the fibre's two interfaces. (On this page the date part of each timestamp is left out.)
| Timestamp | From | Message |
|---|---|---|
| 10:42:07.311 | R1 | %LINK-3-UPDOWN: Interface GigabitEthernet0/0/0, changed state to down |
| 10:43:52.104 | R1 | %LINK-3-UPDOWN: Interface GigabitEthernet0/0/0, changed state to up |
| 11:19:31.402 | BR1 | %LINK-3-UPDOWN: Interface GigabitEthernet0/0, changed state to down |
| 11:21:16.195 | BR1 | %LINK-3-UPDOWN: Interface GigabitEthernet0/0, changed state to up |
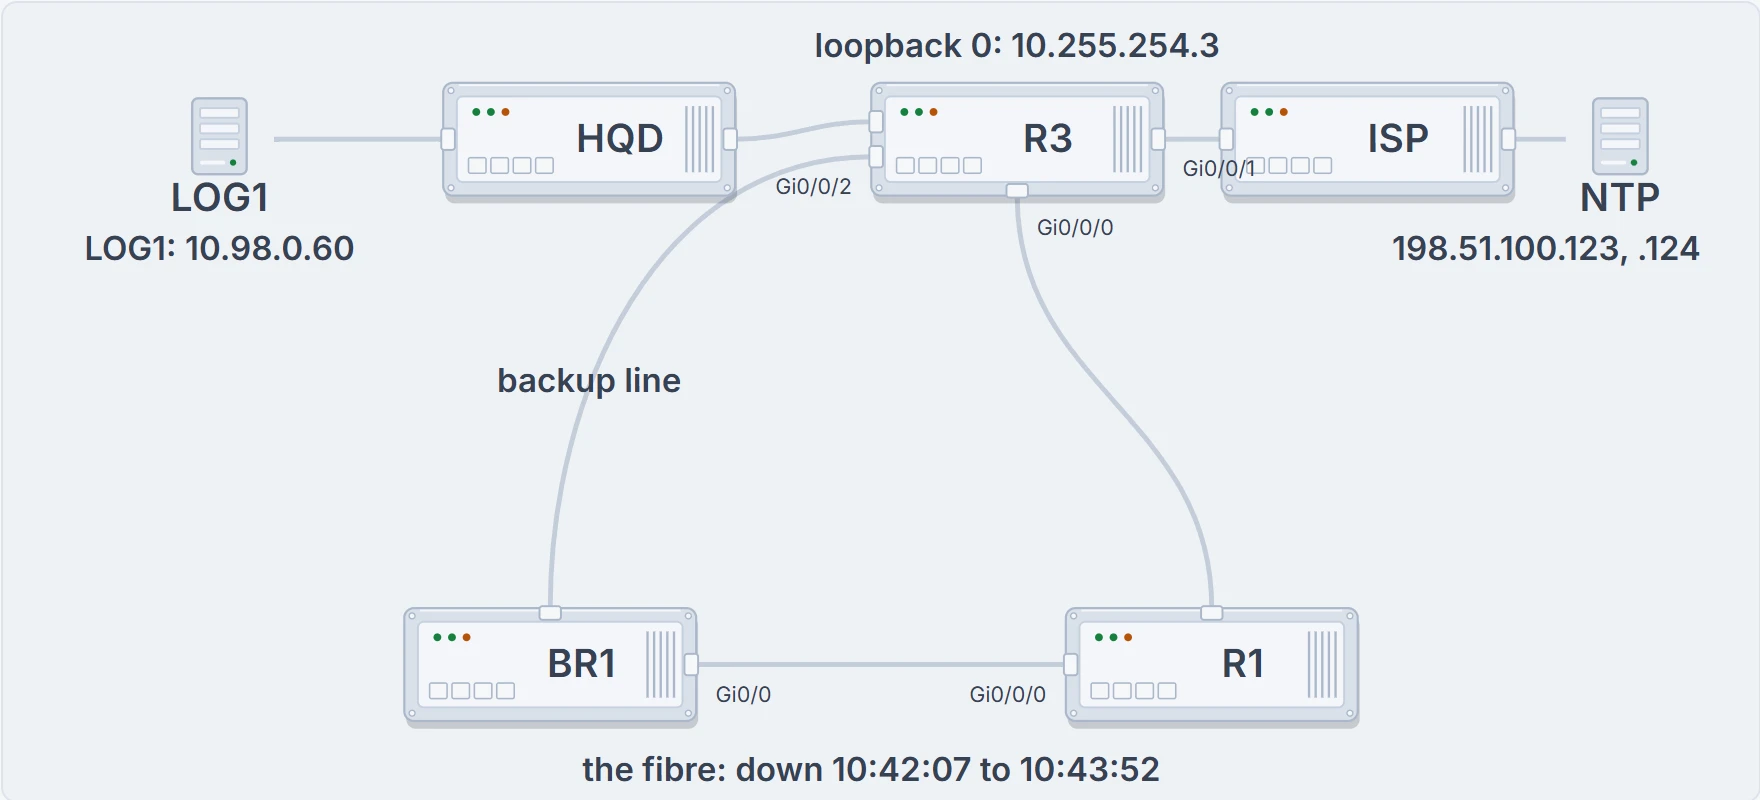
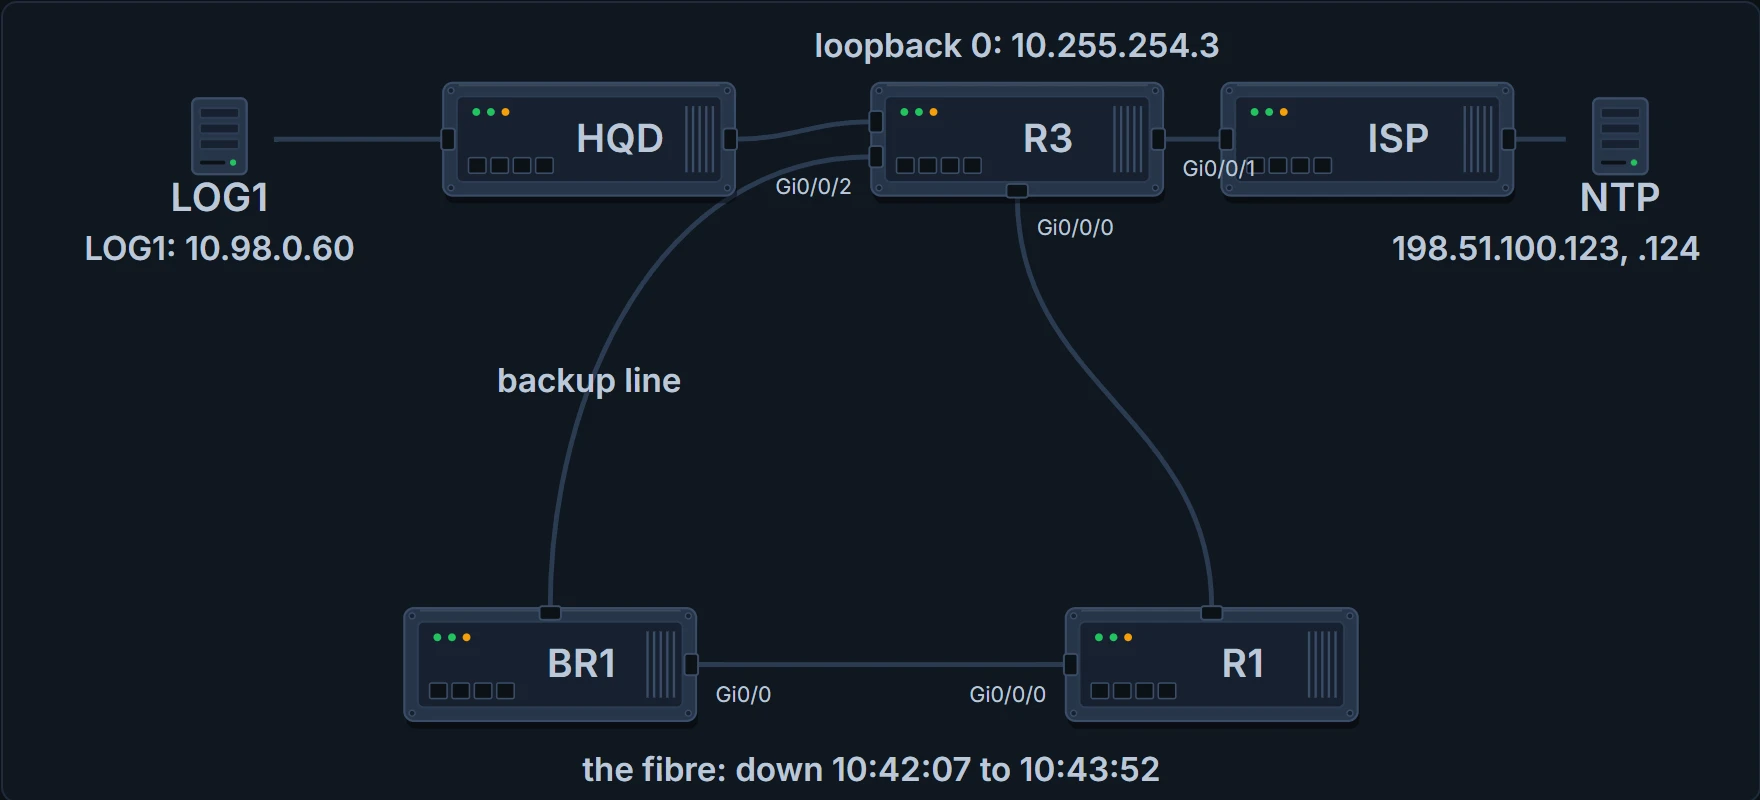
LOG1 collects every router's messages. R3 takes its time from the ISP's NTP servers, and serves it to the other routers from its loopback address. The fibre is the link that dropped.
What a log message says
When something happens that a router or switch thinks is worth telling people about, it creates a log message. Take one from R1's side:
- 10:42:07.311 is the timestamp: when R1's clock said it happened (the full timestamp also has the date).
- %LINK is the facility: the part of the device that generated the message.
- 3 is the severity level.
- UPDOWN is the mnemonic: a short code name for the event.
- Interface GigabitEthernet0/0/0, changed state to down is the description, for humans.
The device decides most of the content. You can switch the timestamp off (no service timestamps; it's on by default) and switch sequence numbers on (service sequence-numbers; off by default): the same kind of message would then start 000011: instead of a time. A log message is evidence of what the device reported, not proof of why: LINK-3-UPDOWN says the interface went down, not whether a cable, a shutdown or a power cut did it.
Every message has one of eight severity levels. The lower the number, the more severe the event. Levels 0 and 1 mean a serious, immediate problem; 2 to 4 are events that affect the device, less urgently (an interface failing shows as 3); 5 and 6 are normal notifications; 7 is for debug output someone asked for. Commands accept the number or the keyword, and show commands print the keyword. (You'll also see the levels written as Emergency, Alert, Critical, Error, Warning, Notification, Informational and Debug.)
| Level | Keyword | Meaning |
|---|---|---|
| 0 | emergencies | System unusable |
| 1 | alerts | Immediate action required |
| 2 | critical | Critical event (highest of 3) |
| 3 | errors | Error event (middle of 3) |
| 4 | warnings | Warning event (lowest of 3) |
| 5 | notifications | Normal, more important |
| 6 | informational | Normal, less important |
| 7 | debugging | Requested by a user's debug command |
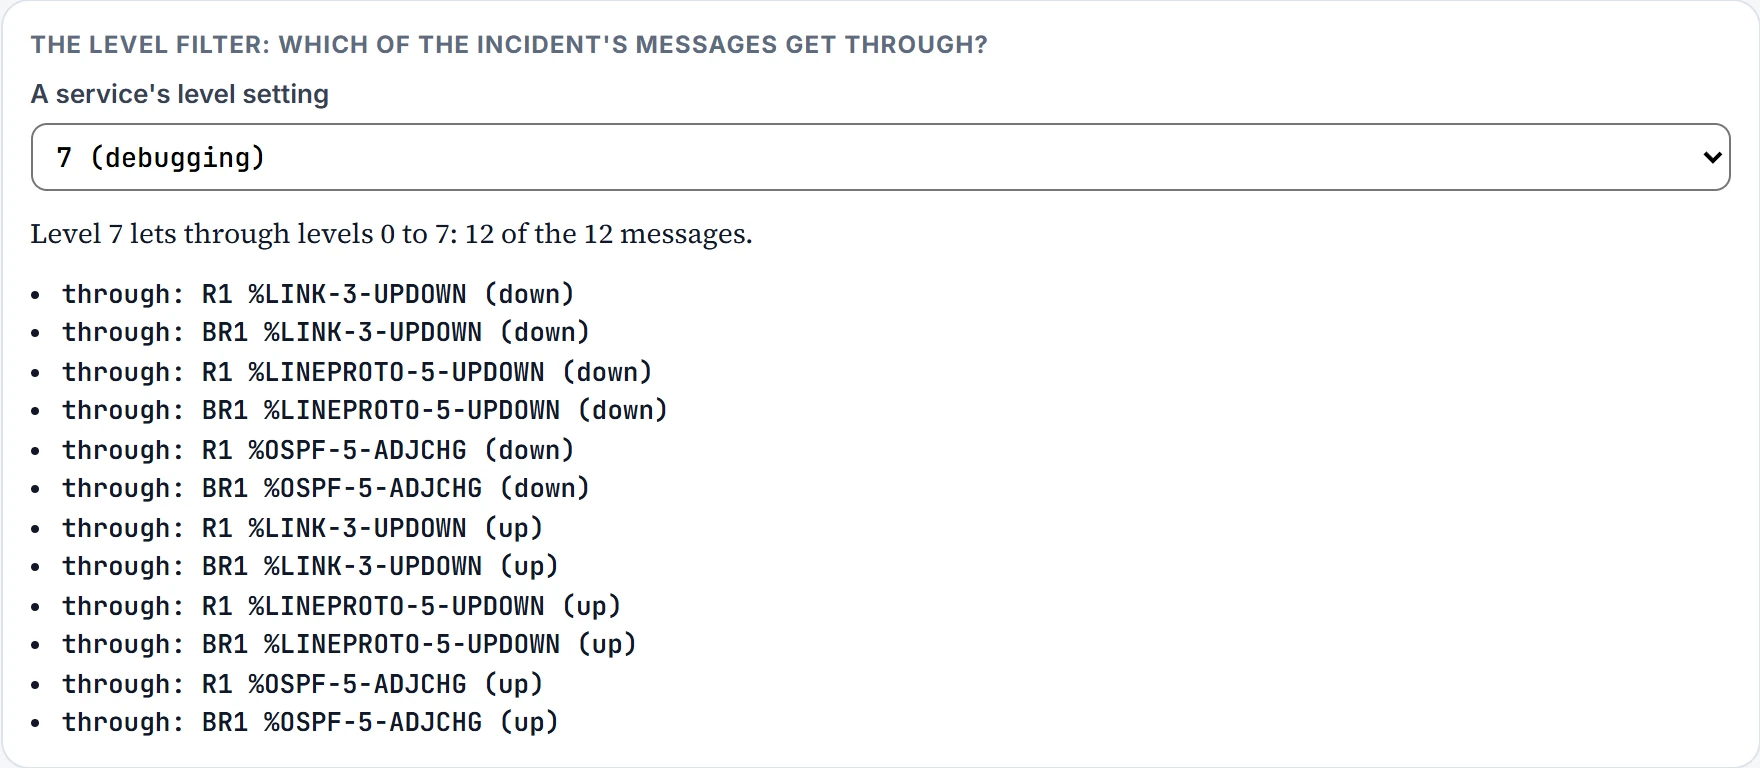
Each place a message can go has its own level setting, and a setting includes that level and every more severe one: logging console 4 sends levels 0 to 4 to the console, and logging trap 4 does the same for the syslog server. Here is the setting at level 7 on the fibre's twelve messages from this morning, six as it went down and six as it came back:
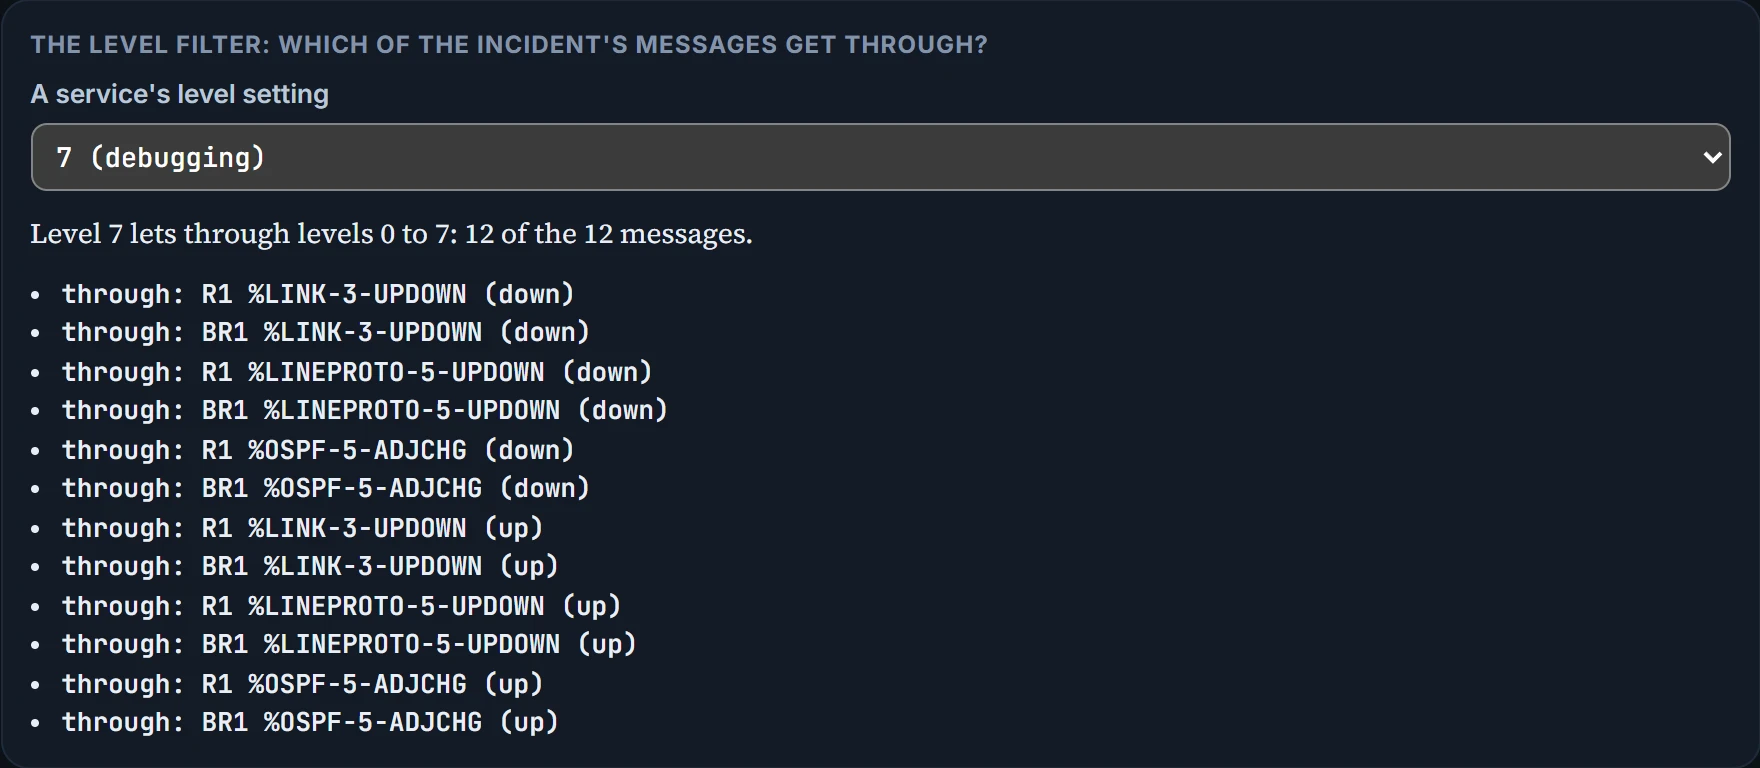
There are four places messages can go, and each is independent: a message on the console doesn't prove the syslog server got it. By default the console gets messages of every level. Telnet and SSH users need two things: logging monitor on the device (on by default) and the terminal monitor command in their own session, which says this session wants log messages. To keep messages for later, logging buffered stores them in RAM, where show logging lists them (clear logging empties it). And logging host sends them to a syslog server, using the syslog protocol over UDP, so every device's messages end up in one place, where people usually browse them through a web interface; logging trap sets the level for that. The no form of each command, such as no logging console, turns that service off.
| Service | To enable it | To set its level |
|---|---|---|
| Console | logging console (on by default) | logging console level-name | level-number |
| Monitor (Telnet and SSH users) | logging monitor, plus terminal monitor in the user's session | logging monitor level-name | level-number |
| Buffered (RAM, read with show logging) | logging buffered | logging buffered level-name | level-number |
| Syslog server | logging host address | hostname | logging trap level-name | level-number |
Every router here uses logging host 10.98.0.60 and logging trap warnings, and R1 and BR1 also buffer at warnings:
BR1# show logging
! (the first lines are left out)
    Console logging: level debugging,
! (the Monitor logging line, and the message counts on every line, are left out)
    Buffer logging: level warnings,
! (the rest of the settings are left out)
    Trap logging: level warnings,
       Logging to 10.98.0.60 (udp port 514, audit disabled,
           link up),
! (the counters are left out)
Log Buffer (8192 bytes):
! (older messages, and the date in each timestamp, are left out)
11:19:31.402: %LINK-3-UPDOWN: Interface GigabitEthernet0/0, changed state to down
11:21:16.195: %LINK-3-UPDOWN: Interface GigabitEthernet0/0, changed state to up
BR1#
show logging lists each service with its level by keyword, not number, then the buffered messages (with a count of 0 and nothing listed if nothing has been buffered yet). What this proves: BR1 sends levels 0 to 4 to 10.98.0.60 and keeps the same in RAM, and it reported the fibre down and up. What it doesn't: that LOG1 received anything, or that BR1's timestamps are right.
Level 7 has a special job: messages a debug command asks for, such as debug ip ospf hello. A debug keeps watching until someone turns it off with no debug and the same options, even after the user logs out. A console at level 7 shows debug output straight away; an SSH user sees it only after terminal monitor. Every debug costs CPU, more for each user receiving the output (show process cpu shows the load), so use them carefully on production devices; some sites keep debug messages off the console for that reason. With levels of warnings for the buffer and the server, debug messages go to neither.
By BR1's clock, the fibre broke at 11:19, well into what Maya calls lunch. By everyone else's, it broke at 10:42. Maya wants it on record which clock is on trial.
Making the clocks agree
Every router and switch has a time-of-day clock, and it stamps its own messages with it. If the clocks disagree, messages from one event look unrelated, which is exactly what LOG1 shows. Maya checks BR1 at 10:50:12 by R1's clock:
BR1# show clock
11:27:36.297 UTC
! (the day and date are left out)
BR1# show running-config | include ntp
BR1#
BR1's clock is 37 minutes 24 seconds ahead of R1's, and it has no ntp line at all: when the branch was built, NTP was left off the list. R1 and R3 have used NTP for months. What this proves: BR1 disagrees with the routers that follow NTP, by 37 minutes 24 seconds. What it doesn't: that R1's clock is right in itself. That rests on NTP's chain back to the ISP's servers.
The branch has now been left out of NAT and NTP in the same week. Jo is starting a list.
The Network Time Protocol (NTP) synchronizes clocks: devices keep exchanging NTP messages carrying timestamps, and the client keeps adjusting its clock to match its server's. NTP works best when the clock starts close to the right time. Three commands set it up. clock timezone name offset (configuration mode) gives a name you choose, shown in show commands, and the hours from UTC, Coordinated Universal Time, the world's reference time; clock summer-time name recurring adds the daylight saving hour each year. Then the EXEC command clock set hh:mm:ss day month year, with a 24-hour time, sets the clock, read as local time, which is why the two configuration commands come first. The company's routers simply keep UTC, so Ravi needs only clock set to put BR1 roughly right before turning NTP on.
Continue the lesson
The whole lesson, with its drawings and its questions. The rest of this section and 1 more after it.