
Linux performance triage: load average, the USE method, memory accounting, PSI and kernel logs
Linux load counts processes in uninterruptible sleep, the D state, waiting inside the kernel for a disk or network share, as well as those using a CPU. A stuck network share can push load to 58 on an idle machine. For memory, the number that matters is available, not free.
What this page answers
Why is the load average high but the CPU idle?
Load also counts processes in uninterruptible sleep, the D state, waiting for a disk or network file system. In the lesson's example, dozens of data loader processes are stuck reading from a share that stopped responding. Read it in “Load 58, CPUs mostly idle”
Why does Linux show almost no free memory?
Linux uses spare RAM to cache files and gives it back the moment a program needs it, so free is nearly always small on a healthy machine. The column that matters is available: how much programs could get right now. Read it in “Memory: free isn't the number”
Load 58, CPUs mostly idle
Users report that the training server is “really slow”. You log in, and the classic first command looks alarming. Then the next one doesn't match:
$ uptime
 14:02:11 up 12 days,  3:41,  2 users,  load average: 58.12, 51.40, 30.08
$ nproc
32
$ top -bn1 | grep "^%Cpu"
%Cpu(s):  4.1 us,  1.9 sy,  0.0 ni, 92.6 id,  1.4 wa,  0.0 hi,  0.0 si,  0.0 st
Outputs on this page are realistic examples. Commands, fields and the load-average formula are real.
A load of 58 on 32 cores sounds like the CPUs are drowning. But top says they're more than 90% idle. What's really happening?
- Too many busy processes fighting for CPU
- Many processes stuck waiting for disk or network
- top and uptime are showing stale data
Answer. On Linux, “load” doesn't only count processes using or waiting for a CPU. It also counts processes in uninterruptible sleep, the D state: waiting inside the kernel for a disk or a network file system to answer. Here, dozens of data loader processes are stuck reading from a network share that stopped responding:
$ ps -eo stat | grep -c '^D'
56
$ ps -eo pid,stat,wchan:22,cmd | awk '$2 ~ /^D/' | head -2
  48311 D    rpc_wait_bit_killable  python train.py
  48312 D    rpc_wait_bit_killable  python train.py
56 stuck processes, plus a couple of running ones, make a load of about 58, with the CPUs having little to do. Notice that top's wa (iowait) figure is tiny too: processes waiting on a network share often aren't counted as iowait at all, which is one more reason to look for the D state directly. The fix is the file server, not the CPUs: adding cores would change nothing. (The same D state and NFS wait appeared in Down the Fleet, there as the cause of a hung training job.) The lesson: load is a symptom, not a diagnosis.
What load really counts
Think of the CPUs as checkout lanes in a shop. Load is the number of customers either being served or waiting in a queue, plus, on Linux, customers standing aside waiting for a price check from the back room. The first two are about CPU. The last group is about disks and networks, and that's what makes Linux load confusing.
The top bar is how busy the cores are: blue for real work, grey for idle. The bottom bar is the load, compared with the number of cores: blue for processes running, copper for processes stuck waiting, and pink for anything beyond what the cores could serve at once.
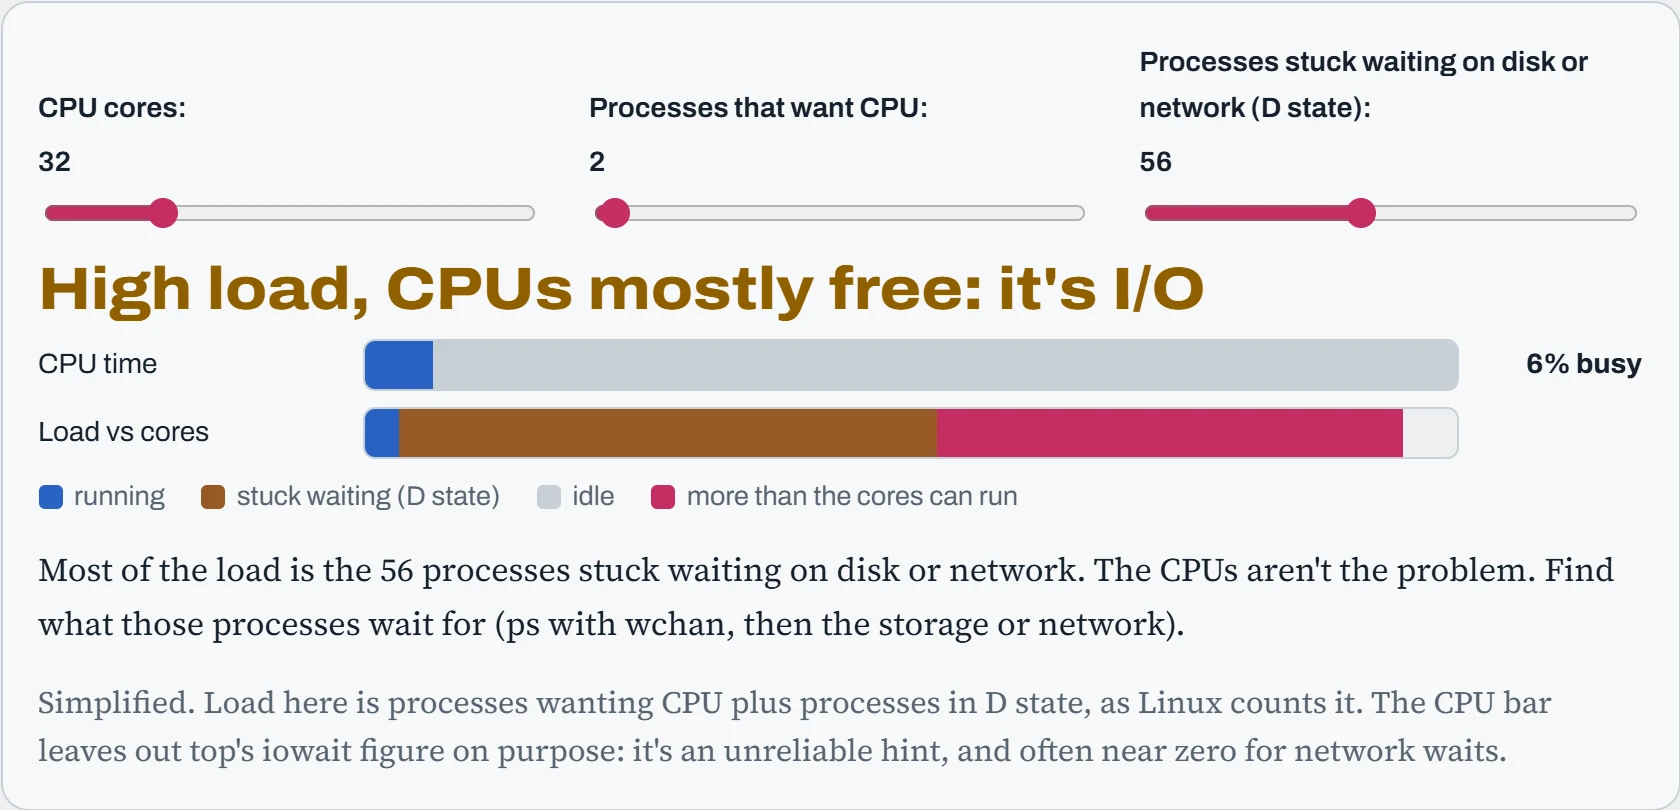
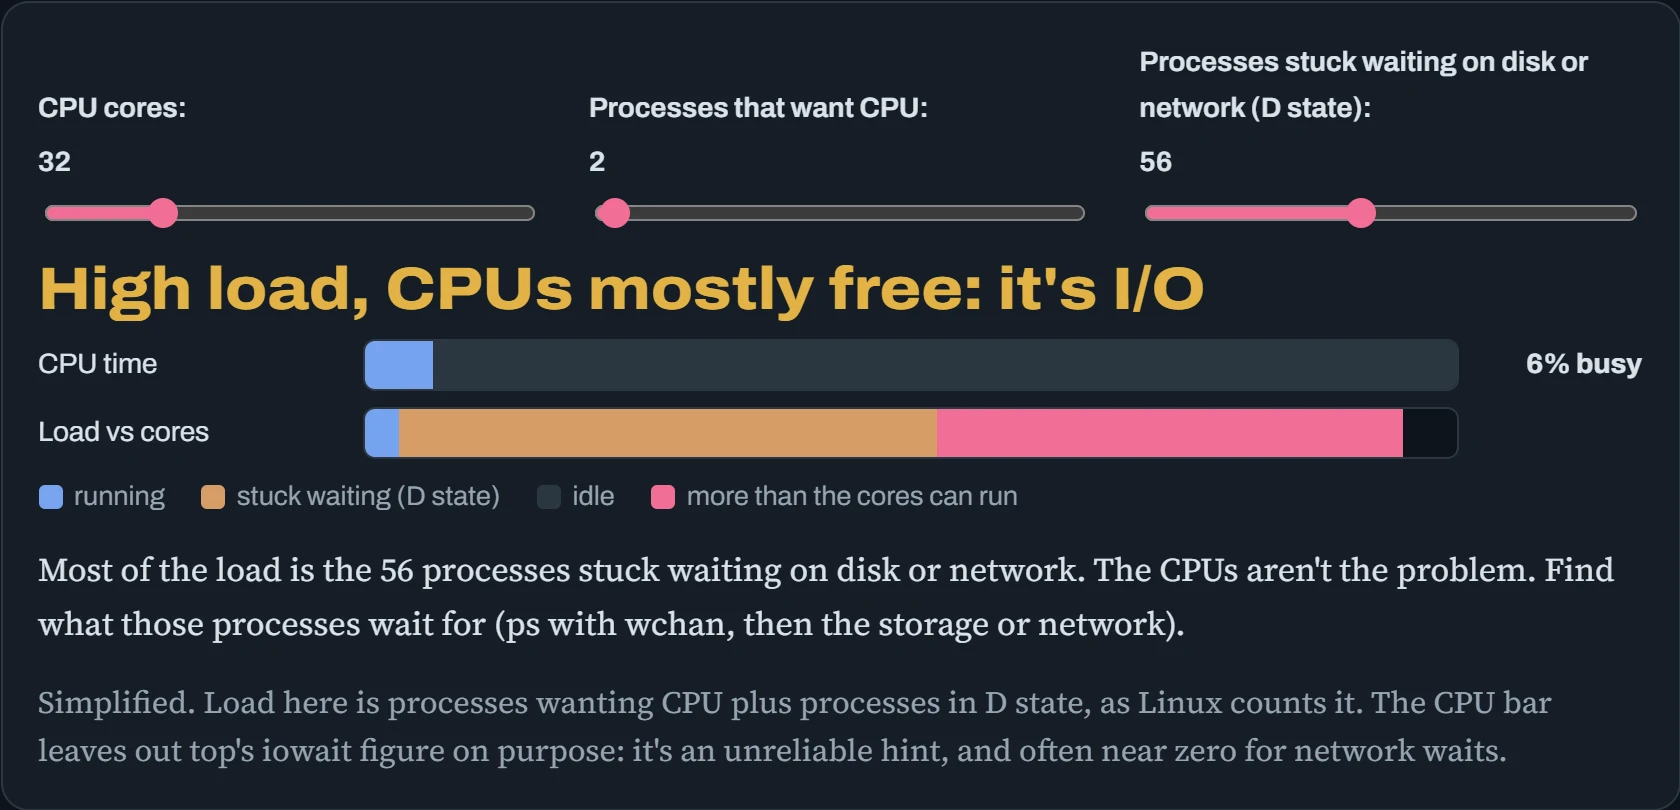
The same load of 58 can mean two opposite things. With 58 processes wanting CPU on 32 cores, the CPUs are overloaded, and more cores or fewer processes would help. With 2 wanting CPU and 56 stuck in D state, the CPUs are mostly idle, and the problem is somewhere the stuck processes are waiting. So never read load alone. Compare it with the core count, and then split it: vmstat 1 shows both halves directly, as the r column (running or wanting CPU) and the b column (blocked in D state).
A method instead of guessing
Under pressure, people guess, and change things at random. A better habit is the USE method, from Brendan Gregg: for every resource (CPU, memory, disk, network, GPU), check three things. Utilization: how busy is it? Saturation: is work queuing up, waiting for it? Errors: is it reporting failures? A resource can be 100% busy and fine, or 40% busy with a long queue and in trouble.
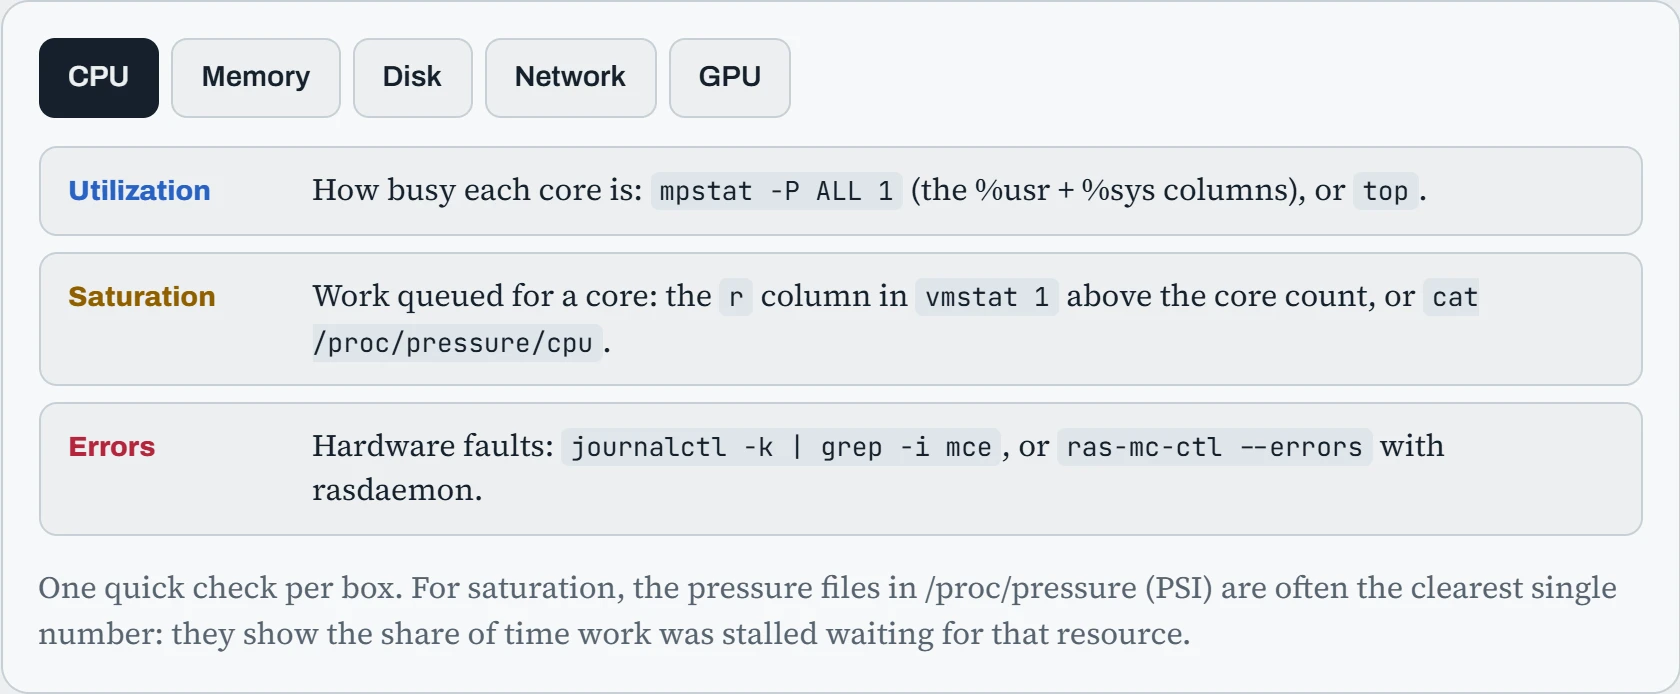
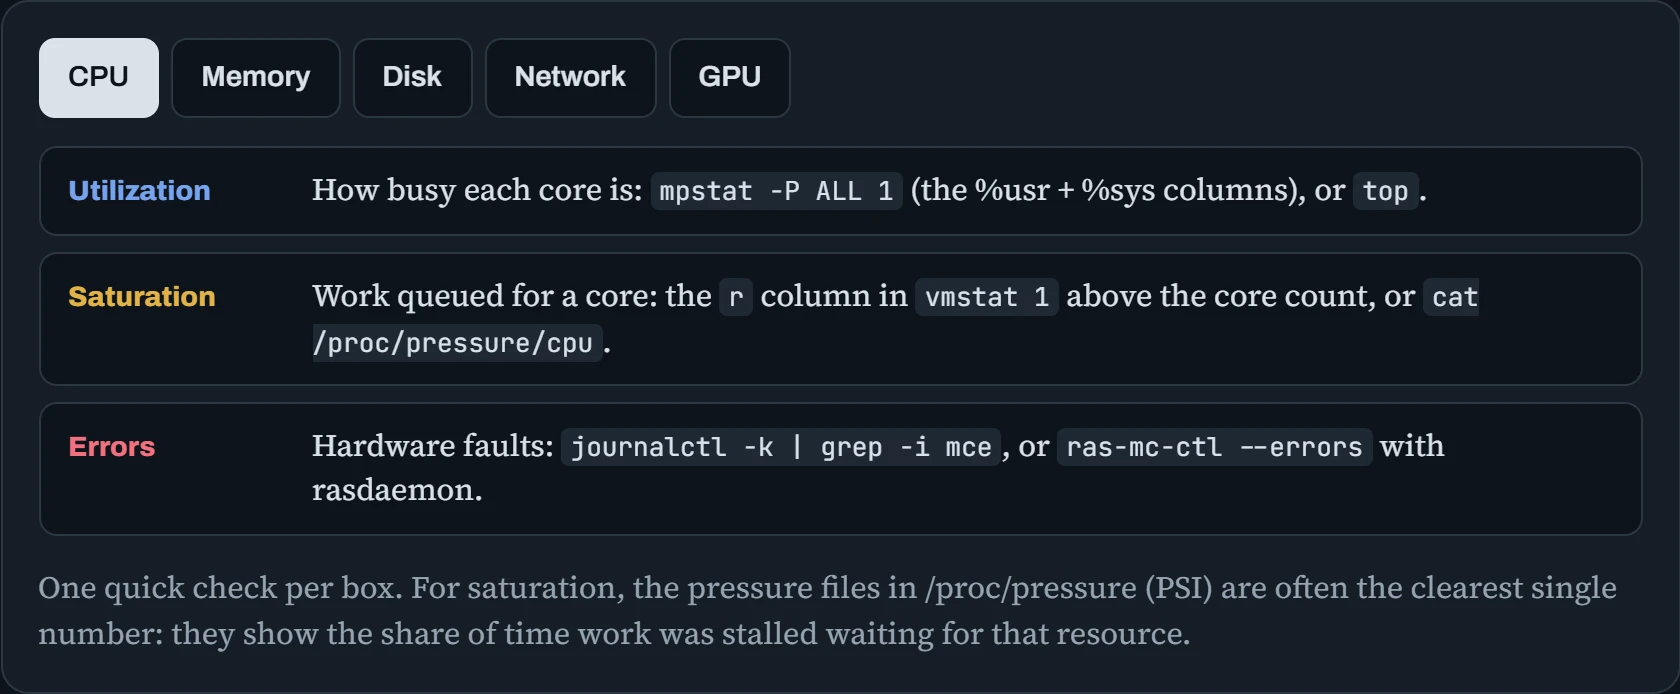
Fifteen checks sound like a lot, but each takes seconds, and together they rule out most of the machine quickly. When one box lights up, you know which resource to dig into. The second half of the method is about layers. A problem in an AI job can live at any level, from the hardware up to your code. Testing from the bottom up stops you from debugging Python when a GPU has fallen off the bus:
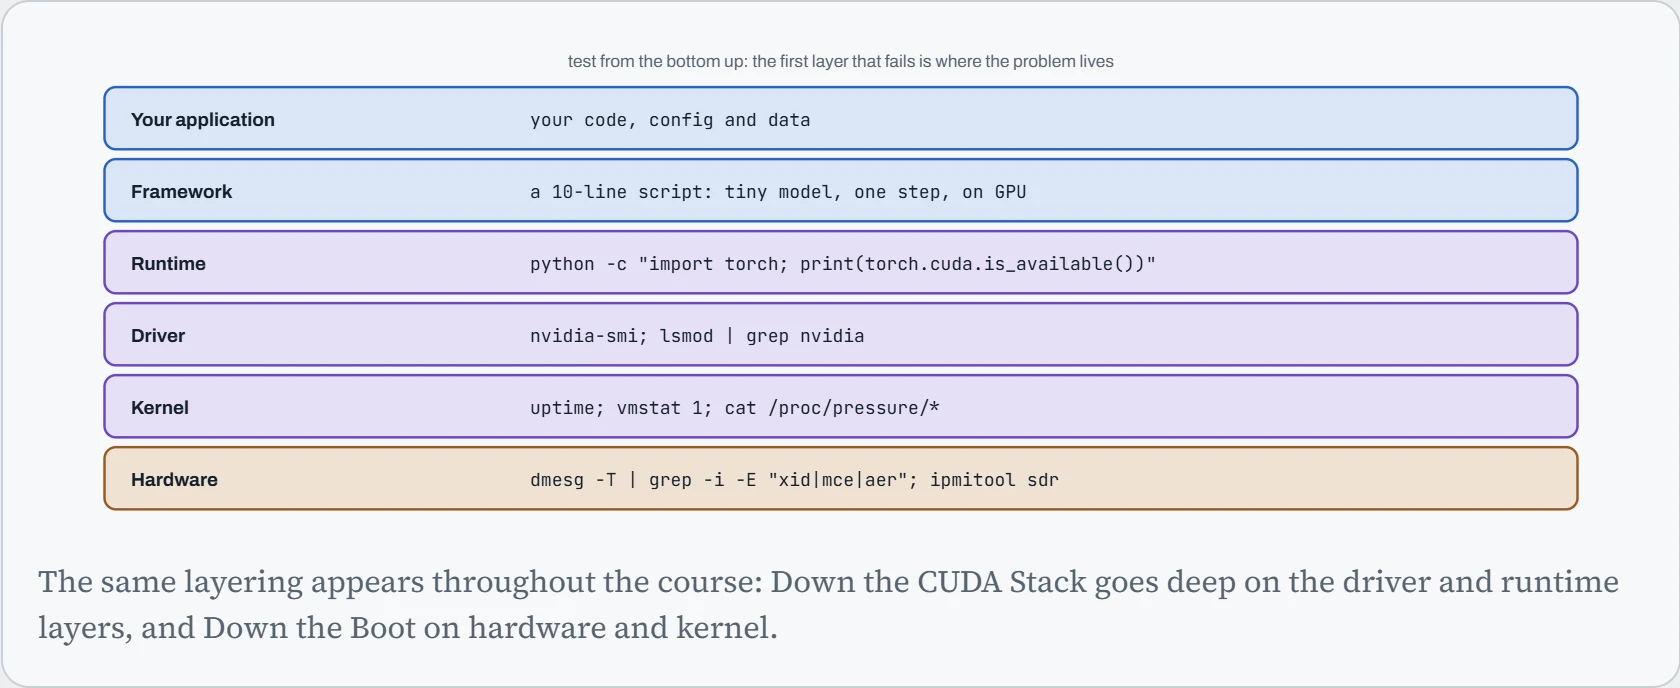
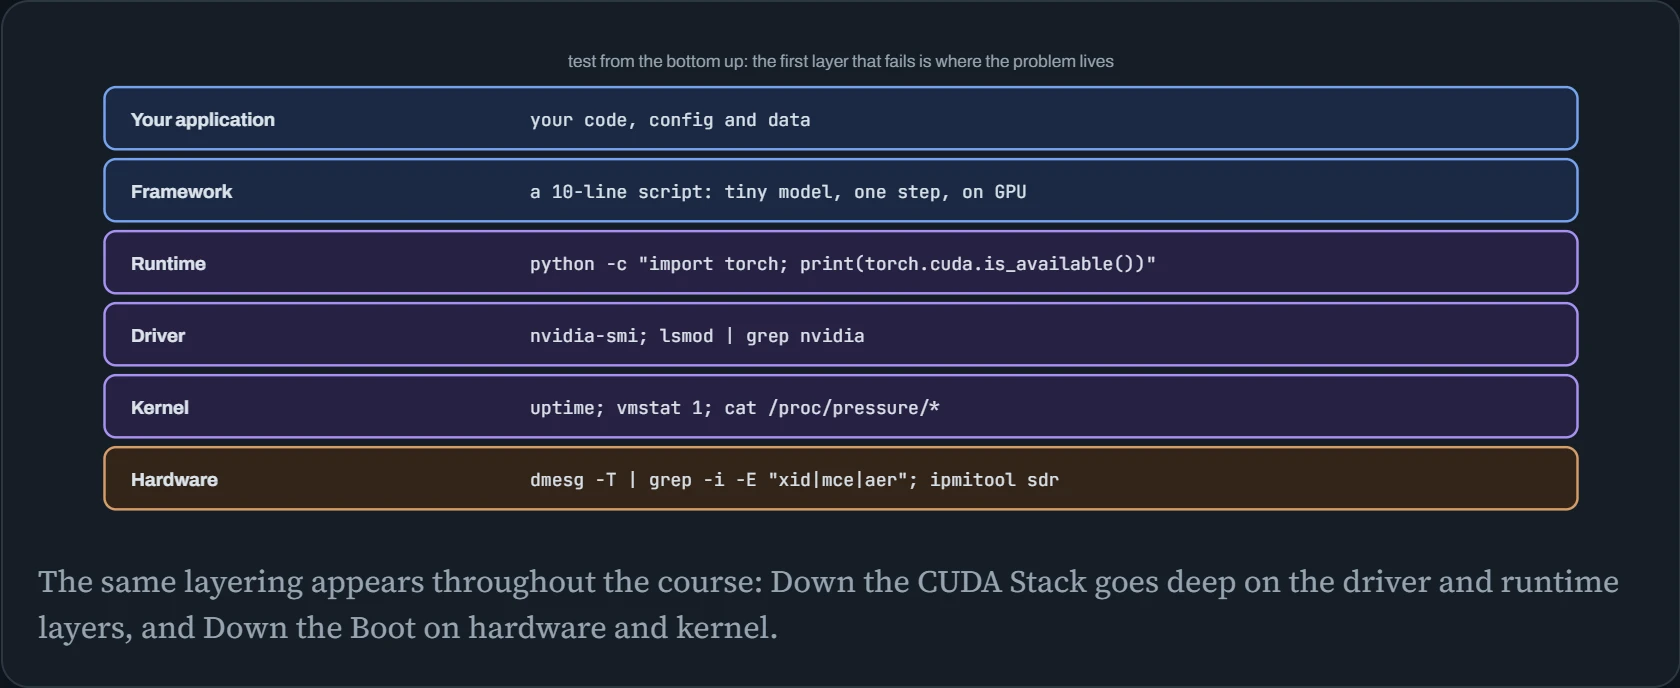
The power of this is how fast it narrows things down. If the 10-line script works, the problem is in your application: its code, configuration or data. If torch.cuda.is_available() fails, nothing above it matters yet. Most long, painful debugging sessions are spent several layers above the actual failure.
Memory: free isn't the number
“The server has almost no free memory!” is one of the most common false alarms. Linux uses spare RAM to cache files (the page cache from Down the Disk), and gives it back the moment a program needs it. So the free column is nearly always small on a healthy machine. The column that matters is available: how much programs could get right now.
$ free -g
               total        used        free      shared  buff/cache   available
Mem:             503         212           6           2         285         287
Swap:              7           0           7
$ cat /proc/pressure/memory
some avg10=0.00 avg60=0.00 avg300=0.00 total=1823211
full avg10=0.00 avg60=0.00 avg300=0.00 total=402117
Only 6 GB is free, but 287 GB is available, and the memory pressure numbers (PSI) are all zero: no work is stalling on memory. This machine is fine. Real memory trouble looks different: available close to zero, swap filling up and constantly in use (the si/so columns in vmstat), PSI some above zero, and finally the kernel's OOM killer picking a process to kill, which it records in the kernel log.
Swap on AI servers is a judgement call. A little swap gives the kernel somewhere to put truly idle memory, but a training job that starts swapping slows to a crawl rather than failing cleanly. Many teams keep a small swap, or use zram (compressed swap kept in RAM), and rely on limits (Down the Unit) to stop one job from taking everything.
Two more memory settings come up on AI servers. Memory is handed out in small blocks called pages, normally 4 KB each. Overcommit (vm.overcommit_memory) decides whether the kernel lets programs reserve more memory than really exists. By default it mostly does, and trouble only starts if they actually use it all. Transparent huge pages (THP) let the kernel use 2 MB pages instead, which can speed up programs that touch huge amounts of memory, like model weights. The catch is that the kernel sometimes pauses to tidy memory into 2 MB pieces. Check the setting in /sys/kernel/mm/transparent_hugepage/enabled, and if a server shows odd, short stalls, it's worth testing madvise mode, where only programs that ask for huge pages get them.
Predict. On the healthy machine above (6 GB free, 285 GB of cache, 287 GB available), you start a job that loads a 200 GB dataset into memory. Will the kernel have to kill something to make room?
Answer. No. 200 GB is well under the 287 GB available. The kernel simply drops 200 GB of cached file data and hands that memory to the job. Nothing is killed, and nothing is swapped out.
There is a quiet cost, though: whatever files were in that cache now have to be read from disk again the next time someone uses them. So the job is fine, but another job reading those files may suddenly run slower. “Available” tells you what fits, not what's free of side effects.
Looking inside a process
When one process misbehaves (stuck, slow, or failing with a vague error), you can look inside it without changing its code. strace shows every request it makes to the kernel, which is the fastest way to see what file it's really looking for, or what it's waiting on. lsof lists every file and connection it has open. py-spy shows Python's own call stack, as in Down the Profiler:
$ strace -f -e trace=openat -o /tmp/trace.txt python serve.py ; grep ENOENT /tmp/trace.txt | tail -2
openat(AT_FDCWD, "/opt/models/qwen/tokenizer.json", O_RDONLY|O_CLOEXEC) = -1 ENOENT (No such file or directory)
openat(AT_FDCWD, "/root/.cache/huggingface/hub/models--Qwen…", O_RDONLY|O_DIRECTORY) = -1 ENOENT (No such file or directory)
$ sudo lsof -p 48211 | grep -E "REG|TCP" | head -3
python  48211 train  7w   REG  259,1   73400320 1311 /data/logs/train.log
python  48211 train  21u  IPv4 991230      0t0  TCP gpu-box:43120->nas01:nfs (ESTABLISHED)
$ sudo py-spy dump --pid 48211 | head -4
Thread 48211 (idle): "MainThread"
    wait (threading.py:331)
    get (multiprocessing/queues.py:113)
    _try_get_data (torch/utils/data/dataloader.py:1133)
The strace output answers in one line a question that could take an hour of guessing: the program expected a tokenizer file at /opt/models/qwen/, and it isn't there. ENOENT means “no such file”. The py-spy dump answers a different question: the training loop is idle because it's waiting for the data loader to hand it the next batch, so the slowness is in loading data, not in the GPU. For crashes in compiled code, like a CUDA extension, two more tools help. gdb -p PID -batch -ex "thread apply all bt" prints where every thread of a stuck process is. And core dumps, saved by systemd and listed with coredumpctl, let you examine a crash after it happened.
Continue the lesson
The whole lesson, with its drawings and its questions. 4 more sections after the ones above.