
LLM serving: prefill and decode, KV cache budgets, continuous batching, PagedAttention and gateways
A single user barely uses a GPU: serving 64 requests at once, the same GPU wrote about 37 times as many tokens per second while each user still got about 77. Serving has two phases with different bottlenecks, the KV cache sets how many conversations fit, and continuous batching fills a slot the moment one frees.
What this page answers
How can one GPU serve many users at once?
One conversation leaves most of the GPU idle. In the lesson's example, 64 requests at once produced 37 times the tokens per second, and each user still got about 77 tokens per second, faster than anyone reads. Read it in “One GPU, sixty-four conversations”
What is continuous batching?
Answers come in different lengths. Static batching waits for the slowest answer in a batch; continuous batching lets a waiting request take a slot as soon as one comes free, so the GPU never waits for the longest answer. Read it in “Continuous batching: never wait for the slowest answer”
One GPU, sixty-four conversations
Picture one H100 GPU running the Llama 3.1 8B model with vLLM. A single user is chatting, and the conversation so far is about 2,000 tokens long. (A token is a word or a piece of a word.) Every few seconds, vLLM prints a status line:
INFO [loggers.py:123] Engine 000: Avg prompt throughput: 0.0 tokens/s, Avg generation throughput: 133.9 tokens/s, Running: 1 reqs, Waiting: 0 reqs, GPU KV cache usage: 0.5%, Prefix cache hit rate: 0.0%
The output on this page is typical of vLLM's V1 engine on one H100 80 GB. Your exact numbers will change with versions, drivers and prompts. The patterns won't.
Now 64 users chat at the same time, each with a conversation about as long. Guess how many tokens per second the GPU writes in total.
- About 134 tok/s: the GPU's already busy
- About 1,000 tok/s
- About 5,000 tok/s
Answer.
INFO [loggers.py:123] Engine 000: Avg prompt throughput: 0.0 tokens/s, Avg generation throughput: 4941.7 tokens/s, Running: 64 reqs, Waiting: 0 reqs, GPU KV cache usage: 29.4%, Prefix cache hit rate: 0.0%
The same GPU now writes 37 times as many tokens per second, and each user still gets about 77 tokens per second, which is faster than anyone can read. So that single user was barely using the GPU at all, even though nvidia-smi would have shown it as fully busy.
To see why, and to make sense of almost everything else about serving, we need to look at how an LLM writes text.
Two phases, two different bottlenecks
Every request goes through two very different kinds of work. First comes prefill, where the model reads the whole prompt in one go, every token at the same time. While it reads, it saves a few numbers about each token in the KV cache, then writes the first token of the answer.
Then comes decode, which writes the rest of the answer one token at a time. Each new token depends on the one before it, so there's no way to write several at once. In the diagram, prefill is on the left and decode is on the right.
The text under each half says what slows it down. Compute-bound means the GPU's arithmetic is the limit. Memory-bound means the GPU mostly sits waiting for data to arrive from its memory.
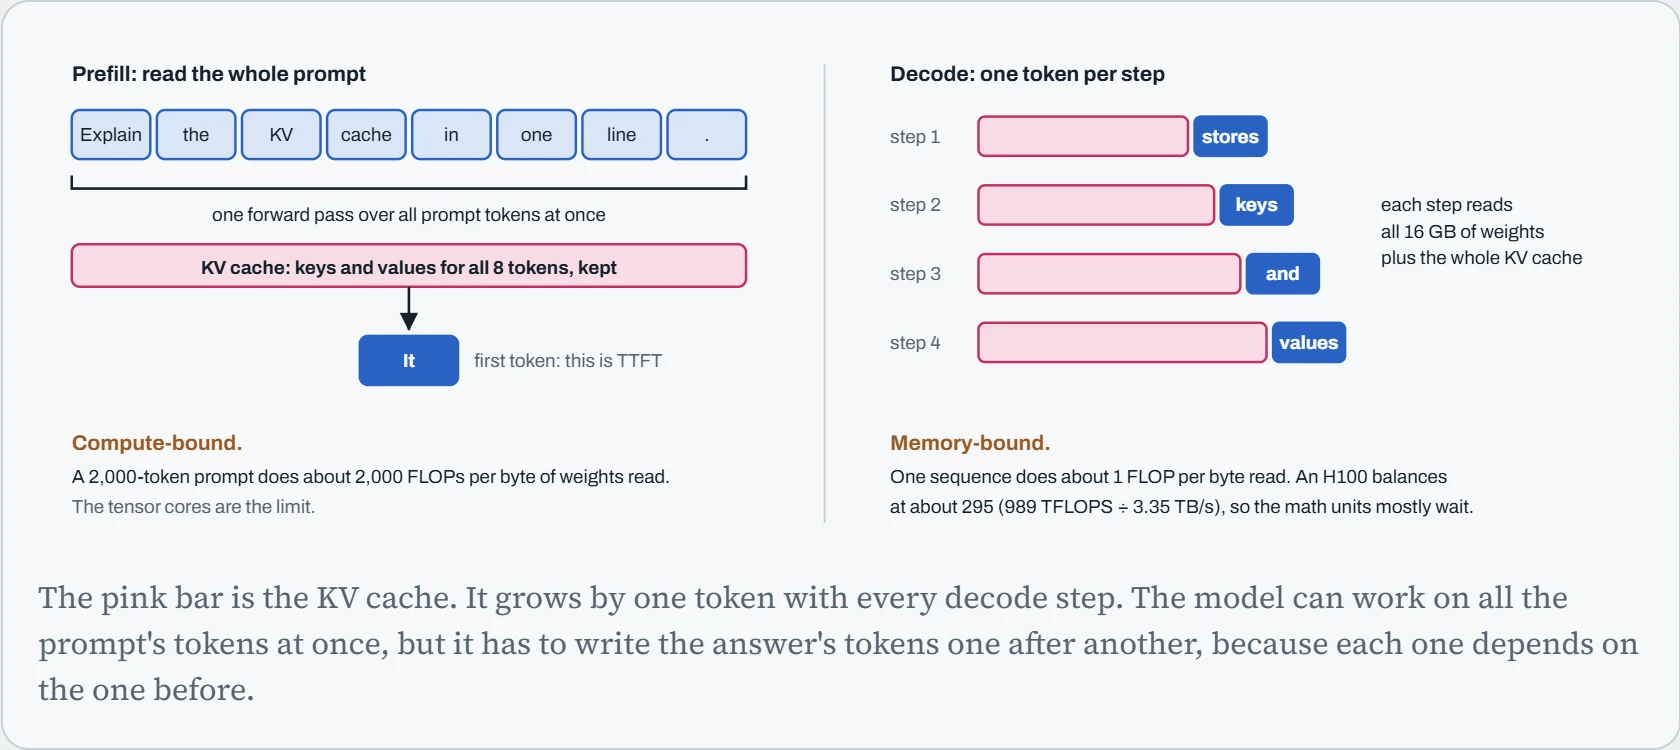
Here's the big idea. In every decode step, the GPU has to read all of the model's weights (the numbers it learned in training) from memory once. That costs the same whether it's writing one token or sixty-four. With one conversation, all that reading buys one token. With 64 conversations in the same step, the same reading buys 64 tokens. Running requests together like this is called batching, and it's almost free until something else becomes the limit.
That something is the KV cache. Every conversation in the batch has its own cache, and that has to be read every step too. So each extra request makes the step a little longer.
The chart below, which we'll call the frontier chart, shows the trade-off a serving engineer actually tunes. Each dot is one batch size, meaning how many requests decode together. One request sits at the bottom right, and 217 sit at the top left, where the cache is full.
Copper is reading the model's weights, the 16 GB of numbers it learned in training. Blue is reading every request's cache, and grey is a small fixed cost paid on every step.
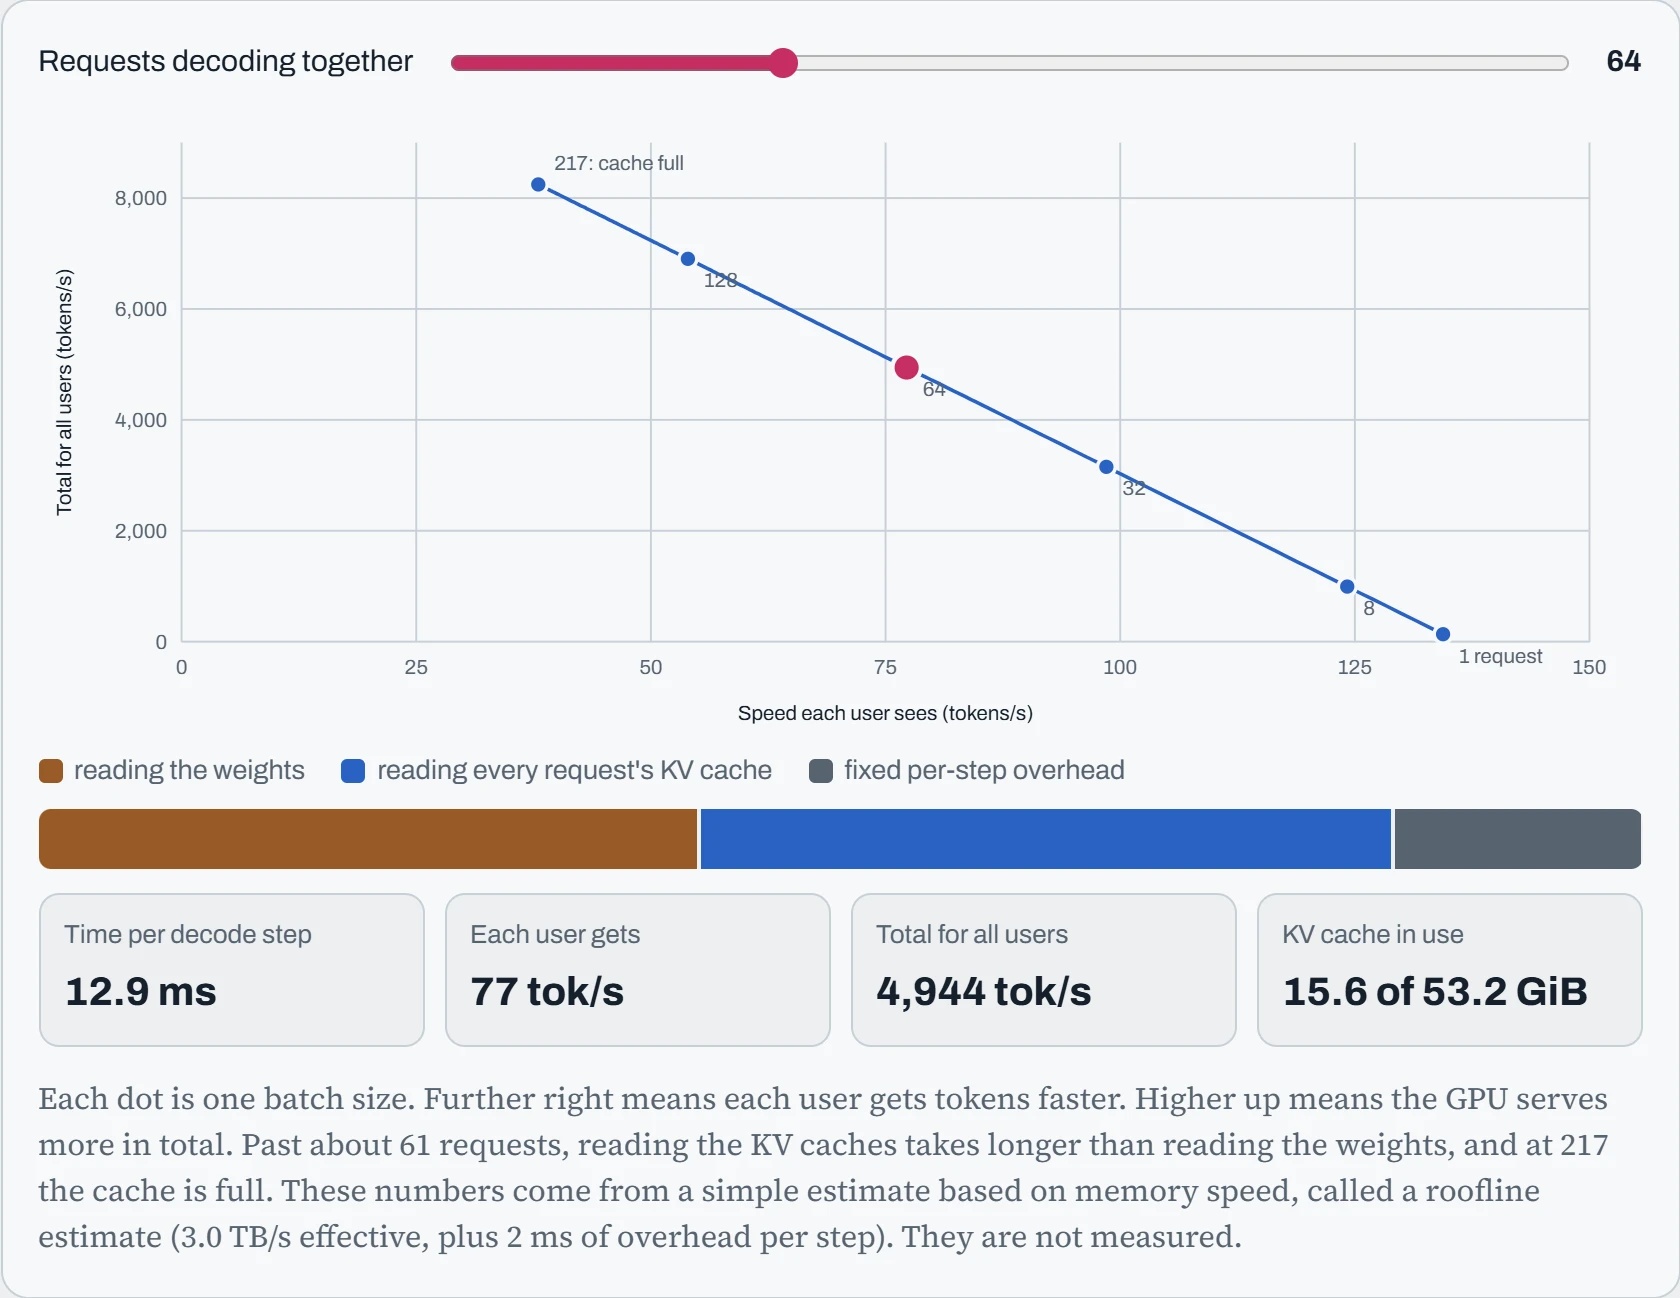
Follow the numbers from the hook. Going from 1 to 64 requests makes the GPU's total output about 37 times bigger, while each user slows only from 134 to 77 tokens per second. Past that, reading the caches takes up most of each step. Every extra request then adds less total output and slows everyone down a bit more.
The KV cache is the budget
Why keep a cache at all? To pick each new token, the model looks back at every earlier token in the conversation. This look-back is called attention. It doesn't reread the raw words. It uses two short lists of numbers it worked out for each token, called the key and the value (the K and V in KV). Working those out again for the whole history on every step would make each step slower than the last. So the server works them out once per token and keeps them. That store is the KV cache, and its size follows straight from the model's shape:
bytes per token = 2 × layers × KV heads × head dim × bytes per value
For Llama 3.1 8B that's 2 × 32 × 8 × 128 × 2 = 131,072 bytes, or 128 KiB, for every token. (The first 2 is one key plus one value. The last 2 is two bytes per number.) So a 2,000-token conversation holds about 250 MiB of cache. That's why vLLM's startup log is mostly about memory. Start a server and read it:
$ docker run --gpus all --ipc=host -p 127.0.0.1:8000:8000 \
    -v ~/.cache/huggingface:/root/.cache/huggingface --env HF_TOKEN \
    vllm/vllm-openai:v0.11.0 \
    --model meta-llama/Llama-3.1-8B-Instruct --max-model-len 8192
...
INFO [gpu_model_runner.py] Model loading took 14.99 GiB and 6.21 seconds
INFO [gpu_worker.py] Available KV cache memory: 53.17 GiB
INFO [kv_cache_utils.py] GPU KV cache size: 435,568 tokens
INFO [kv_cache_utils.py] Maximum concurrency for 8,192 tokens per request: 53.17x
INFO [gpu_model_runner.py] Graph capturing finished in 9 secs, took 0.52 GiB
INFO [api_server.py] Starting vLLM API server 0 on http://0.0.0.0:8000
Read it like a household budget. vLLM claims 90% of the GPU's memory (--gpu-memory-utilization 0.9, the default), which is 71.3 GiB. The weights take 15 GiB. About 3 more go to overhead: scratch memory for in-between results (activations), pre-recorded runs of GPU work that vLLM can replay quickly (CUDA graphs), and the driver's own bookkeeping for the process (the CUDA context). Everything left becomes KV cache, and vLLM reserves all of it at startup: 53.17 GiB ÷ 128 KiB is 435,568 tokens.
Look at the tidy number on the “Maximum concurrency” line. 8,192 tokens × 128 KiB is exactly 1 GiB per maximum-length request, so 53.17 GiB holds 53.17 of them. Real requests are usually much shorter, so many more of them fit.
One Linux detail in that command: --ipc=host. It matters once you split a model across several GPUs (tensor parallelism), because the worker processes then share memory through /dev/shm. That's the same Docker default that caught us in chapter 18.
The planner below does the same sums for other models and GPUs. Change any setting, and the bar shows how the GPU's memory gets shared out: weights, overhead, the KV cache, and the part the utilization setting keeps back. Under the bar is the log vLLM would print, or the error it would stop with.
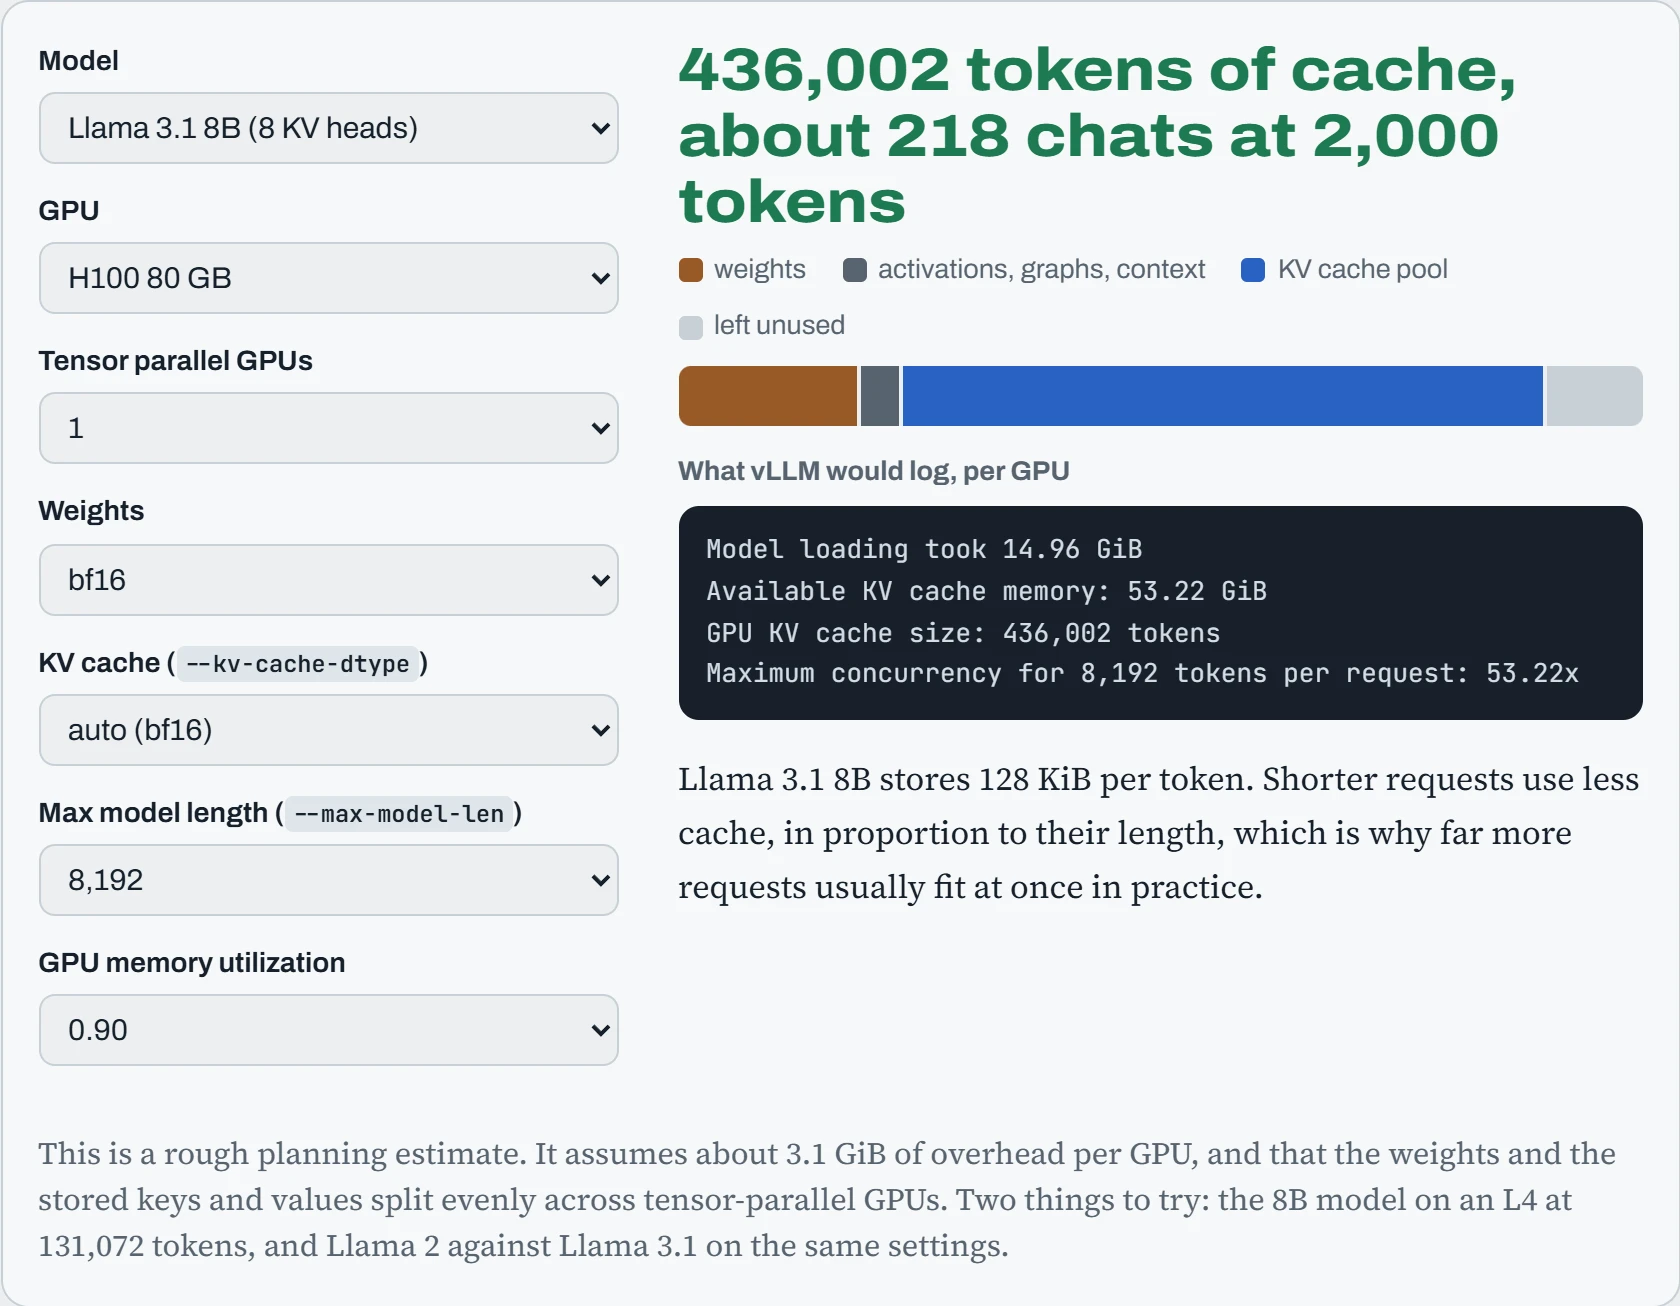
On the L4, the 8B model refuses to start at 131,072 tokens. One request that long needs 16 GiB of cache, and the L4 has only about 2 GiB left once the weights and overhead are in.
Now take Llama 2 7B on the H100. It's the smaller model, yet its cache holds far fewer tokens.
Predict. Llama 2 7B and Llama 3.1 8B are almost the same size. Why does the older, smaller model fit only a quarter as many tokens in its cache?
Answer. In each layer, attention runs as several side-by-side parts called heads. Llama 2 7B gives every one of its 32 attention heads its own keys and values. Llama 3.1 makes heads share: its 32 heads are split into 8 groups of four, and each group shares one set of keys and values (8 KV heads in total). This is called grouped-query attention, and it means the model stores a quarter as much per token (128 KiB against 512 KiB). That one design choice decides how many users fit on a GPU more than the model's size (its parameter count) does.
--kv-cache-dtype fp8 halves it again by storing each number in one byte instead of two, usually with little loss in answer quality. Check that on your own test set before you ship it.
Continuous batching: never wait for the slowest answer
Batching helps, but answers come in different lengths. Say ten requests are waiting, and their answers will be 8, 3, 6, 2, 7, 4, 5, 3, 6 and 2 tokens long. The GPU has room for four at a time. Here are two ways to schedule them.
The only difference is when a waiting request may take a seat that has come free. In the timeline, each row is one of the four seats, called slots, and each column is one decode step.
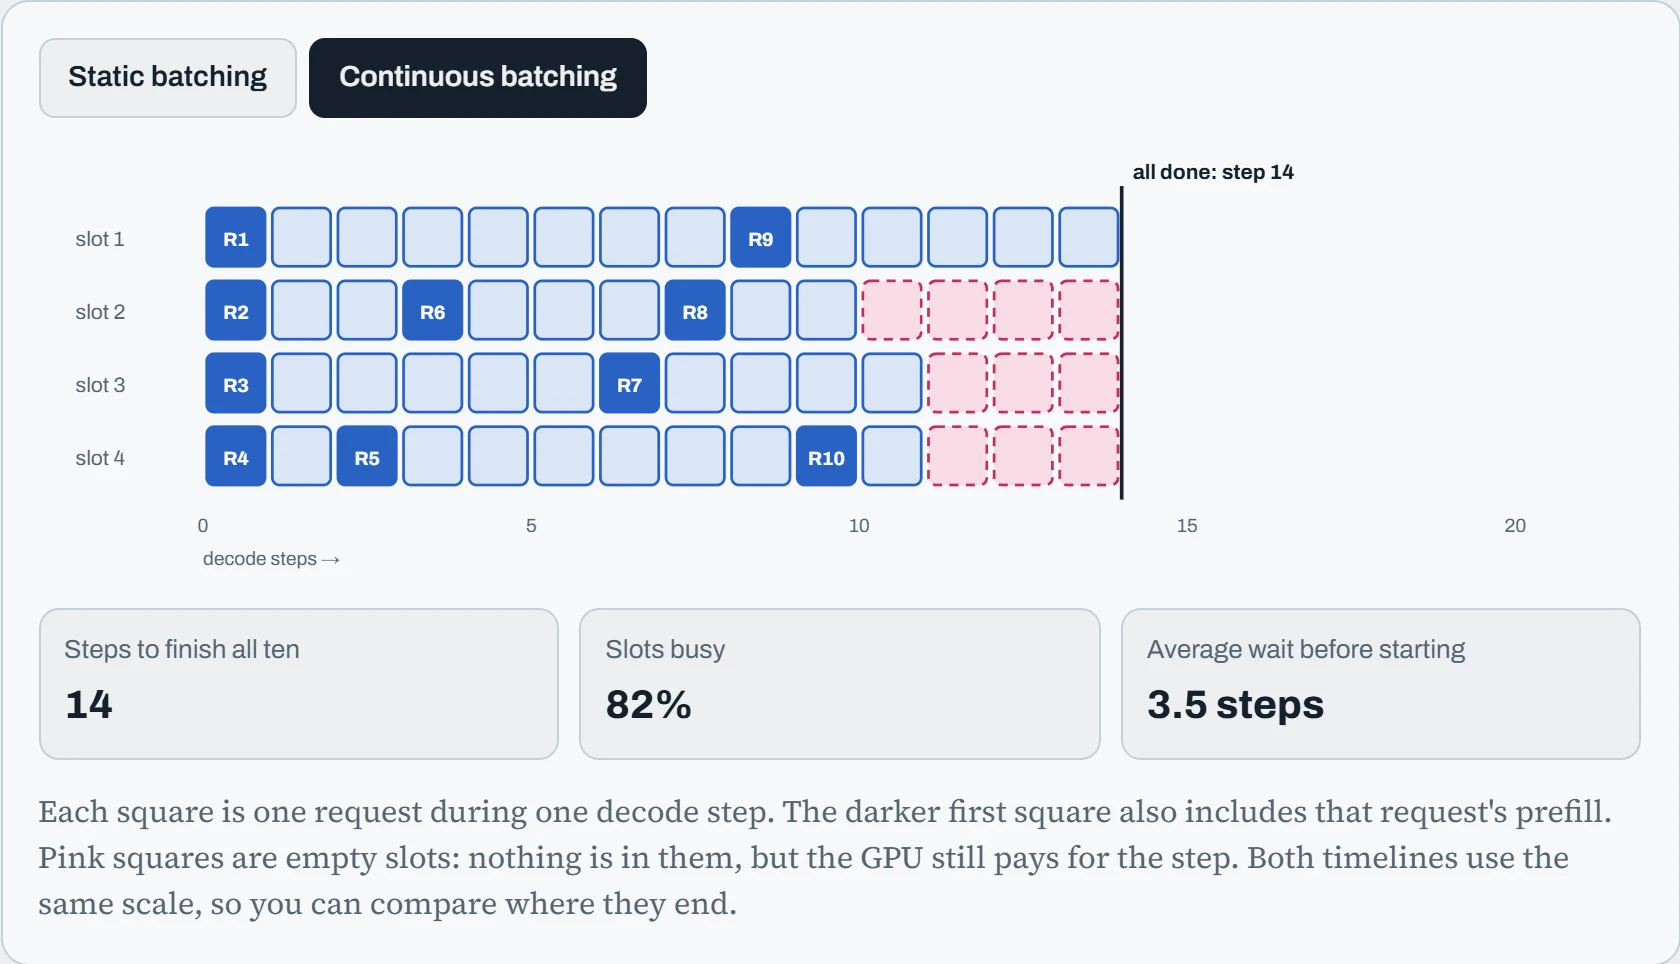
With these ten requests, the static timeline takes 21 steps, and the slots are busy only 55% of the time. The continuous one finishes in 14 steps with the slots 82% busy, on the same GPU. Its requests also start sooner, after 3.5 steps on average instead of 6.2.
Static batching starts a group together and waits for the longest answer in it, so the seats freed by short answers sit empty. Continuous batching re-plans on every step: when a request finishes, a waiting one takes its seat on the very next step. (It was first described in the Orca paper, and every serving engine does it now.) The batch works like a revolving door, not a bus that lets new riders on only after everyone already on board has got off.
vLLM's scheduler, the part that decides who runs in each step, has two limits you can set: --max-num-seqs (how many requests can be in the batch at once) and --max-num-batched-tokens (how many tokens one step may process, prefill and decode added together). A request has to wait when either limit is reached or the KV cache is full.
Measuring a server
First, watch one request as it streams back. Each data: line is one decode step for this request. The gap between two lines is the wait between tokens, called the inter-token latency (ITL):
$ curl -N localhost:8000/v1/chat/completions -H 'Content-Type: application/json' -d '{
    "model": "meta-llama/Llama-3.1-8B-Instruct", "stream": true,
    "messages": [{"role": "user", "content": "Explain the KV cache in one sentence."}]}'
data: {"id":"chatcmpl-9f2c","object":"chat.completion.chunk",...,"choices":[{"index":0,"delta":{"role":"assistant","content":""}}]}
data: {"id":"chatcmpl-9f2c","object":"chat.completion.chunk",...,"choices":[{"index":0,"delta":{"content":"The"}}]}
data: {"id":"chatcmpl-9f2c","object":"chat.completion.chunk",...,"choices":[{"index":0,"delta":{"content":" KV"}}]}
...
data: [DONE]
Then give the server some real load. vllm bench serve sends it a steady stream of requests and reports the numbers that matter:
$ vllm bench serve --model meta-llama/Llama-3.1-8B-Instruct --dataset-name random \
    --random-input-len 1024 --random-output-len 256 --num-prompts 1000 --request-rate 12
============ Serving Benchmark Result ============
Successful requests:                     1000
Benchmark duration (s):                  92.31
Request throughput (req/s):              10.83
Output token throughput (tok/s):         2773.25
Total Token throughput (tok/s):          13866.32
---------------Time to First Token----------------
Mean TTFT (ms):                          187.42
Median TTFT (ms):                        142.80
P99 TTFT (ms):                           912.55
-----Time per Output Token (excl. 1st token)------
Mean TPOT (ms):                          21.36
Median TPOT (ms):                        20.91
P99 TPOT (ms):                           34.08
---------------Inter-token Latency----------------
Mean ITL (ms):                           21.30
Median ITL (ms):                         16.42
P99 ITL (ms):                            88.71
==================================================
Each block of that report answers a different question about how the server feels to use. The table says what each number measures and what pushes it up or down. The last row, goodput, rolls them into the one number worth chasing.
| Metric | What it measures | What drives it |
|---|---|---|
| TTFT | Time to first token: from sending the request to seeing the first token. It's how long the user stares at a spinner | Waiting in the queue, then prefill time |
| ITL | Inter-token latency: the gap between one token and the next, within one request | How long a decode step takes, plus any prefill squeezed into the same step |
| TPOT | Time per output token: one request's average gap between tokens, not counting the first token | How many requests share each step, and how long their conversations are (the frontier chart) |
| Throughput | Tokens per second, added up over all requests | Batch size, until the KV cache fills up |
| Goodput | Requests per second that also met your TTFT and ITL targets | All of the above. This is the number to improve |
Look at the ITL lines. The median gap is 16 ms, but the P99 is 89 ms. P99 means 99 gaps out of 100 are that long or shorter, so about one gap in a hundred is more than five times the usual one. Users notice that as a stutter in the stream. Keep that number in mind; the Mechanism part of the lesson explains where it comes from.
On a live server, read the numbers from the server's /metrics page instead. The metric names change a little between vLLM versions, so keep your grep loose:
$ curl -s localhost:8000/metrics | grep -E '^vllm:(num_requests_(running|waiting)|kv_cache_usage|num_preemptions)'
vllm:num_requests_running{engine="0",model_name="meta-llama/Llama-3.1-8B-Instruct"} 64.0
vllm:num_requests_waiting{engine="0",model_name="meta-llama/Llama-3.1-8B-Instruct"} 0.0
vllm:kv_cache_usage_perc{engine="0",model_name="meta-llama/Llama-3.1-8B-Instruct"} 0.294
vllm:num_preemptions_total{engine="0",model_name="meta-llama/Llama-3.1-8B-Instruct"} 0.0
Those four lines are a quick health check on their own. waiting above zero means requests are standing in line, so TTFT grows. kv_cache_usage near 1.0 means the cache is what's holding you back. A preemptions count that keeps climbing means vLLM ran out of cache space and kicked requests out partway through their answers, to be recomputed later.
Load testing tools
vllm bench serve is the quickest way to load your own vLLM. For comparing engines, or testing a server you didn't set up, dedicated tools do the same job from the outside. GuideLLM sweeps from a trickle of requests up to the server's limit and reports where latency breaks. GenAI-Perf (from NVIDIA) measures TTFT and ITL at fixed concurrency against any OpenAI-style endpoint. General web load tools like k6 or Locust are better for testing the whole path, gateway and logins included:
$ guidellm benchmark --target http://localhost:8000 --rate-type sweep \
    --data "prompt_tokens=512,output_tokens=256" --max-seconds 60
$ genai-perf profile -m meta-llama/Llama-3.1-8B-Instruct --endpoint-type chat \
    --streaming --concurrency 32 --url localhost:8000
Whatever the tool, the method is the same: raise the load step by step, plot throughput and P99 latency against it, and find the saturation point, where throughput stops climbing while latency shoots up. Run your servers below it, with the gap as your safety margin for traffic spikes. And always test with prompt and answer lengths like your real traffic: a server that's fast on 128-token prompts can fall over on 8,000-token ones.
The API gateway
Once there's more than one model server, or more than one team using them, something should stand in front: a gateway. It gives everyone one address and one kind of API key, spreads requests across replicas, sends each model name to the right backend (local or a cloud provider), enforces limits and budgets per key, and records who used what. Inference engines themselves have little of this: vLLM can check one shared API key, and that's all. LiteLLM is a popular open-source gateway that speaks the OpenAI API on both sides:
# litellm.yaml: two vLLM replicas behind one name, plus a cloud fallback
model_list:
  - model_name: chat
    litellm_params: { model: hosted_vllm/meta-llama/Llama-3.1-8B-Instruct, api_base: http://10.0.0.21:8000/v1 }
  - model_name: chat
    litellm_params: { model: hosted_vllm/meta-llama/Llama-3.1-8B-Instruct, api_base: http://10.0.0.22:8000/v1 }
router_settings:
  routing_strategy: least-busy
general_settings:
  master_key: os.environ/LITELLM_MASTER_KEY
  database_url: os.environ/DATABASE_URL         # needed for per-key budgets and logs
$ litellm --config litellm.yaml --port 4000
# a key for one team: only the "chat" model, $50 a month, 60 requests a minute
$ curl -s localhost:4000/key/generate -H "Authorization: Bearer $LITELLM_MASTER_KEY" \
    -H "Content-Type: application/json" -d '{"models":["chat"],"max_budget":50,"rpm_limit":60}'
Streaming is where gateways and proxies usually break things. A streamed answer is many small pieces sent over minutes, and a proxy that collects the whole response before passing it on turns a smooth stream into one long wait followed by everything at once. In nginx, turn buffering off for these routes (proxy_buffering off;) and raise the read timeout above your longest generation (proxy_read_timeout 600s;). Test it end to end with curl -N through the gateway, not just against the engine directly.
Serving models that aren't chatbots
Much of the GPU work in a real AI product isn't chat. Embedding models turn text into vectors for search, rerankers sort search results, speech models transcribe, and vision models classify or detect. These models are small, each request is short, and none of the KV cache machinery above applies. What matters instead is fitting many small requests onto the GPU at once. Each kind has its usual server:
| Model | Typical server | What limits it |
|---|---|---|
| Embeddings, rerankers | Text Embeddings Inference (TEI), or vLLM's pooling mode | Batching many short texts together |
| Speech to text | faster-whisper or whisper.cpp behind a small API, or Triton | Audio length, and decoding on the CPU |
| Vision (classify, detect) | Triton Inference Server with ONNX Runtime or TensorRT | Image decoding and resizing before the GPU |
| Any model, offline | A batch job: vLLM's offline mode, or Ray Data | Throughput only: nobody is waiting |
The key setting for small models is dynamic batching. Running one request alone wastes most of the GPU, so the server holds each request for a few milliseconds to see if others arrive, then runs them together. That short wait costs a little latency and buys a lot of throughput.
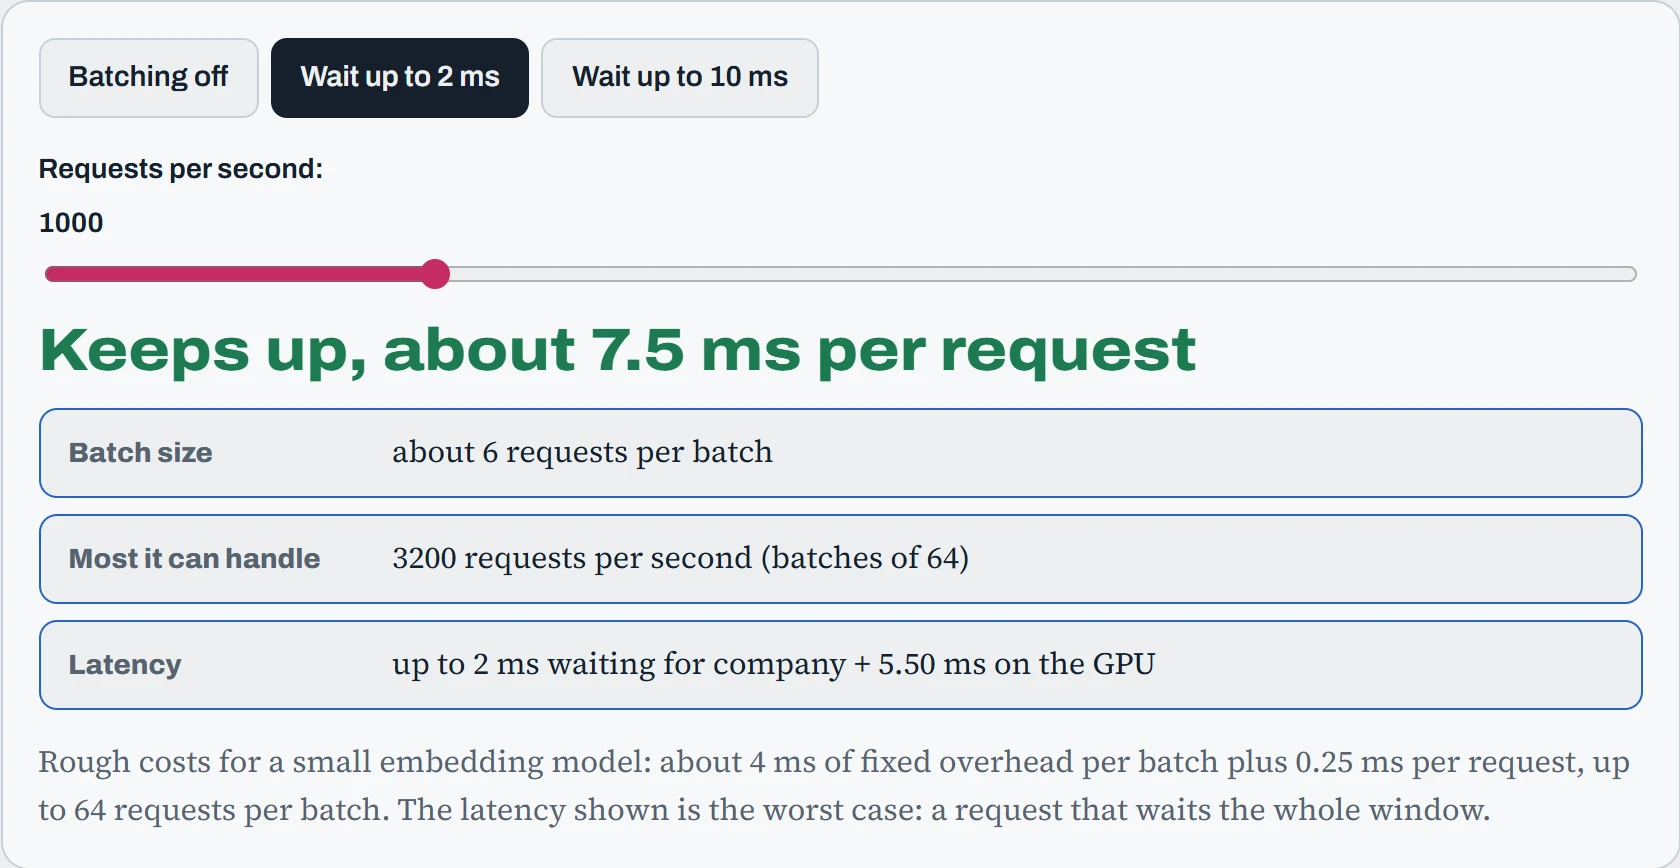
Without batching, the GPU tops out around 235 requests a second, spending most of its time on per-batch overhead. With batching, the same GPU handles over 3,000, because 64 requests share one overhead. The wait window matters at both ends: it adds its full length to latency when traffic is light, and it lets batches grow when traffic is heavy. In Triton it's one block in the model's config file:
# models/embedder/config.pbtxt  (Triton Inference Server)
name: "embedder"
backend: "onnxruntime"
max_batch_size: 64
dynamic_batching {
  max_queue_delay_microseconds: 2000
}
instance_group [ { kind: KIND_GPU, count: 1 } ]
$ docker run --gpus all -p 127.0.0.1:8001:8001 -v $PWD/models:/models \
    nvcr.io/nvidia/tritonserver:25.09-py3 tritonserver --model-repository=/models
Converting a model to ONNX (and on NVIDIA, on to TensorRT) is the other big lever: it often runs the same model several times faster than plain PyTorch. And for work nobody waits on, like embedding a million documents for the RAG index in Down the App, skip the server entirely: run it as a batch job that reads files, uses the biggest batches that fit, and writes results as it goes, so a crash only loses the last batch.
Predict. Your embedding service gets about 100 requests a second, and you raise the batching wait from 2 ms to 10 ms “to batch better”. Does it get faster?
Answer. No, it gets slower for users. At 100 requests a second, one GPU keeps up easily without big batches, so the longer window doesn't buy any throughput you need. It just makes each request wait up to 10 ms for company that rarely comes. at 100 requests per second, latency rises by 8 ms and capacity doesn't matter.
Batching windows are a trade you make under load. Size them from measured traffic, keep them short for interactive search, and longer only for heavy, steady traffic.
Continue the lesson
The whole lesson, with its drawings and its questions. 6 more sections after the ones above.