
Distributed training: parallelism strategies, RDMA and RoCE, NCCL collectives and Slurm
In data-parallel training every GPU must average its gradients with all the others every step, an all-reduce. Inside a server that is fast; between servers it runs over the network, so a wrong path can make twice the GPUs less than half as fast. NCCL's debug log shows which network it chose.
What this page answers
Why is multi-node training slower than one node?
The GPUs spend most of each step waiting for the network. Turning on NCCL logging with NCCL_DEBUG=INFO shows which network path it is sending over. Read it in “Twice the GPUs, half the speed”
What is an all-reduce in training?
Each GPU trains on its own slice of data and gets different gradients. Before the optimizer step every GPU needs their average; combining everyone's numbers and handing each GPU the result is the all-reduce, every step. Read it in “What every step has to move”
Twice the GPUs, half the speed
Here's a fine-tuning job (more training on an existing model) running on one server with 8 GPUs. Below it is the same script, in the same container, on two servers.
# 1 node, 8x H100
step 200 | 1.20 s/step | 54,600 tok/s
# 2 nodes, 16x H100, identical script and container
step 200 | ?
Output on this page comes from a typical H100 cluster: each server has eight GPUs and eight 400 Gb/s InfiniBand network cards. Your numbers will differ, but the patterns won't.
Guess how many tokens per second the 16 GPUs manage.
- About 109,000 tok/s (2×)
- About 95,000 tok/s (1.75×)
- Less than one node
Answer.
# 2 nodes, 16x H100
step 200 | 4.98 s/step | 26,300 tok/s
Twice the hardware, less than half the speed. The GPUs aren't slow. They spend most of every step waiting for the network. Turn on logging in NCCL, the NVIDIA library that does the sending between GPUs, and the reason is right there:
$ NCCL_DEBUG=INFO NCCL_DEBUG_SUBSYS=INIT,NET torchrun ... 2>&1 | grep -E 'NET/|via NET'
NCCL INFO NET/IB : No device found.
NCCL INFO NET/Socket : Using [0]eth0:10.0.0.12<0>
NCCL INFO Using network Socket
NCCL INFO Channel 00/0 : 7[7] -> 8[0] [send] via NET/Socket/0
These servers have eight fast 400 Gb/s InfiniBand cards each. NCCL couldn't see any of them, so it quietly switched to plain TCP (the ordinary internet protocol) over the slow 25 Gb/s port meant for admin traffic, called the management port. One missing option in the container setup, --device=/dev/infiniband, cost the cluster three quarters of its speed.
By the end of this lesson you'll know why that line matters, how to spot this problem in under a minute, and what the healthy numbers look like.
Why one GPU isn't enough, and three ways to split
The rest of this lesson is about moving data between GPUs, so first: why split work across GPUs at all? Two reasons. Training a model needs about 16 bytes of memory per parameter (Down the Memory explains why), so even an 8B model needs 128 GB, more than any single GPU has. And even when it fits, one GPU would take far too long: big training runs are measured in GPU-years.
There are three basic ways to split the work, and real jobs combine them. Each one splits something different, so each one sends different data between the GPUs:
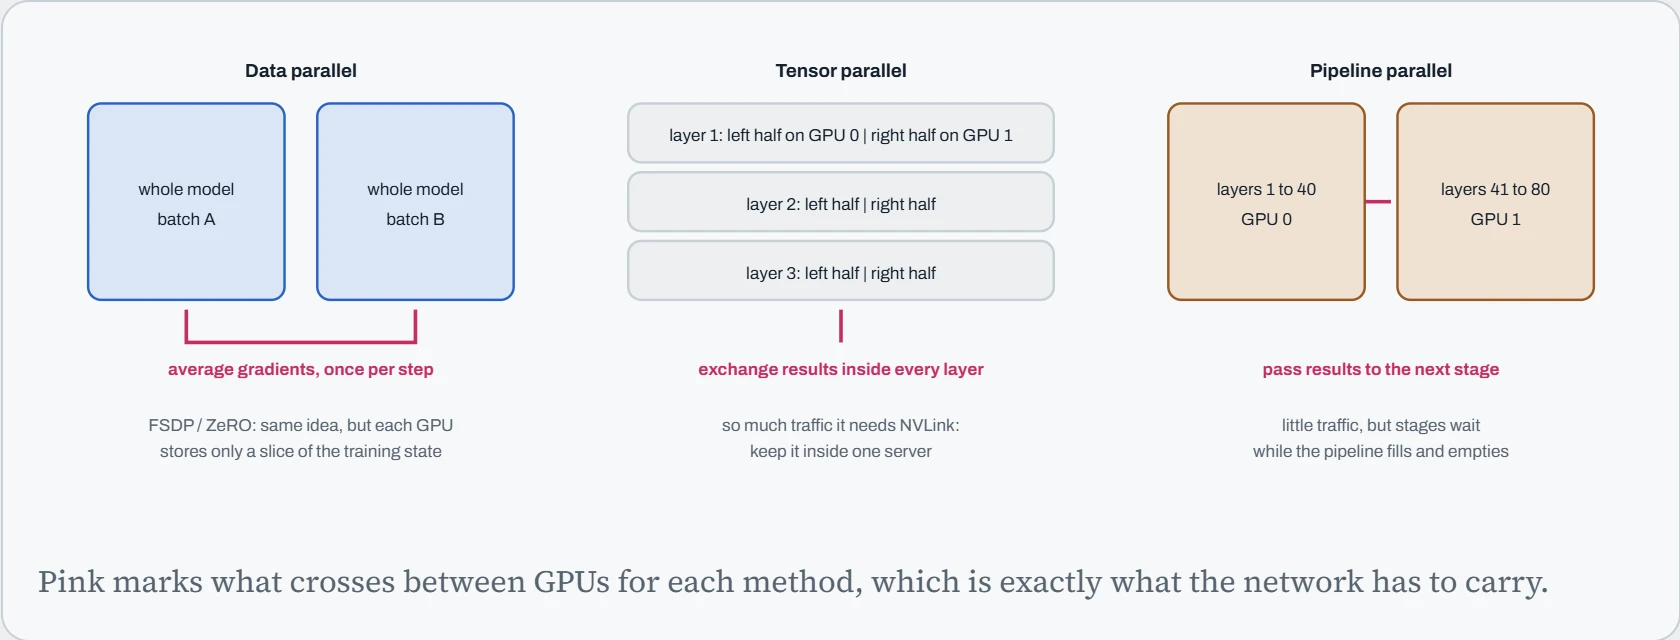
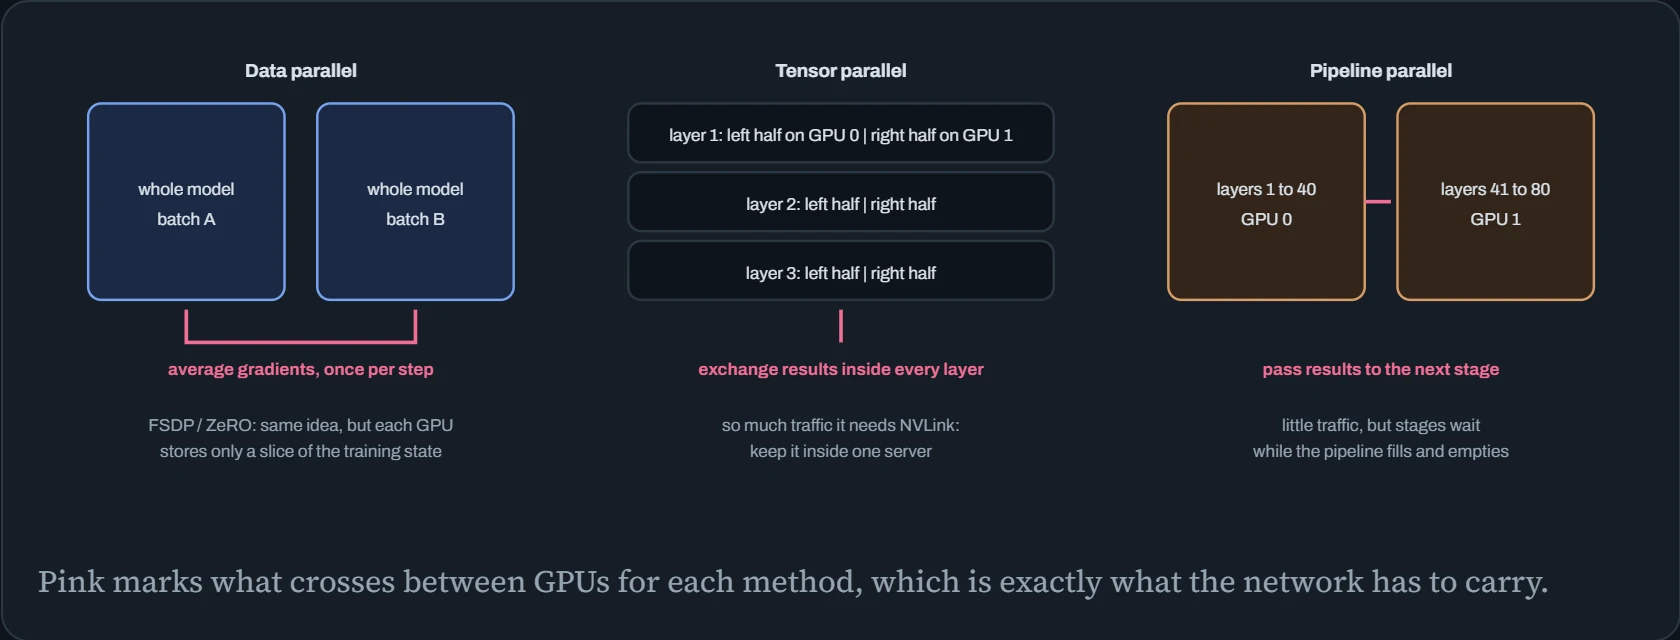
So the choice is really about where the traffic goes. Tensor parallelism talks constantly, so it stays inside one server where NVLink is fast. Data parallelism (and its memory-saving form, FSDP) talks once per step, so it can cross servers over InfiniBand or RoCE. Pipeline parallelism talks little, but leaves GPUs idle part of the time.
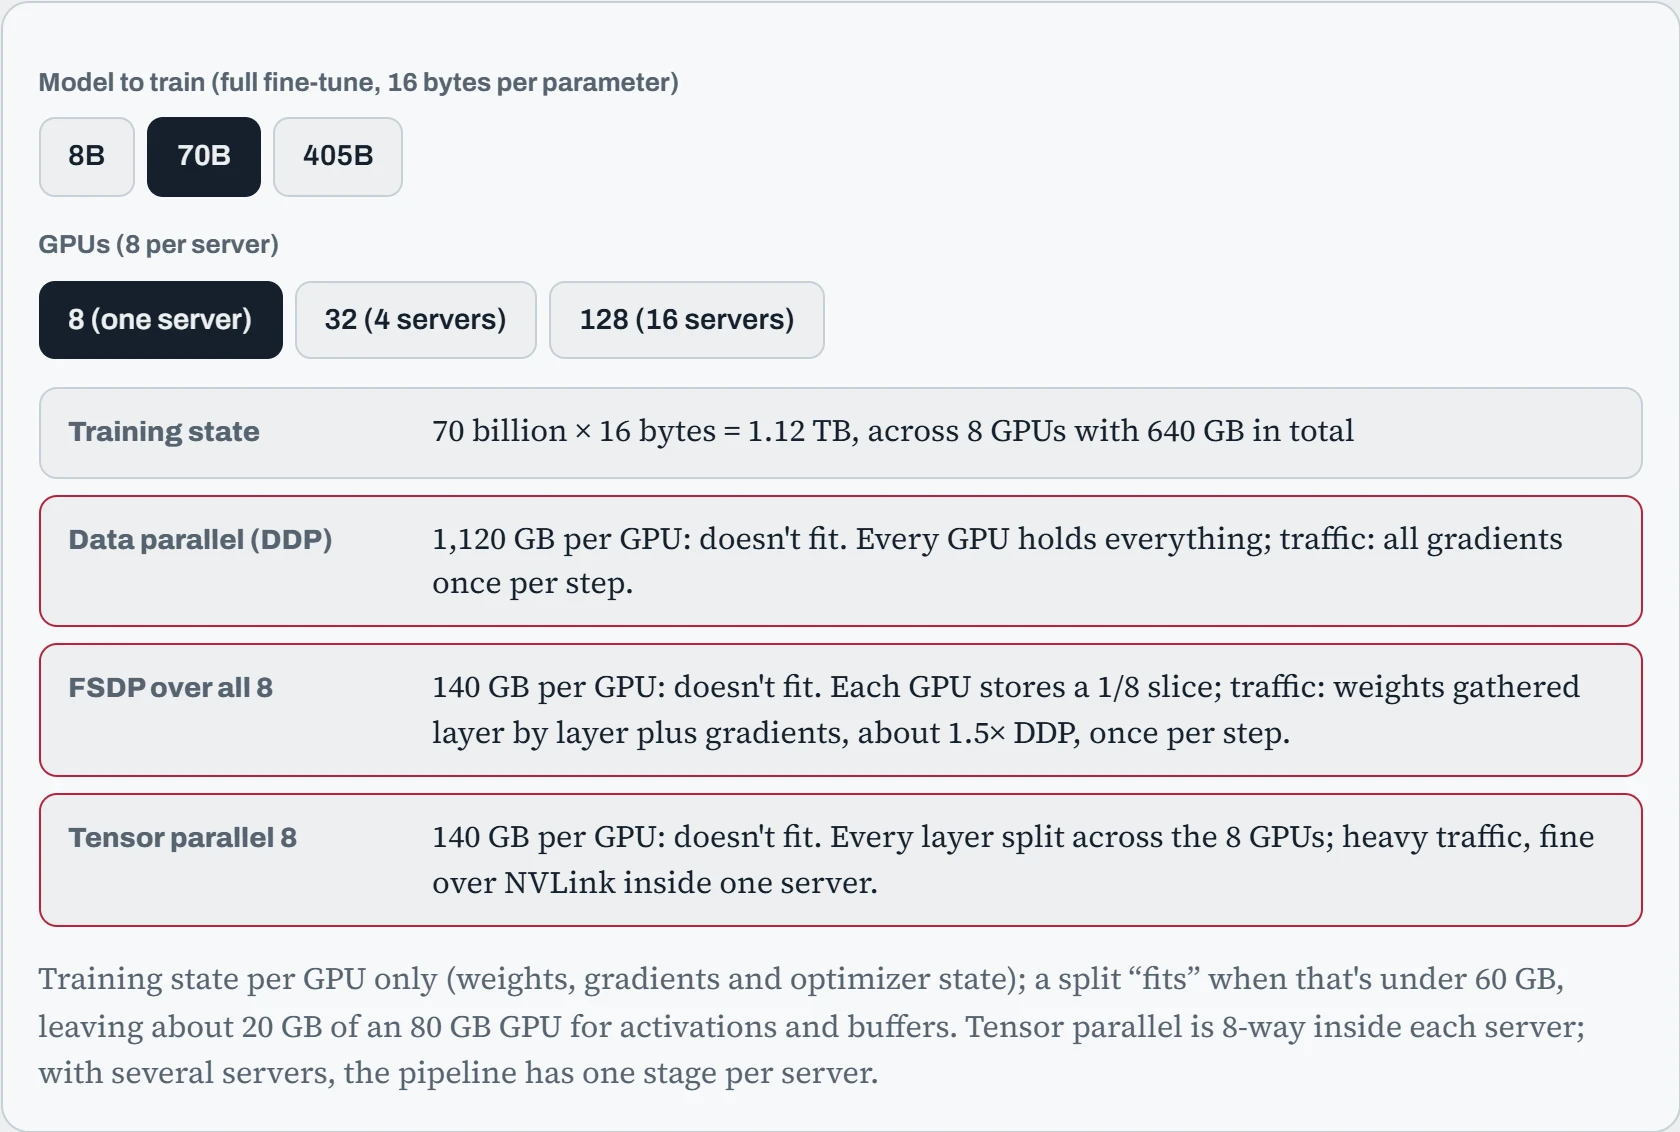
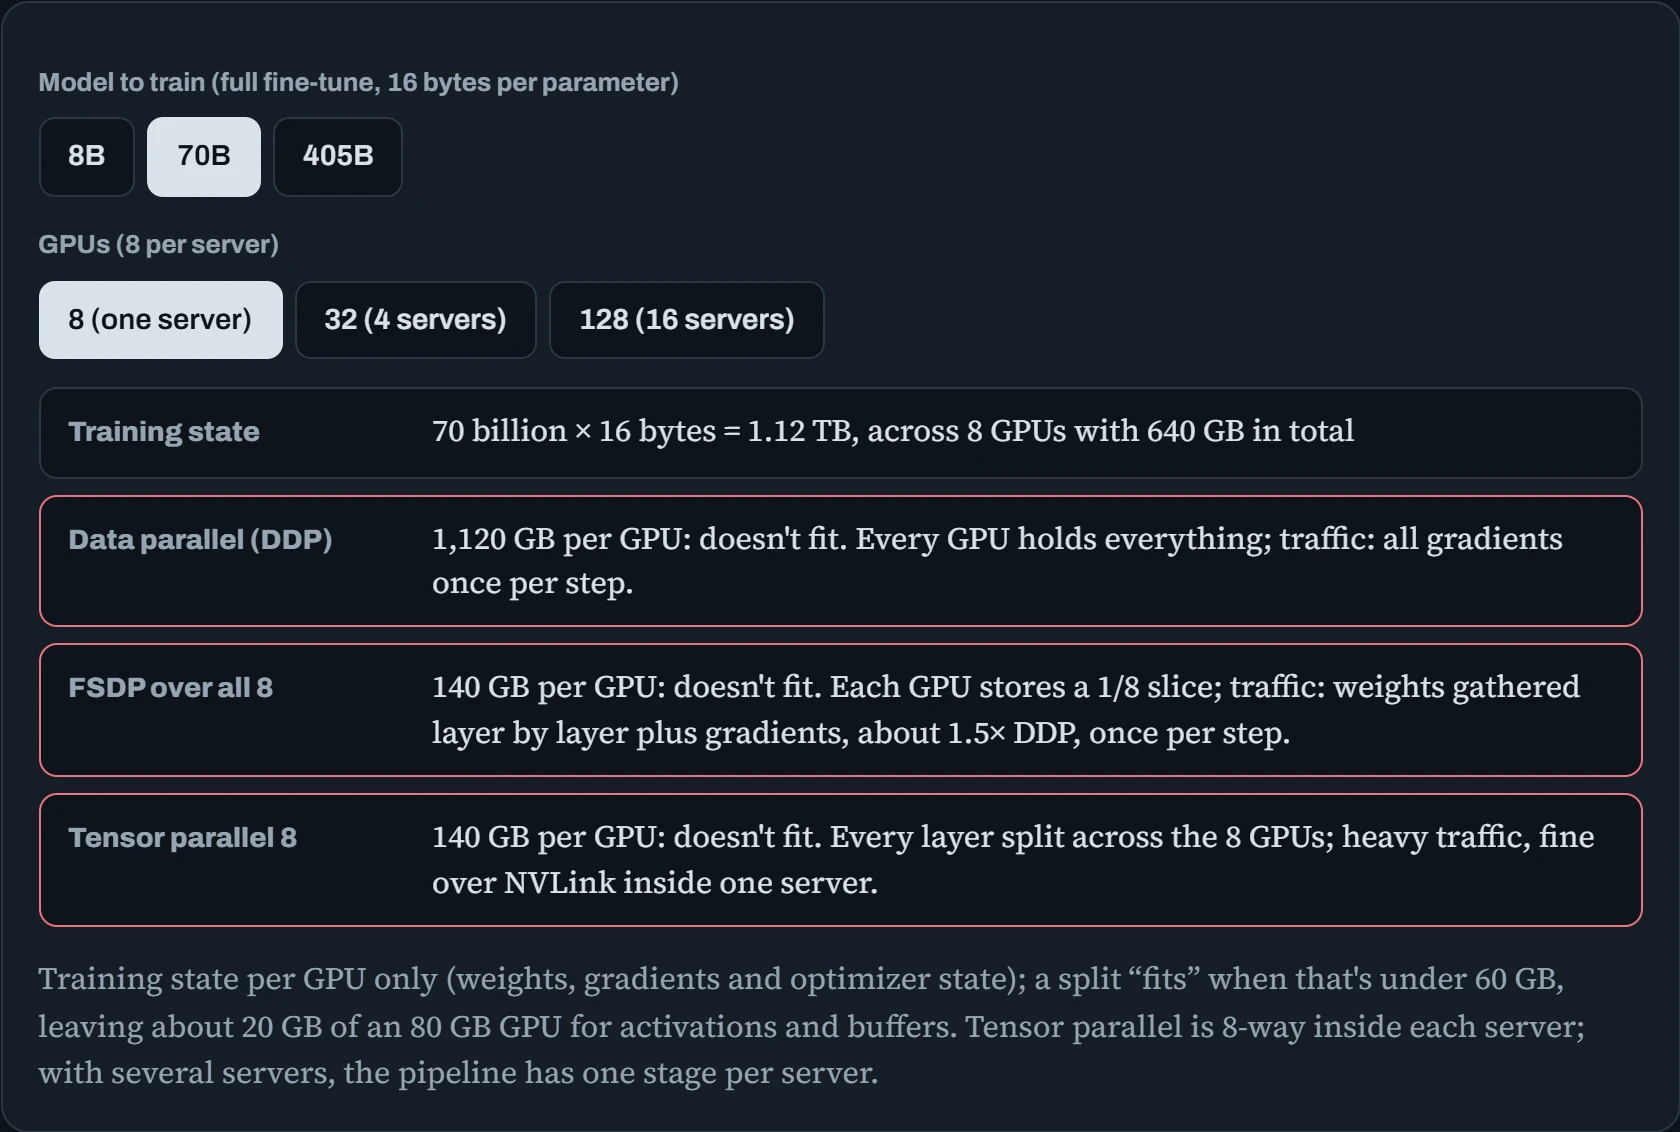
70B on one server: nothing fits, not even with every trick, because 70 billion × 16 bytes is 1.1 TB and eight GPUs hold 640 GB. On four servers, FSDP and tensor-plus-pipeline both fit. That's the real reason big fine-tunes go multi-node: memory first, speed second. And the moment a job crosses servers, every byte of the “talks once per step” traffic goes over the network this lesson is about.
Predict. To fit a model, someone sets tensor parallelism to 16 across two 8-GPU servers joined by 400 Gb/s InfiniBand. It runs. Is it fast?
Answer. No, usually painfully slow. Tensor parallelism exchanges results inside every layer, many times per step. Inside a server those go over NVLink at hundreds of GB/s. Between servers, 400 Gb/s is about 50 GB/s, many times slower, and every layer waits for it.
Keep tensor parallelism at 8 (inside each server) and split across servers with pipeline or data parallelism (FSDP), which send far less data, far less often.
What every step has to move
The most common way to share training across GPUs is simple. Every GPU holds a full copy of the model, and each one trains on its own slice of the batch of data. This is called data-parallel training. Each GPU then works out how the model should change (the backward pass), and because each saw different data, each ends up with different corrections, called gradients. Before anyone updates the model (the optimizer step), every GPU needs the average of all of them. Combining everyone's numbers and handing every GPU the result is called an all-reduce, and it happens every single step.
How much data is that? One gradient number for every parameter, meaning every adjustable number in the model. A model with 3 billion parameters, stored in bf16 (2 bytes per number), has 6 GB of gradients, on every GPU, every step.
The obvious approach is to send everything to one GPU, add it up and send it back. But then the whole cluster waits on that one GPU's connection. The approach NCCL uses most often is a ring: with N GPUs, split the gradient into N chunks, pass the chunks around a circle, and add them up as they go.
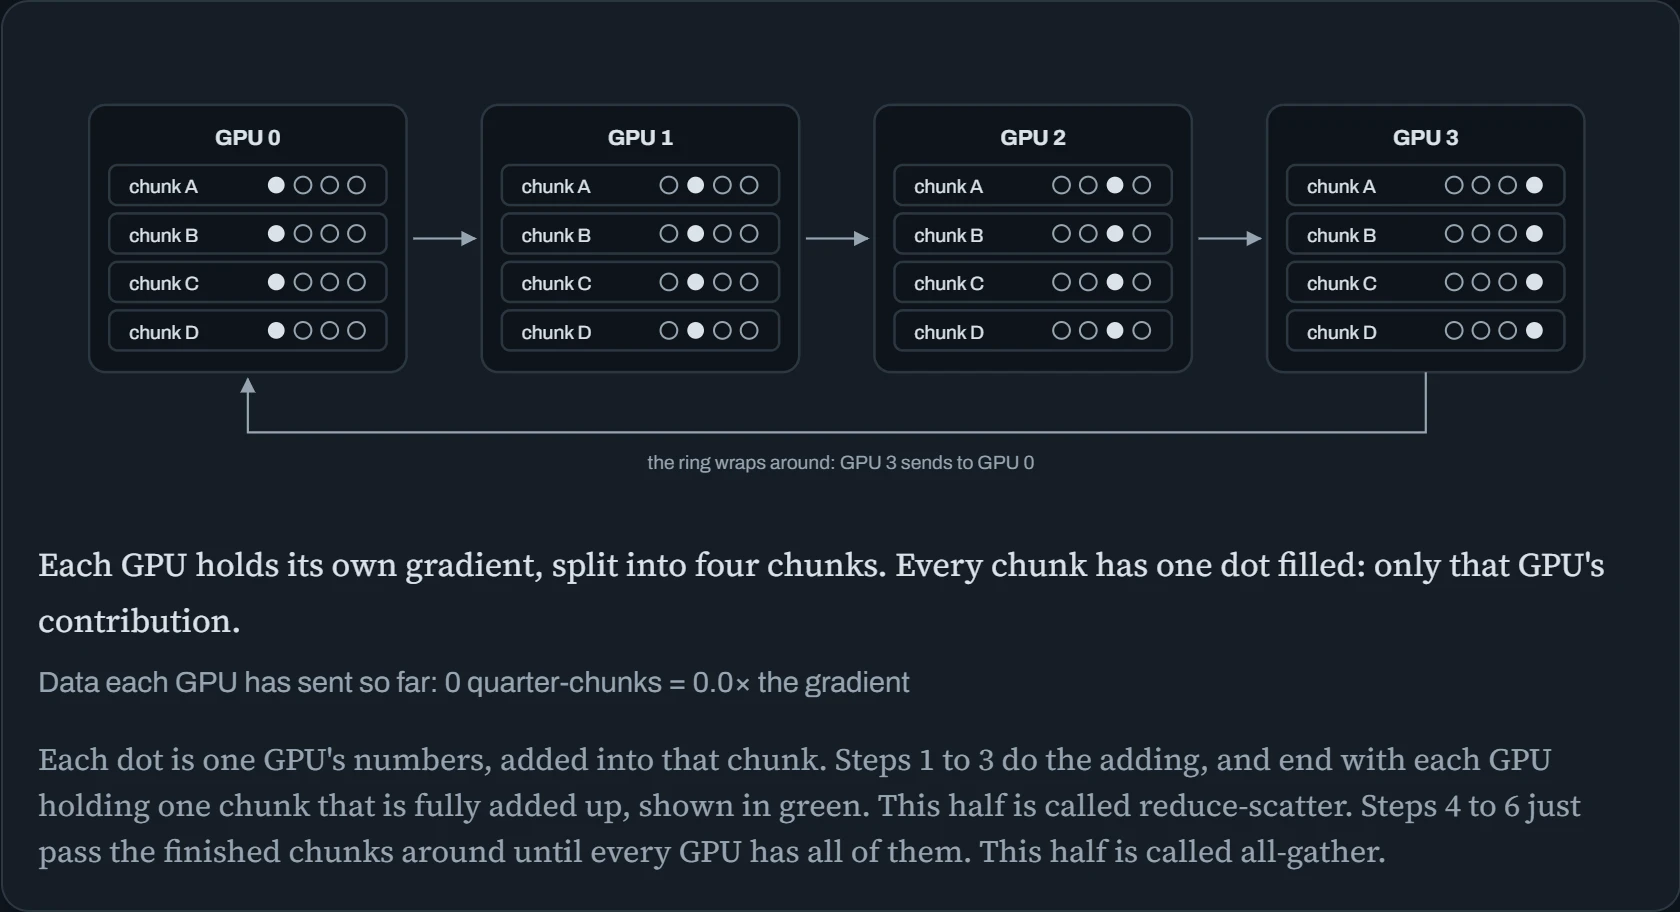
Think of four people who each wrote a long list of numbers and need the totals, line by line. Each splits their list into four parts. On every turn, each passes one part to the person on their right, who adds it to their own.
Below, each large box is one GPU holding its gradient in four chunks, A to D.
The four dots on a chunk show whose numbers are already added into it, one dot per GPU. The pink arrows show which chunk each GPU sends, and GPU 3 passes back around to GPU 0.
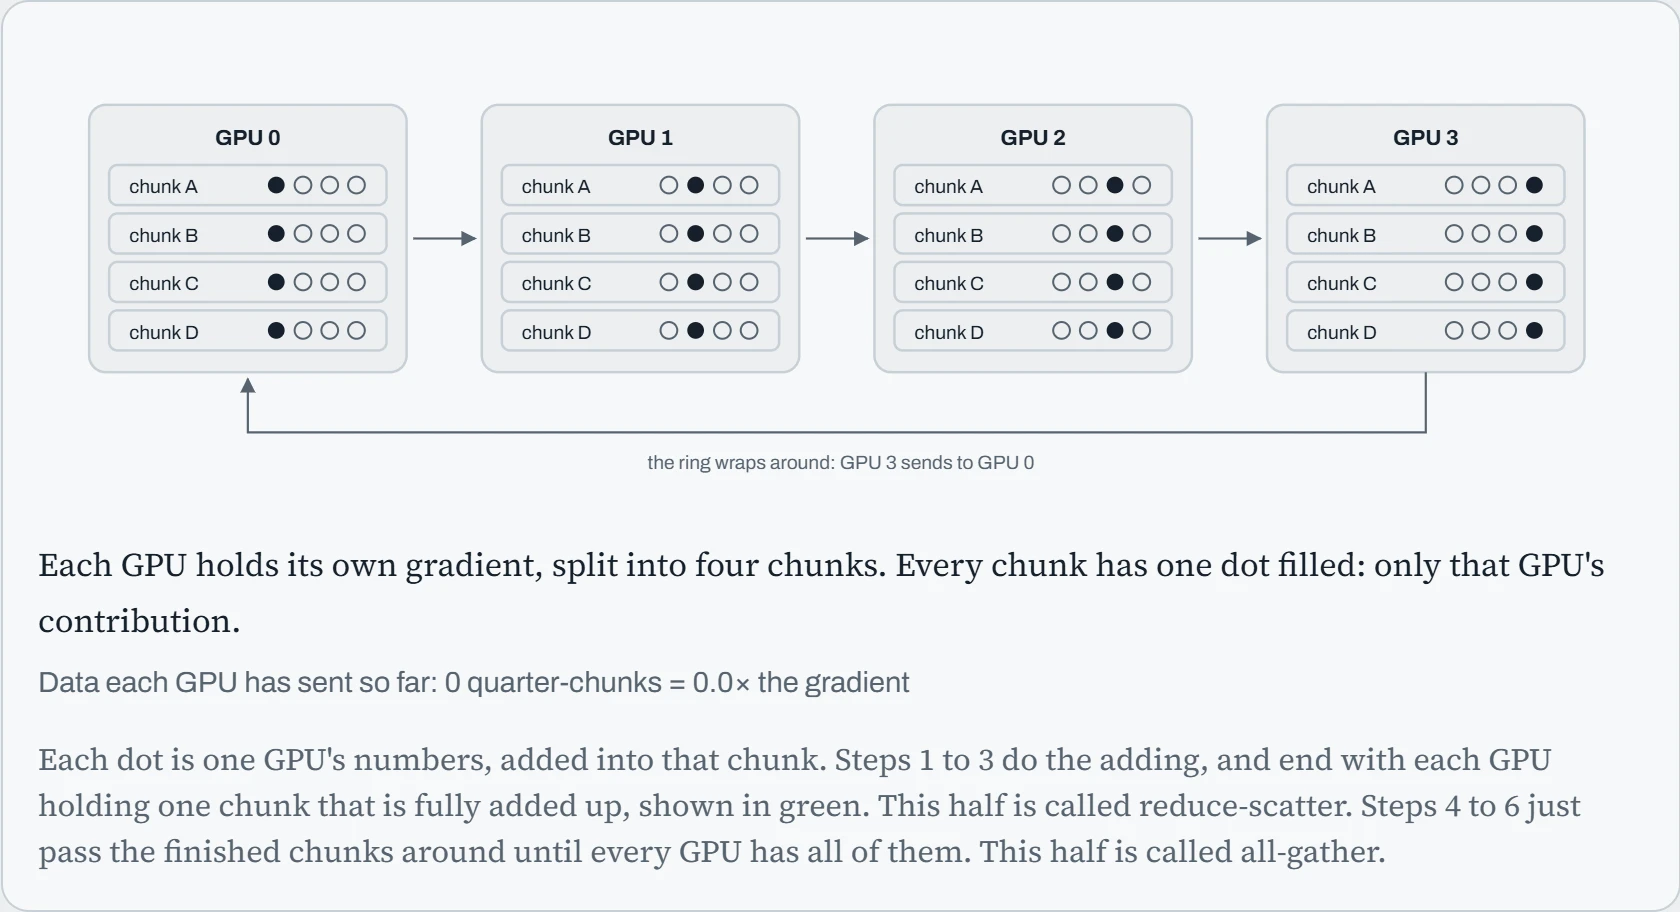
Step 1 of 7
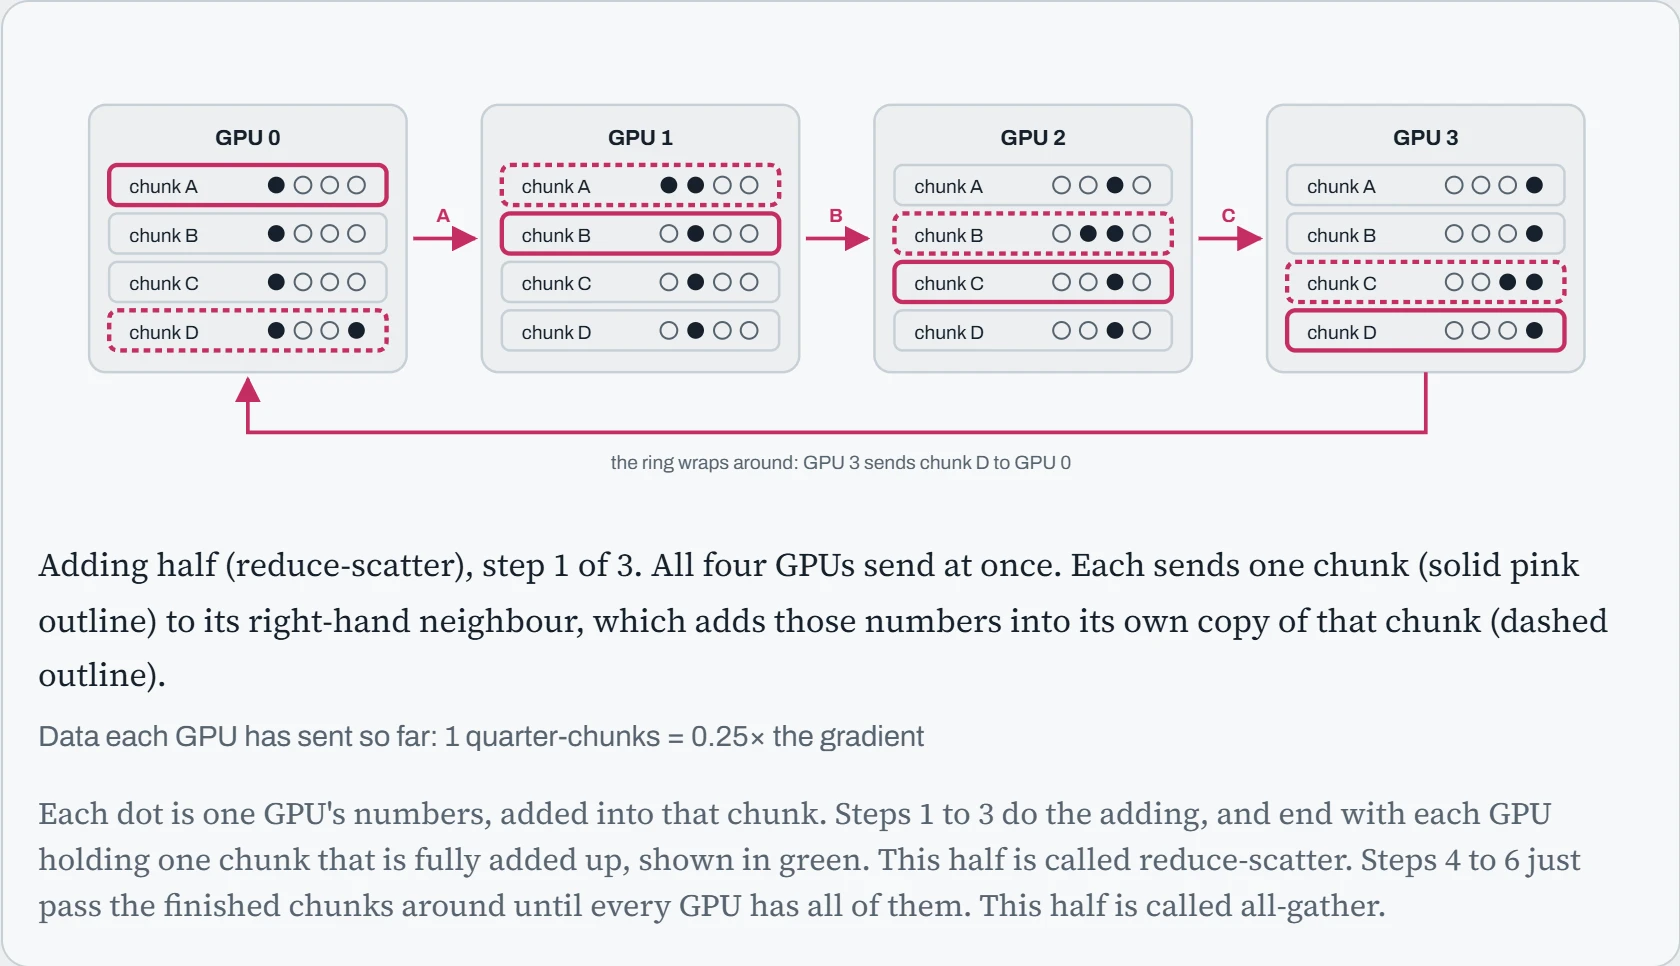
Step 2 of 7
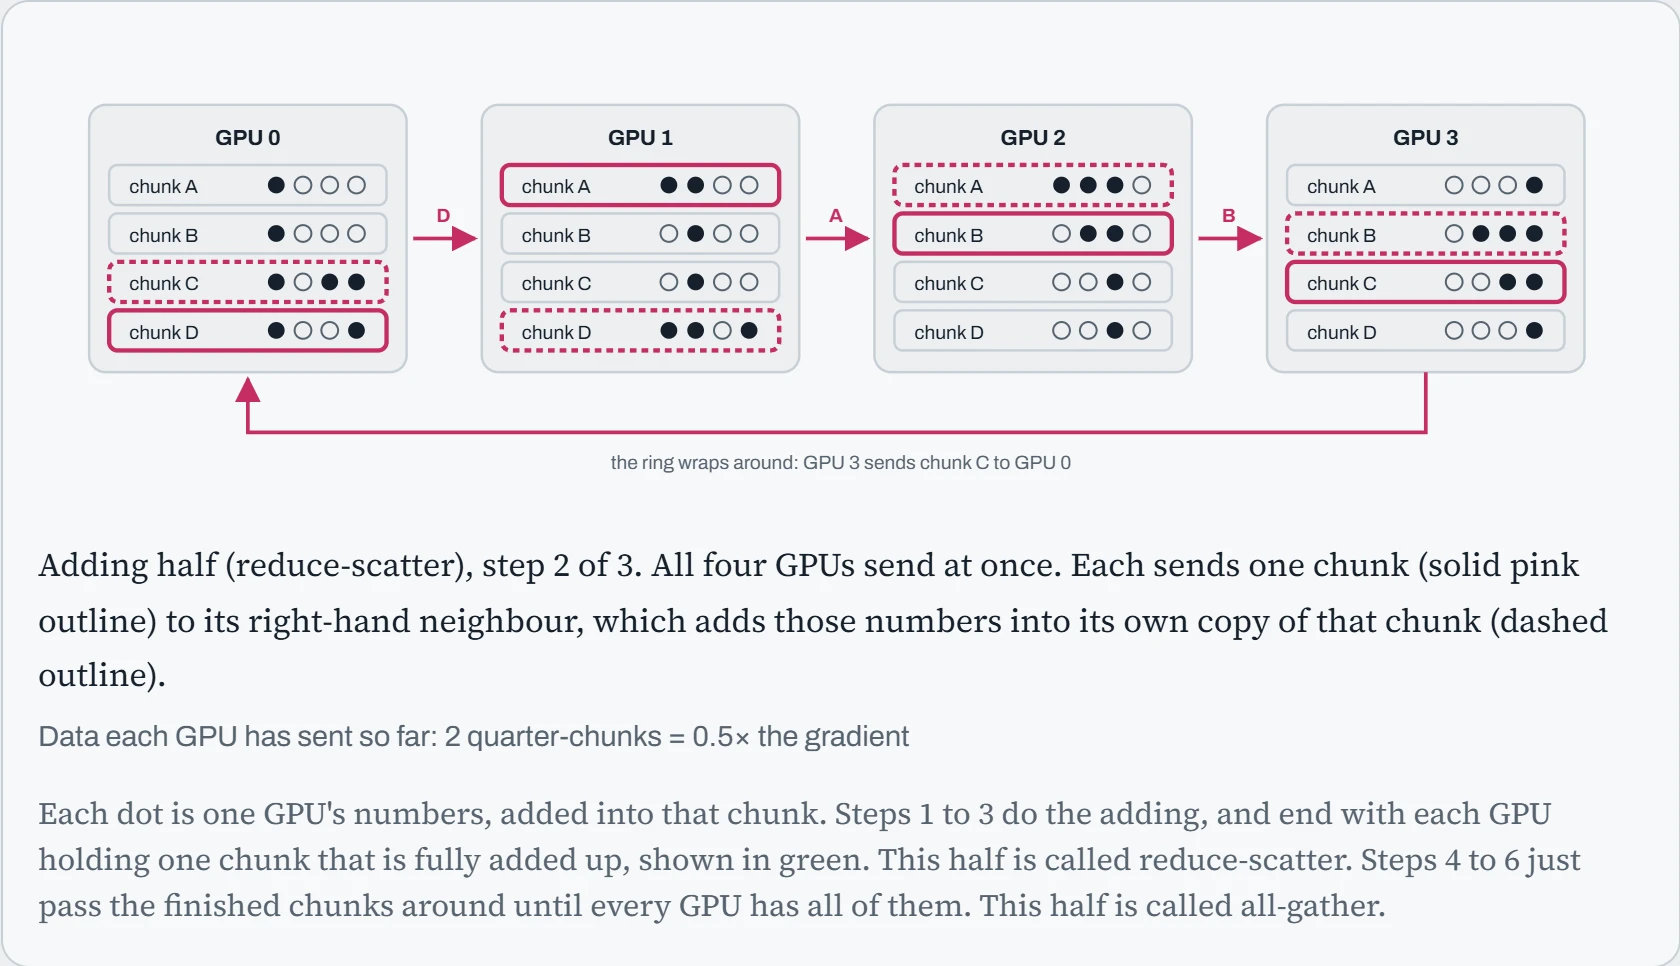
Step 3 of 7
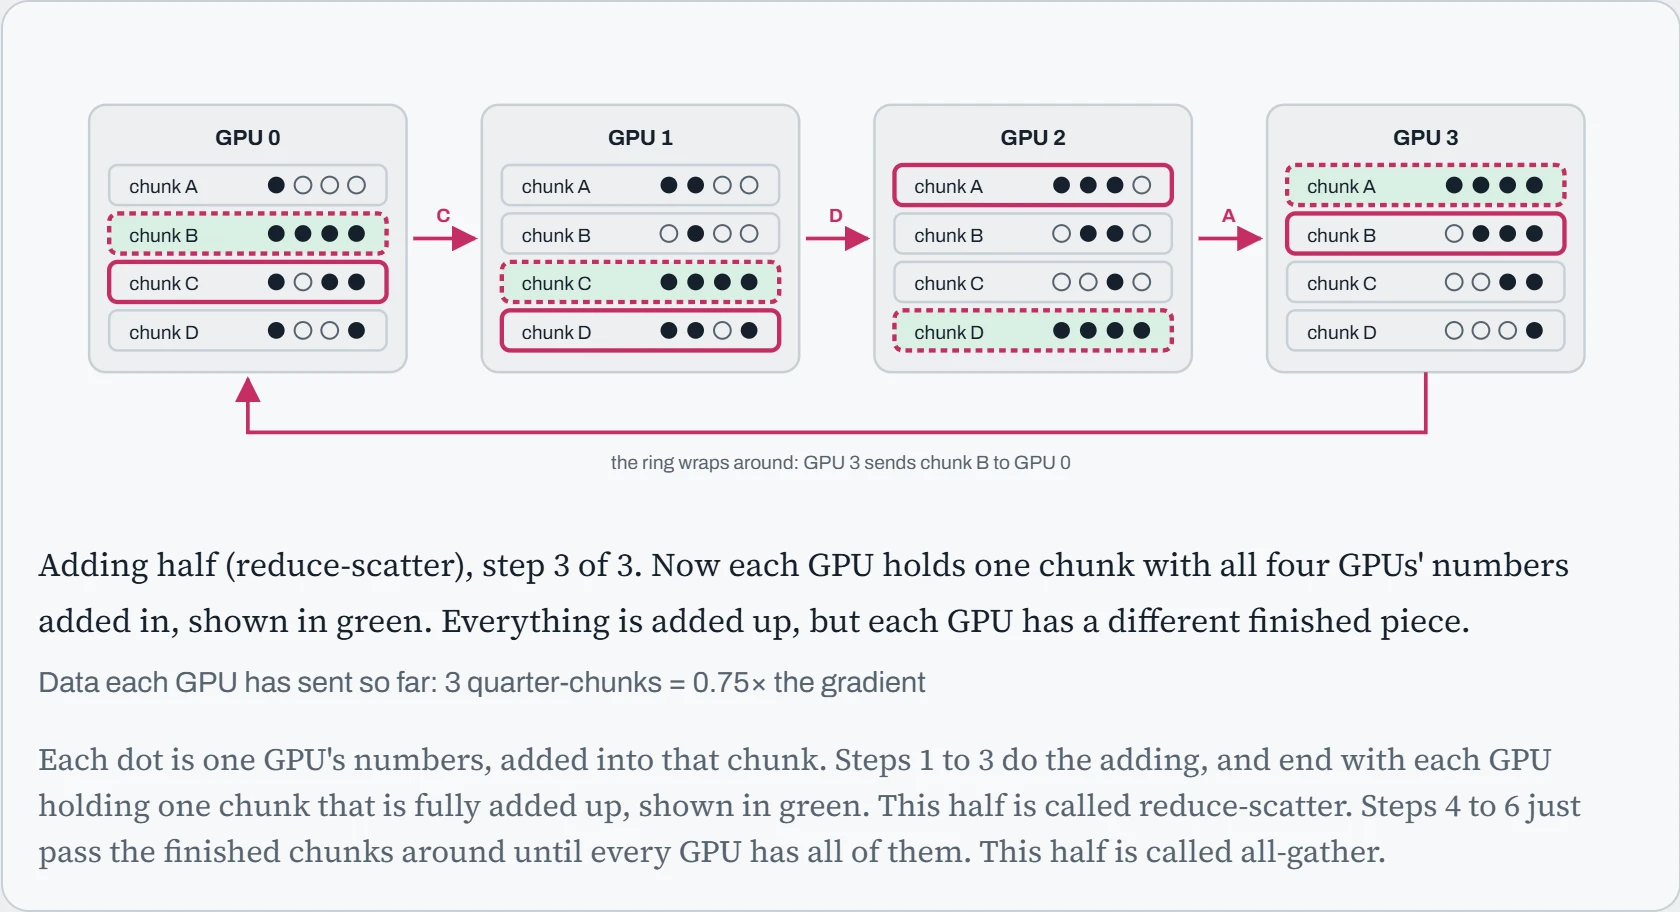
Step 4 of 7
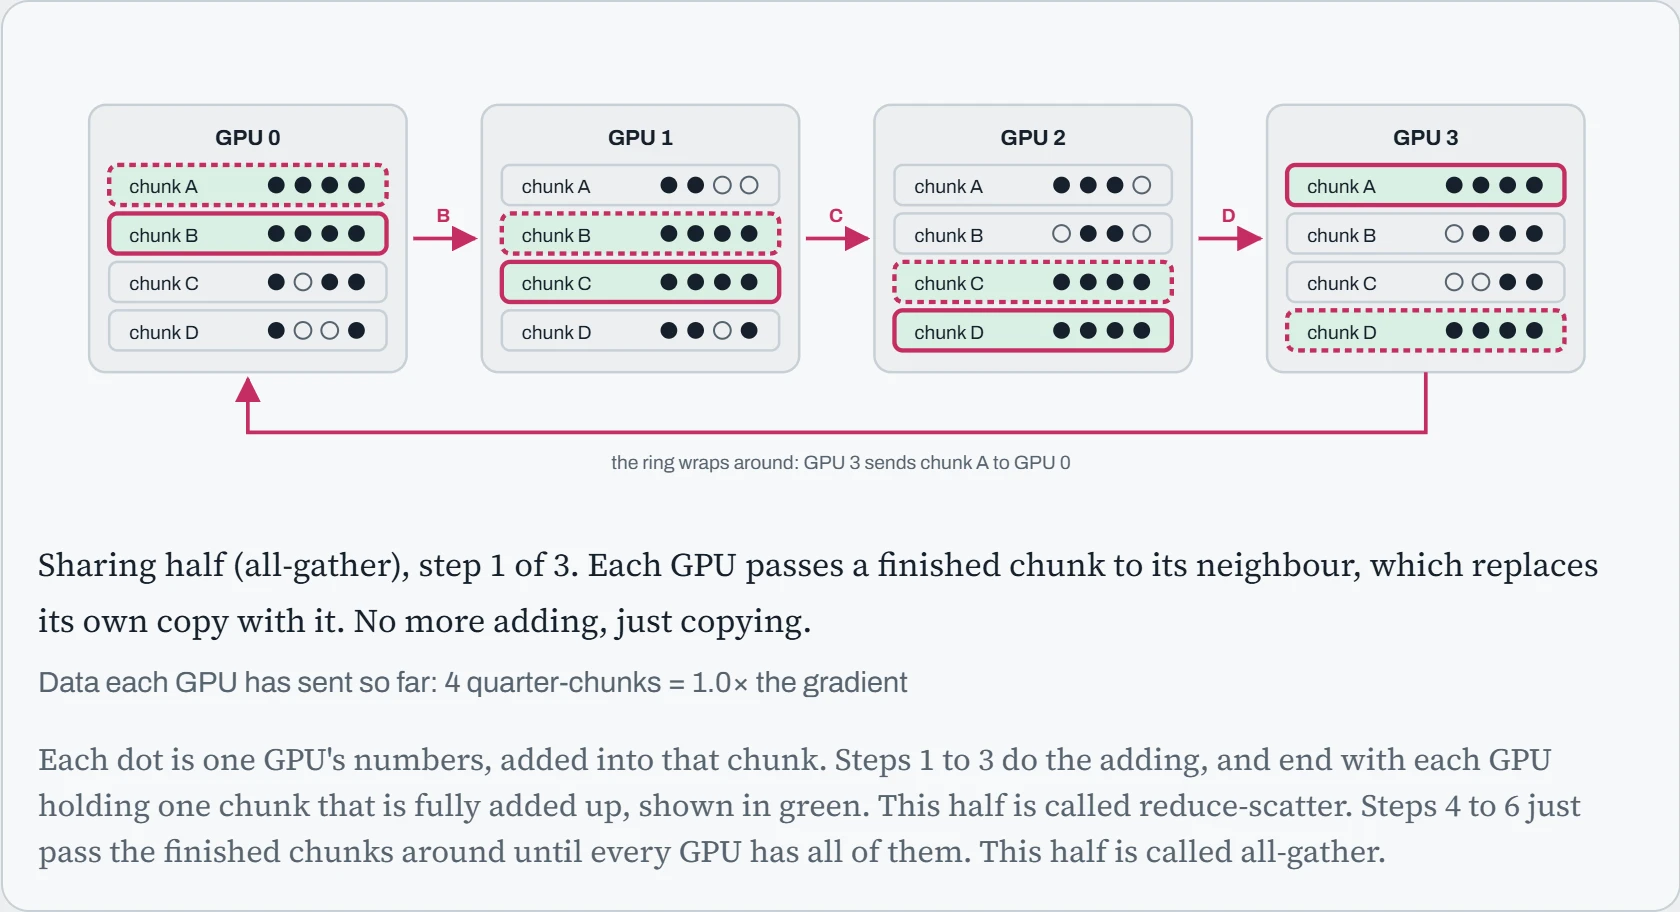
Step 5 of 7
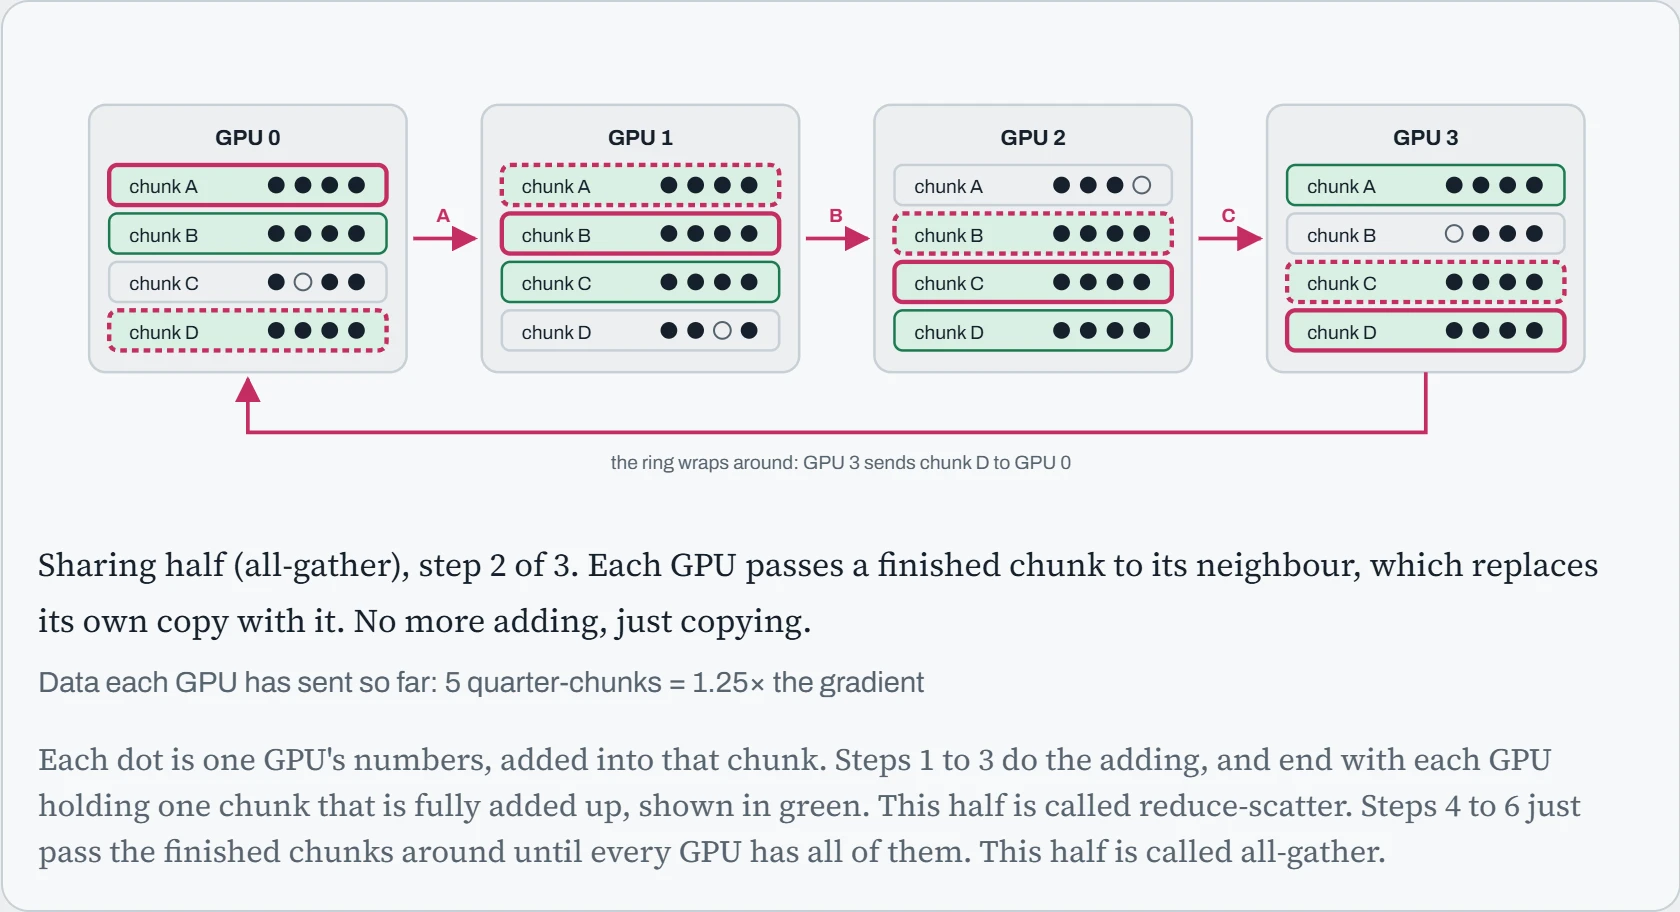
Step 6 of 7
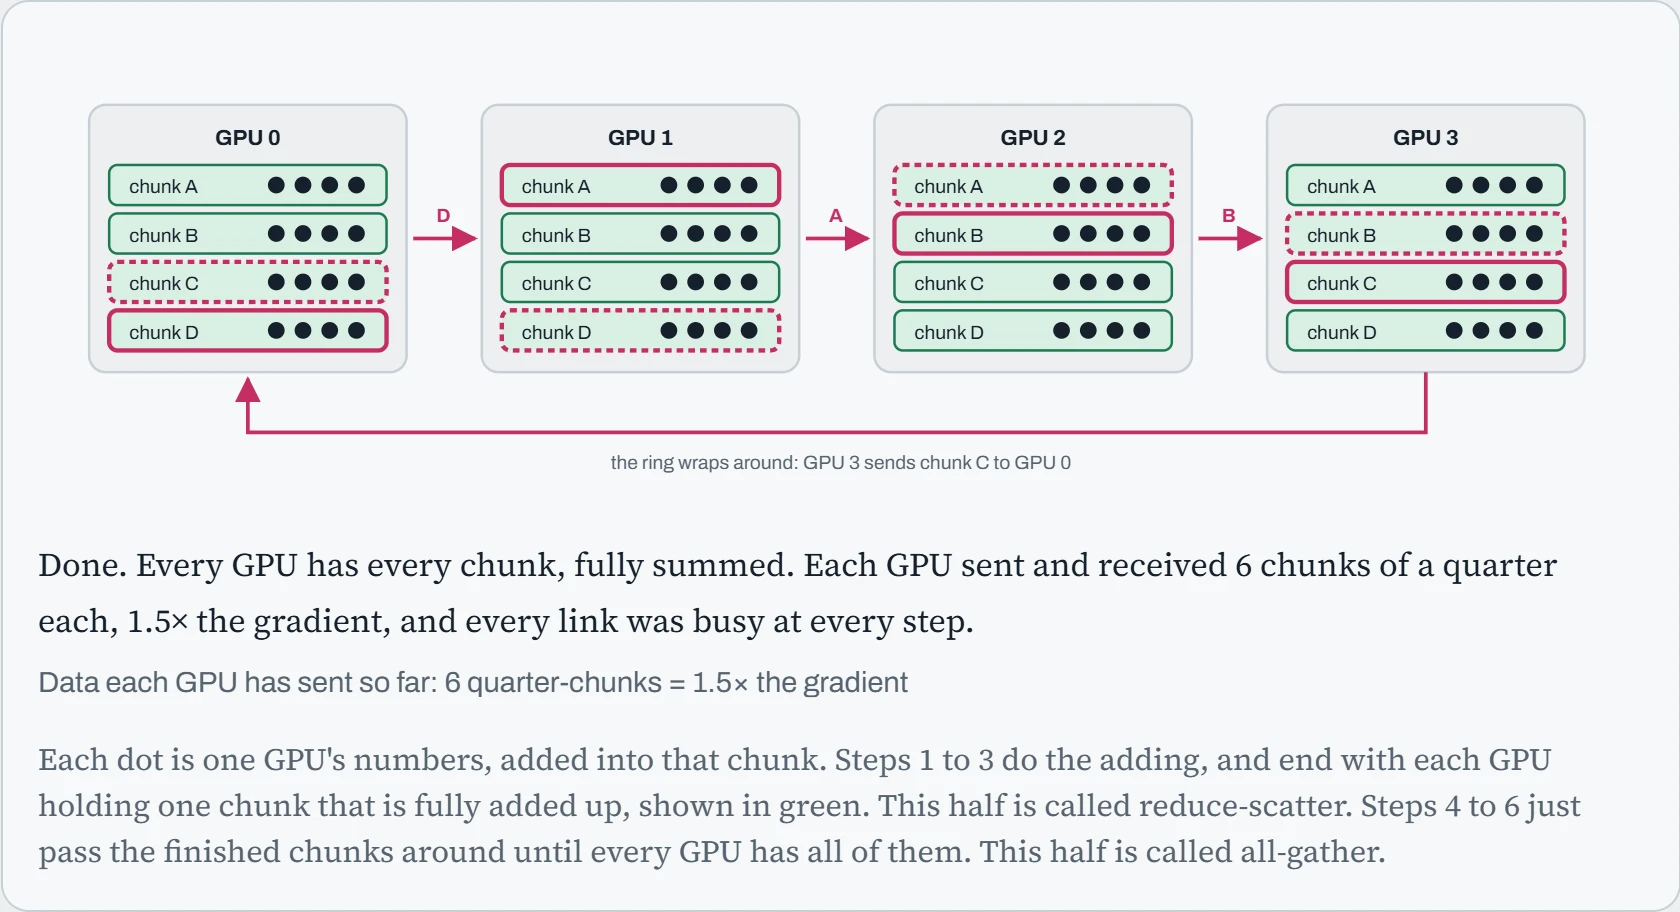
Step 7 of 7
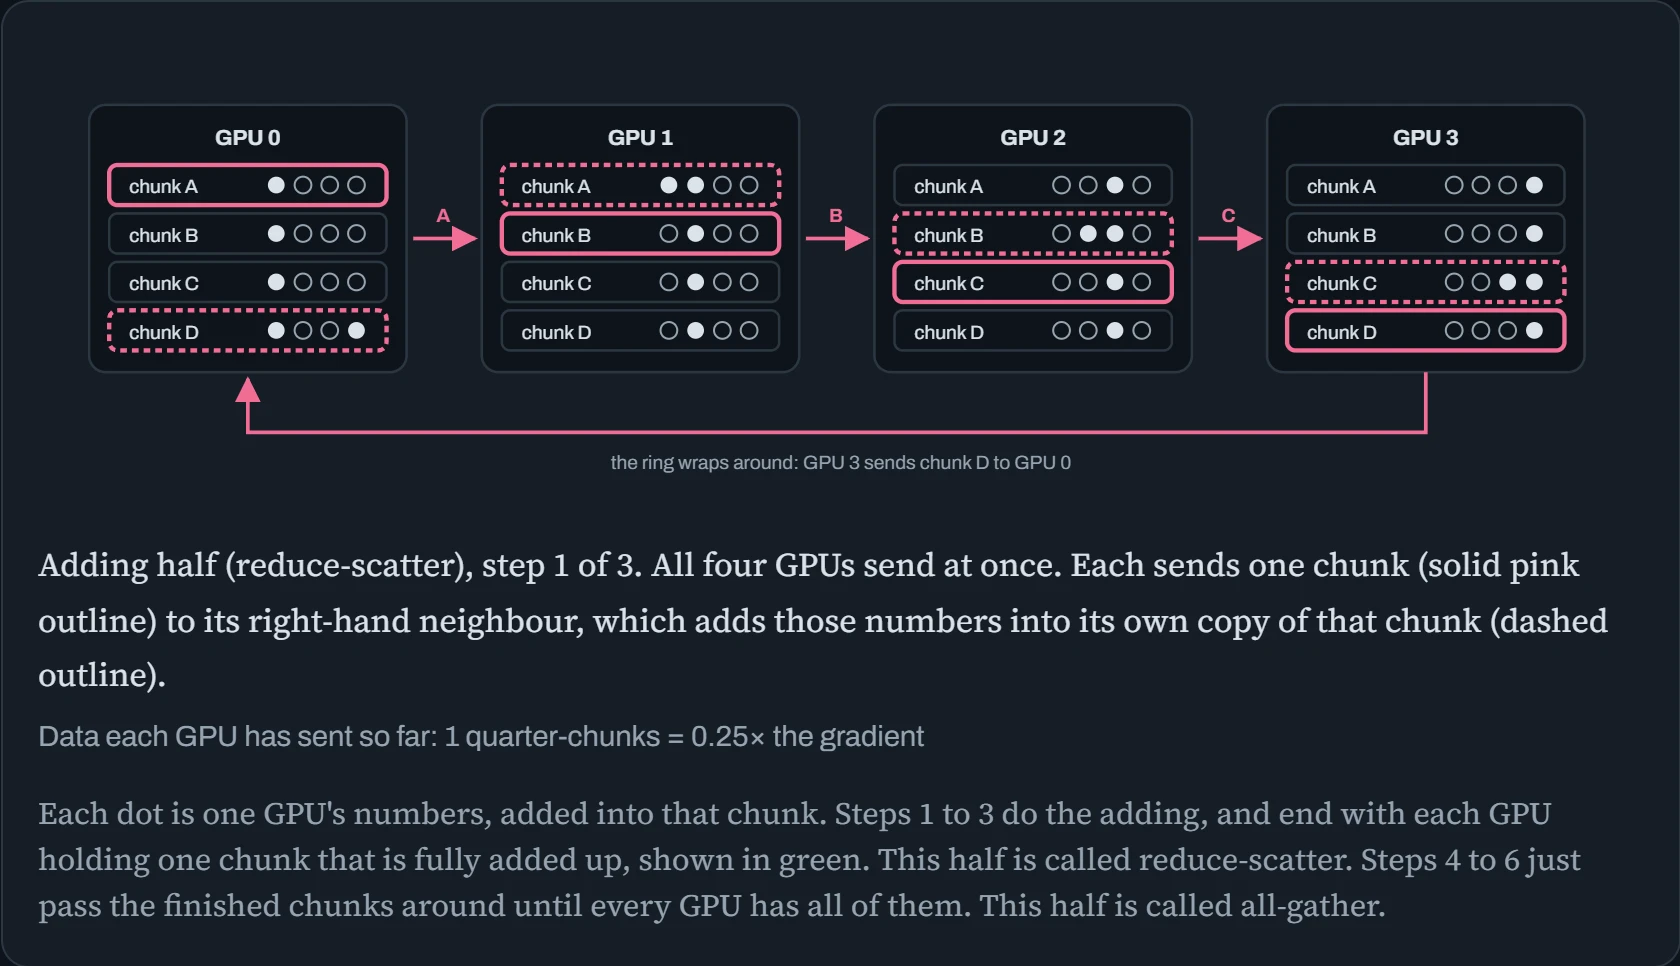
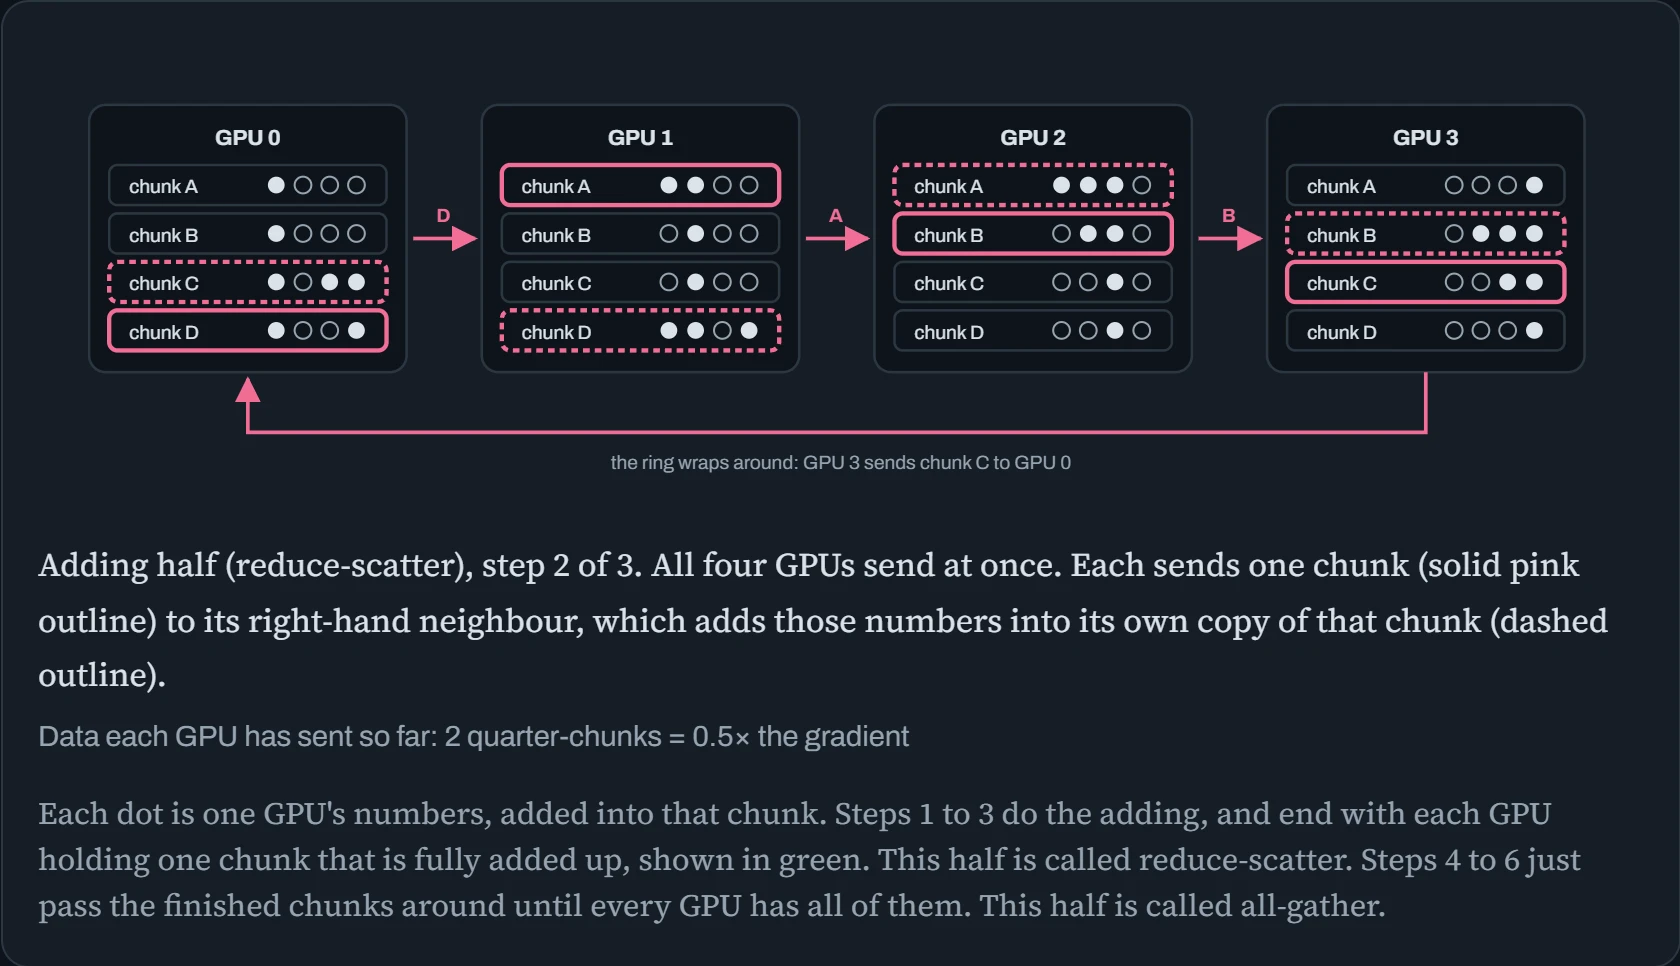
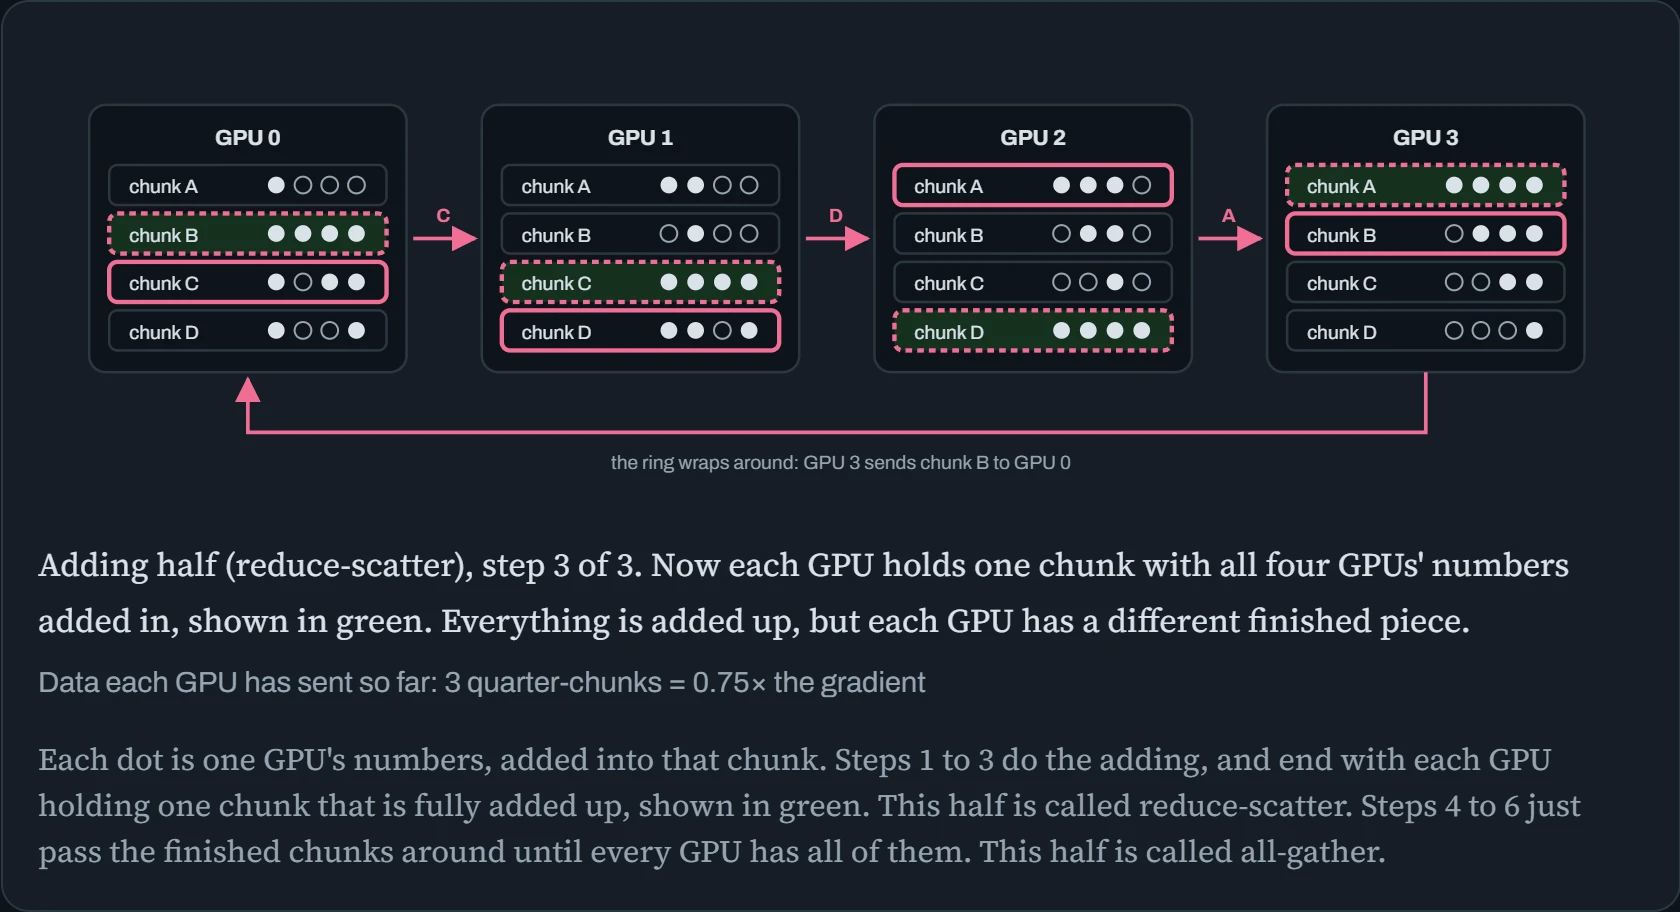
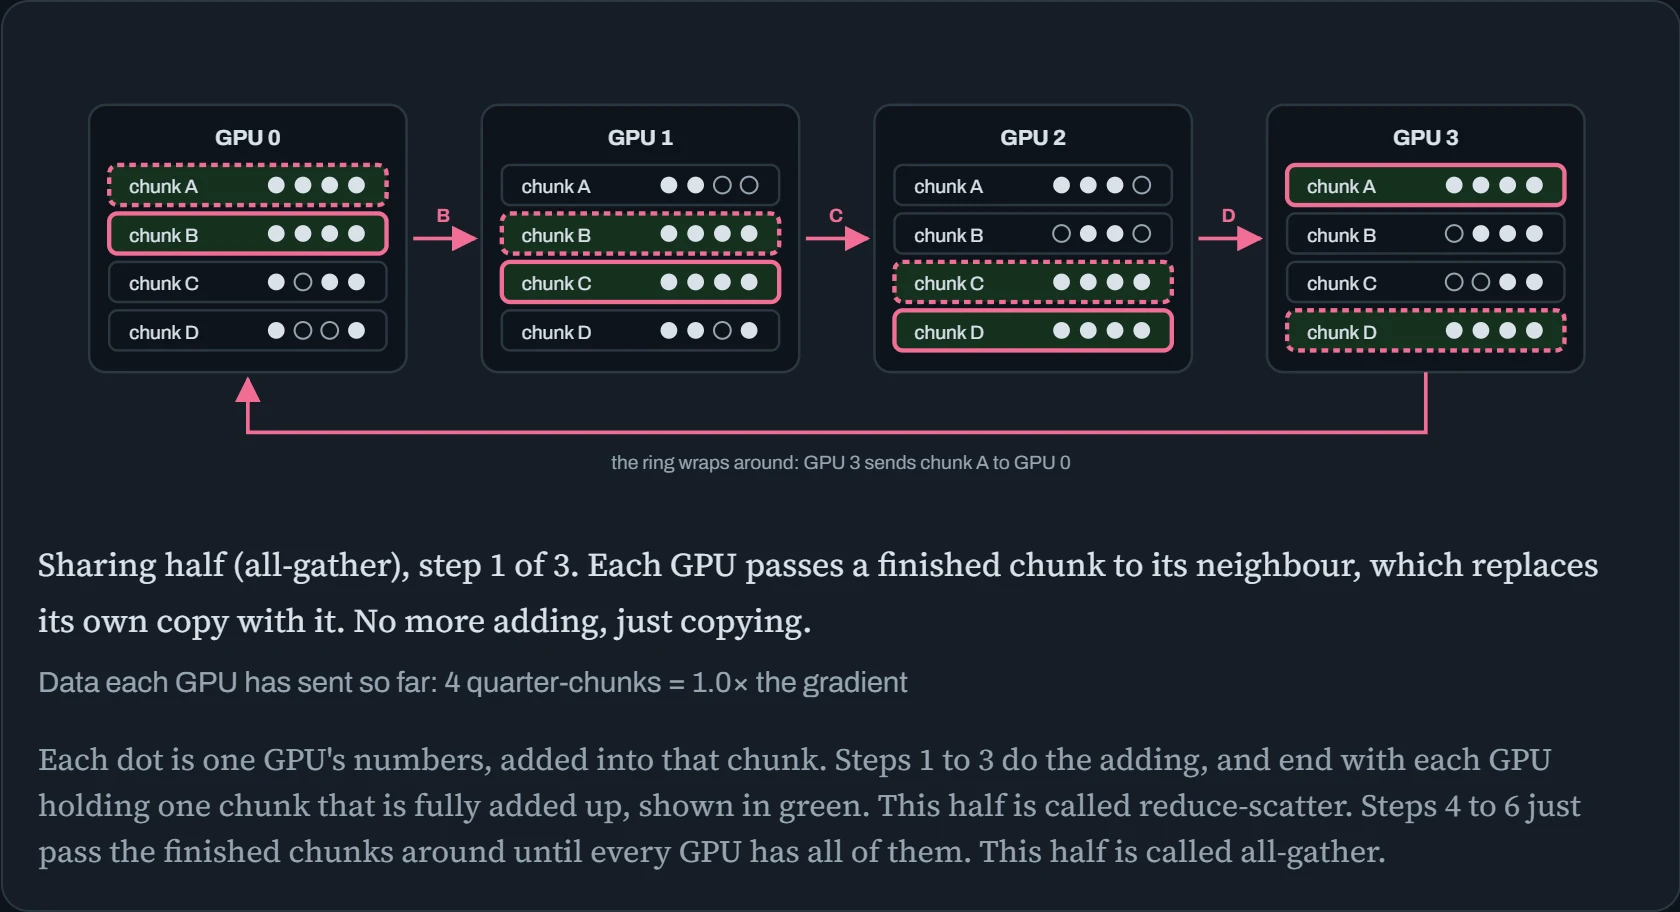
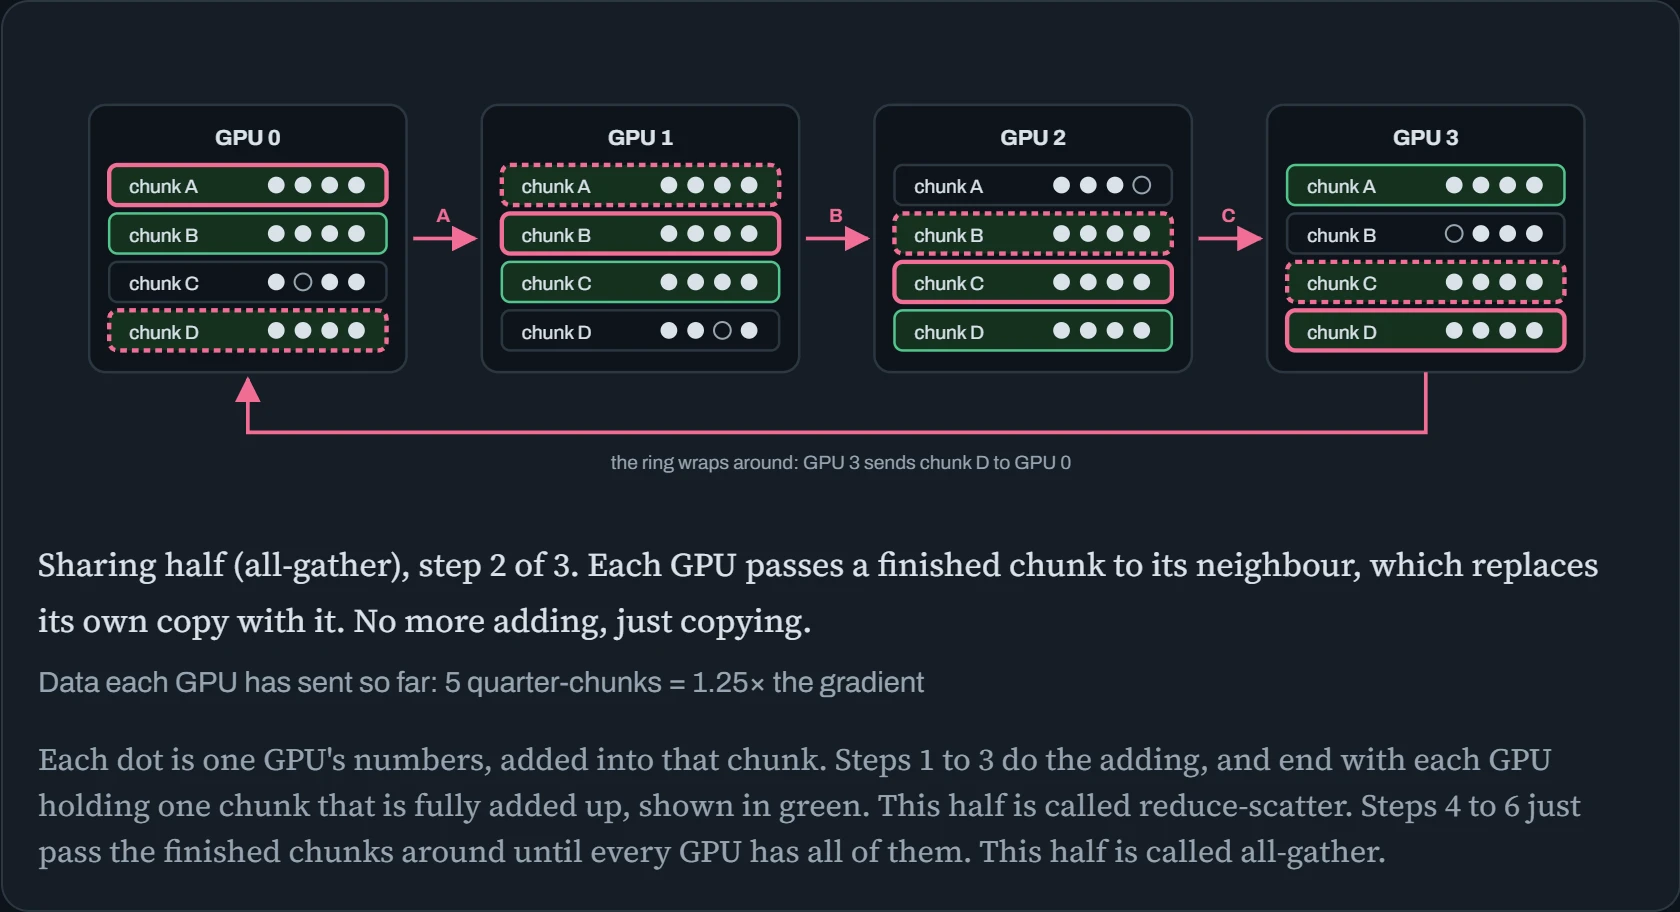
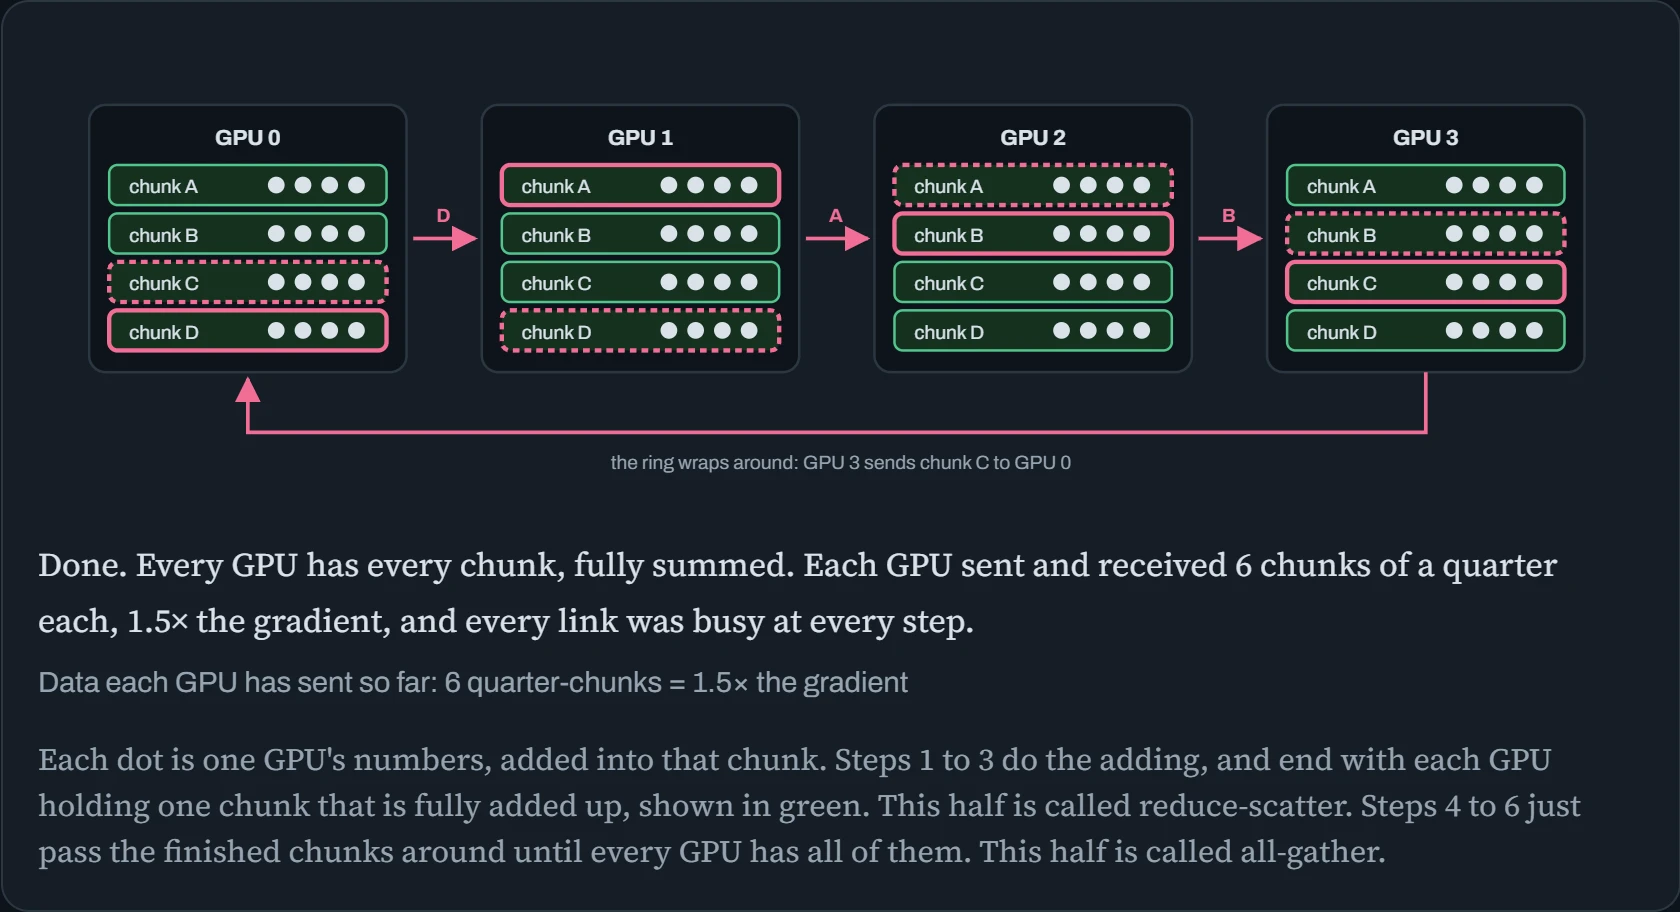
Look at the counter under the diagram. Every GPU sent something on every step, so no link ever sat idle. And by the end, each GPU had sent only 1.5 times its own gradient.
Predict. Each GPU sent six quarter-size chunks, so 1.5× the gradient in total. With 64 GPUs instead of 4, does each GPU send more data, or less?
Answer. Almost exactly the same. With N GPUs, each one sends 2(N−1)/N times its gradient: 1.5× for 4 GPUs, 1.97× for 64, and never more than 2×. More GPUs means more chunks, but each chunk is smaller, and the two cancel out. That's why the ring scales so well: adding GPUs doesn't add data per link.
What does grow is the number of steps, 2(N−1), and every step has a small fixed delay (latency), however little data it carries. So for small messages on lots of GPUs, NCCL switches to tree-shaped patterns that need fewer steps.
all-reduce time ≈ 2(N−1)/N × S ÷ B
That's the whole cost model. N is the number of GPUs, S is the gradient size, and B is bandwidth, meaning how many bytes per second a link can carry. S is fixed by your model, and N barely matters, as you just saw. B, the speed of the slowest link in the ring, decides everything. The rest of this lesson is about B.
Fast inside the server, slower outside it
B depends on where each link of the ring runs. Inside one server, GPUs talk over NVLink, NVIDIA's direct GPU-to-GPU connection. Between servers they go through network cards, and the two speeds are very different.
Network cards are sold in gigabits per second (Gb/s), while GPU links are quoted in gigabytes (GB/s). A byte is eight bits, so a 400 Gb/s card moves 50 GB/s.
The chart below puts every link in GB/s, one dot per link. The scale jumps by ten at each gridline, so the gaps are bigger than they look. Links above the dashed line stay inside one server, and links below it go between servers.
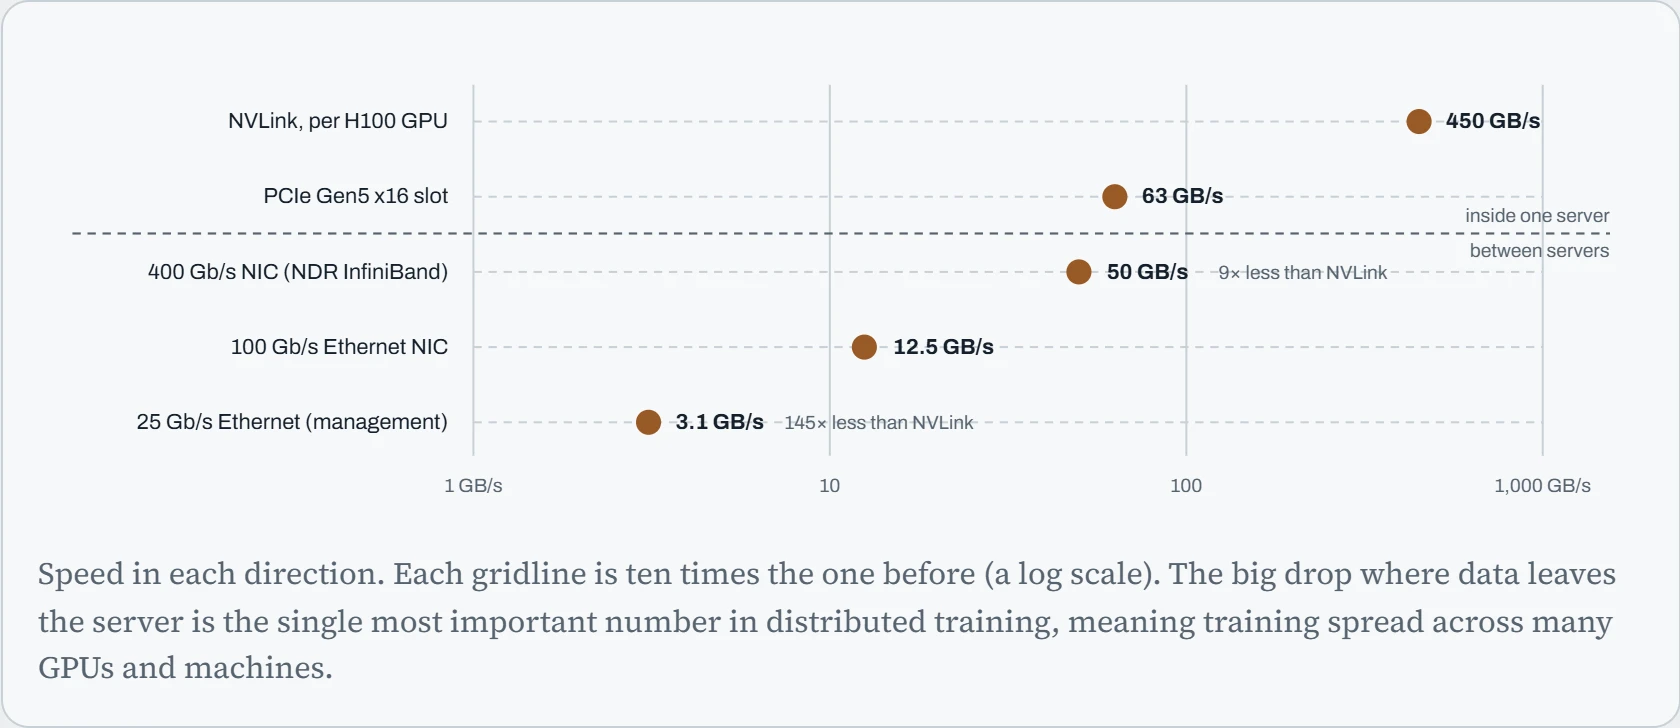
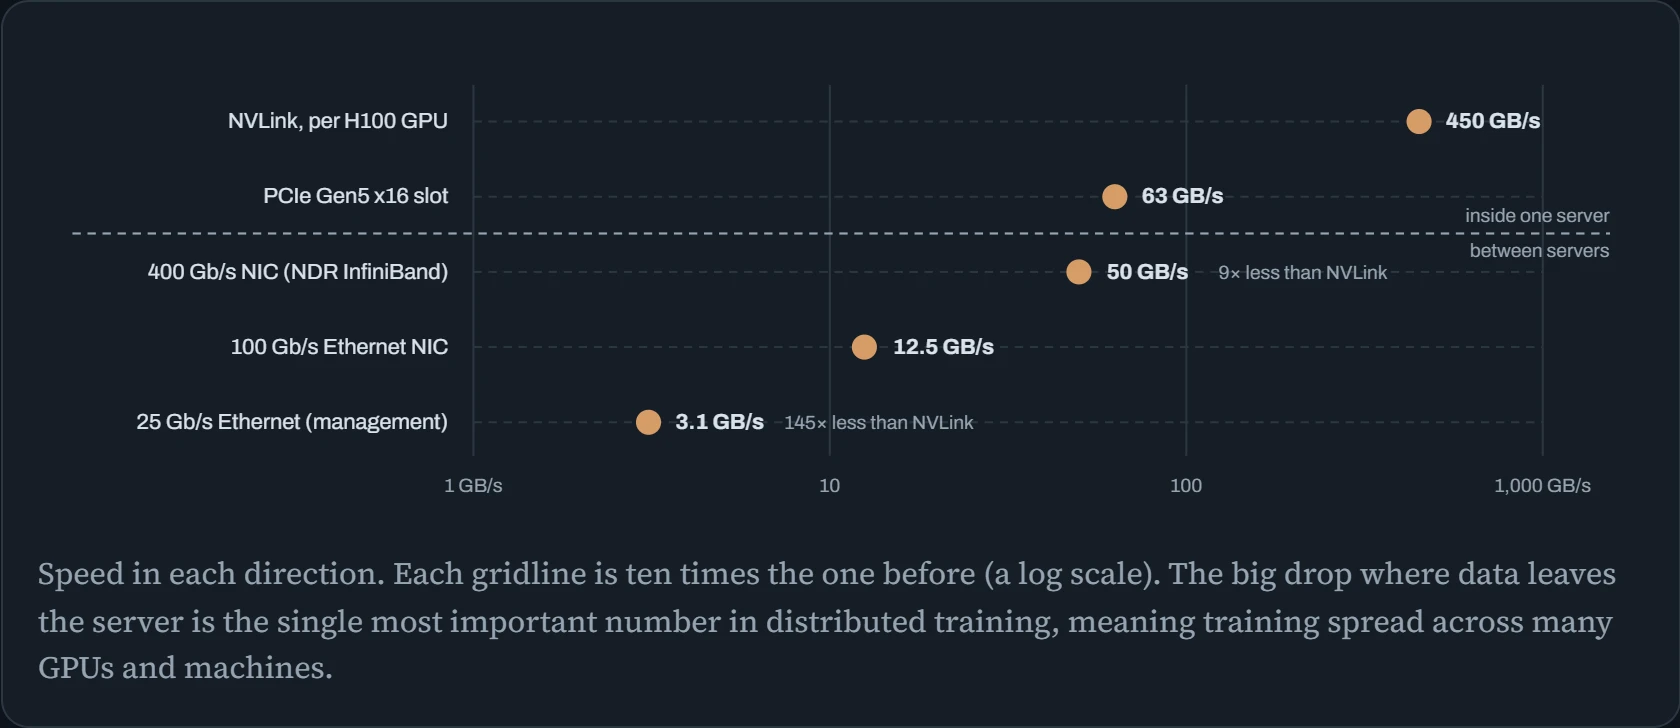
Put those speeds into the formula from the last section. On the 16-GPU job, a 6 GB gradient means each GPU sends about 11 GB per step. That takes about 25 milliseconds at NVLink's 450 GB/s, and over three and a half seconds at the opening job's 3.1 GB/s.
So big clusters are built to keep each GPU's network path as short and fast as possible. The usual design gives every GPU its own network card and wires the cluster in rails.
In the diagram below, each wide box is one server. Its eight GPUs share an NVSwitch, a chip that links every GPU to every other one. Each GPU also has its own network card (NIC) right below it.
Card 0 of every server plugs into the switch called leaf 0, card 1 into leaf 1, and so on. Each of those numbered columns is a rail.
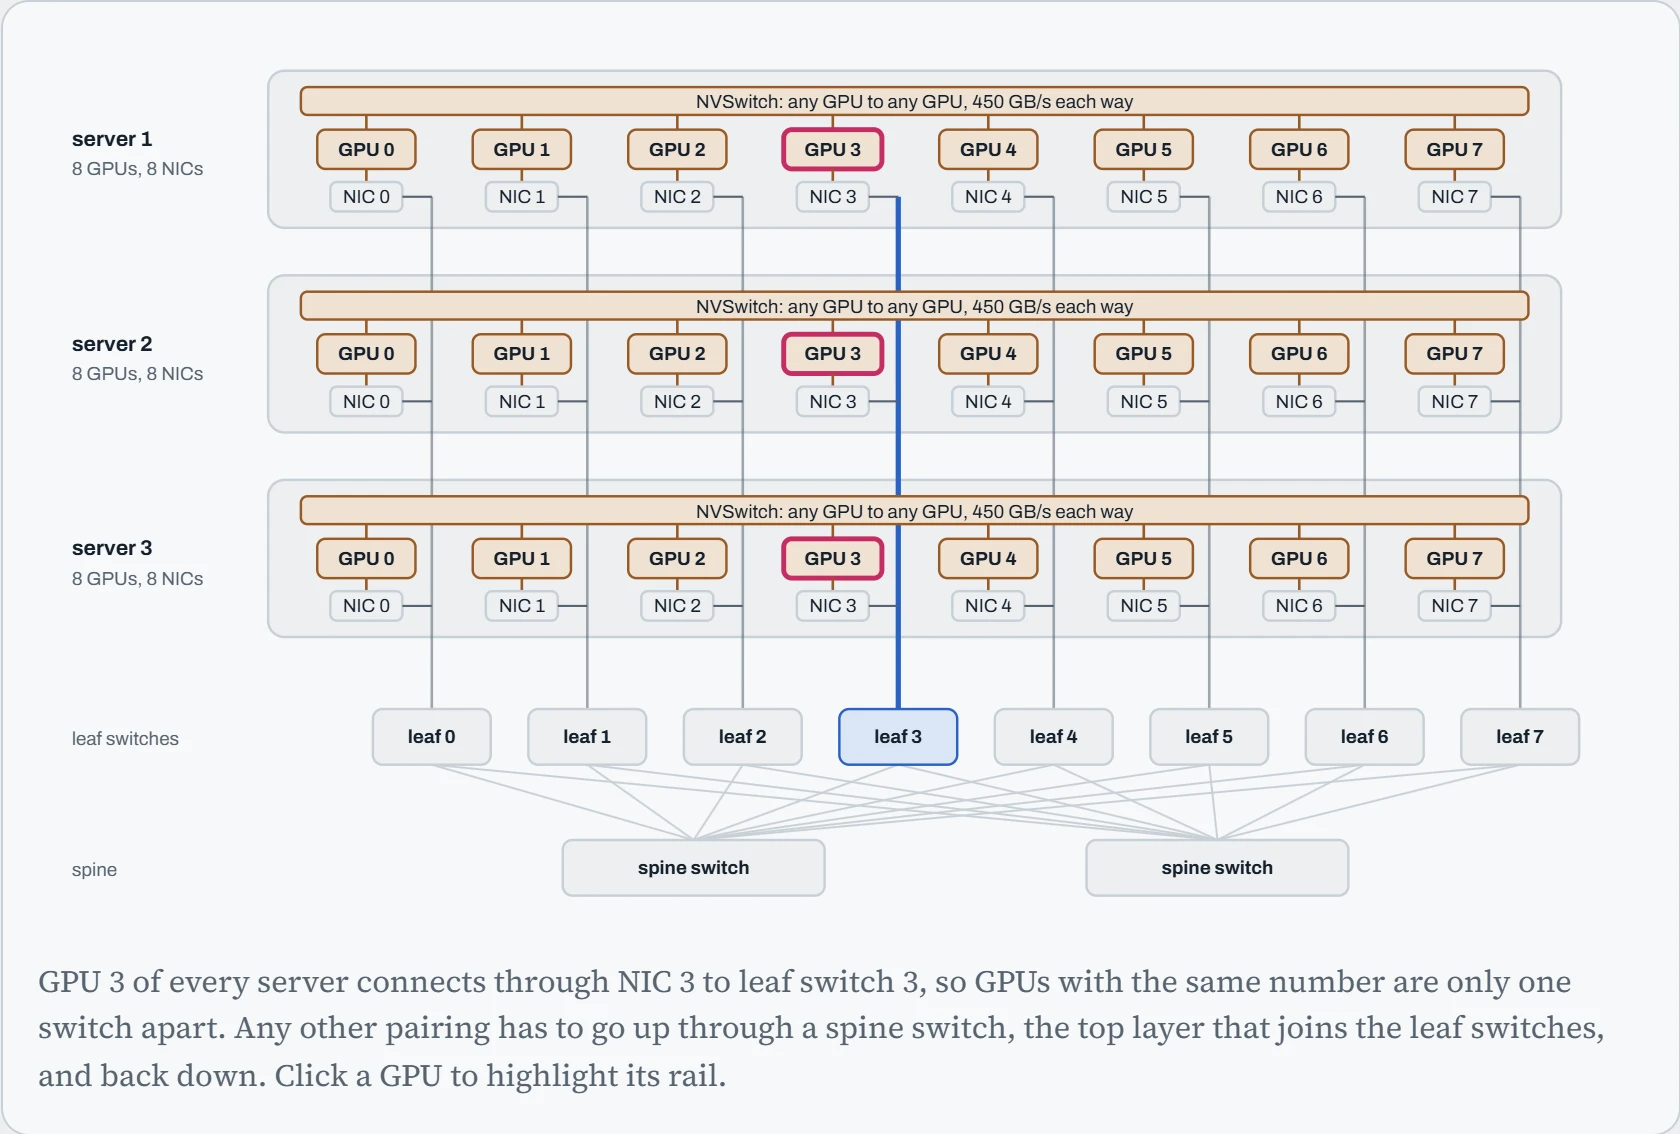
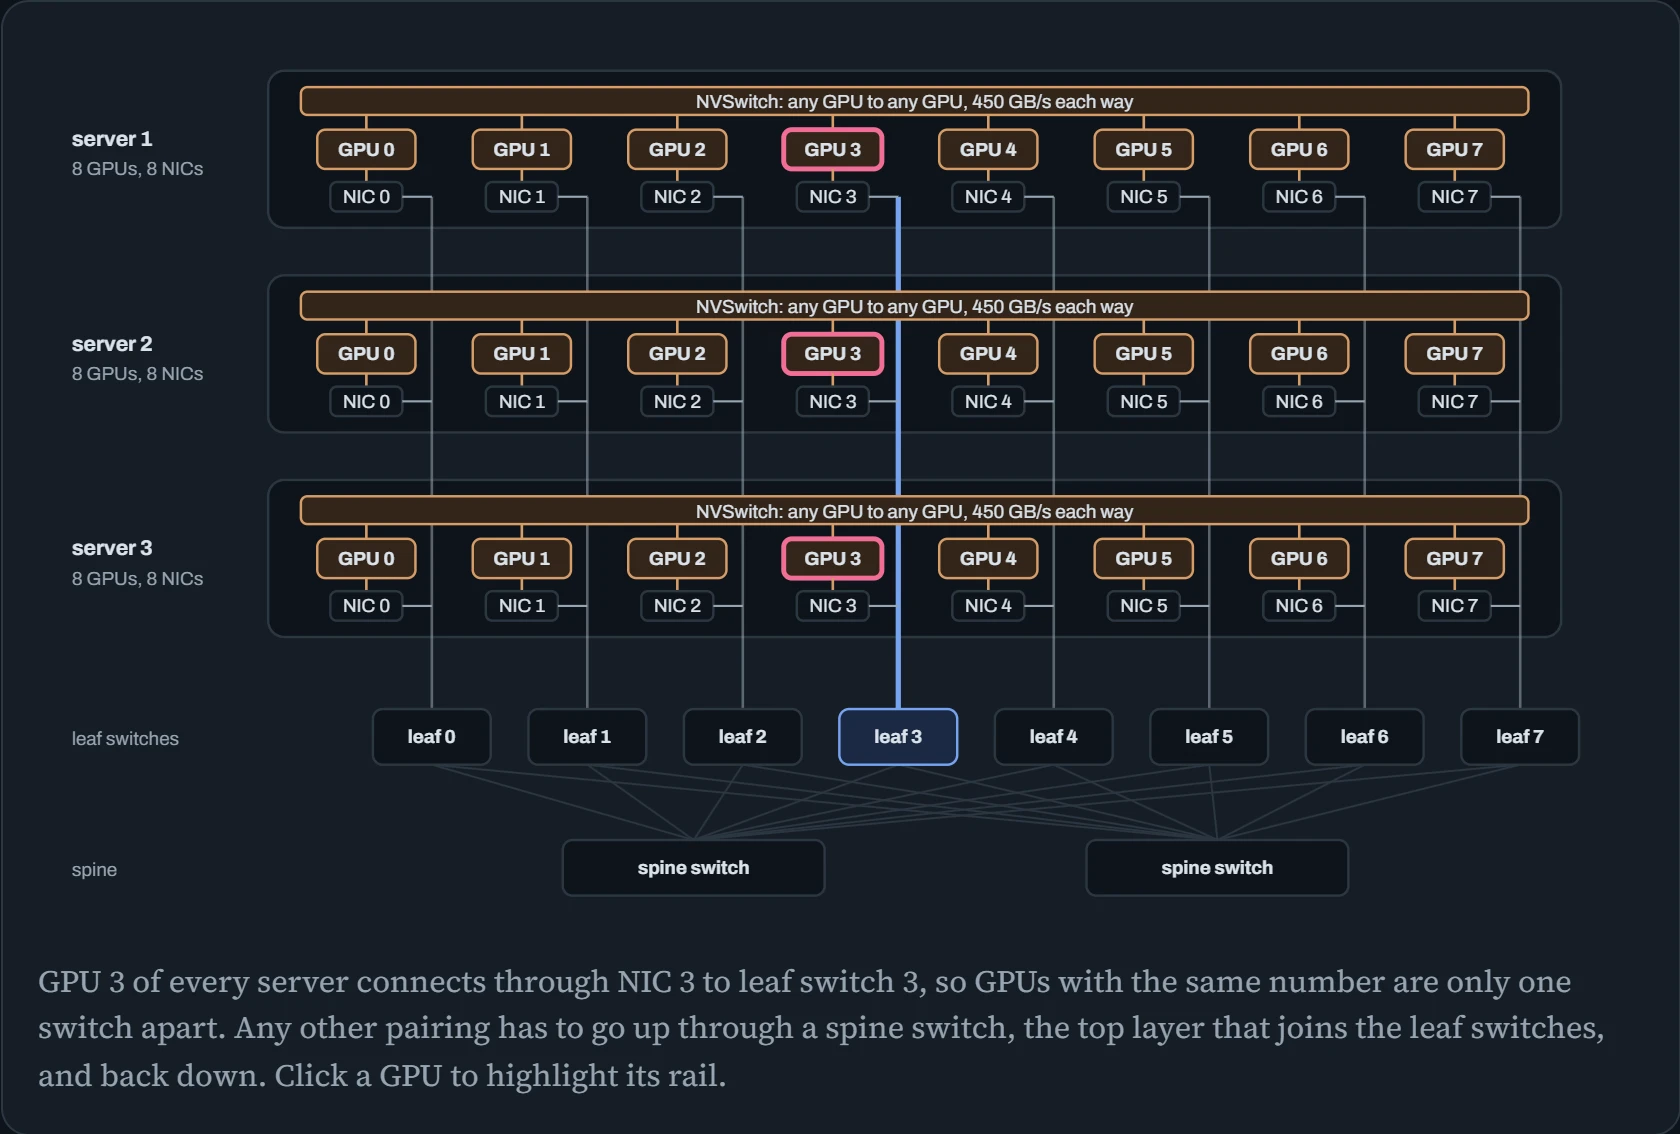
Think of each rail as a private lane between servers. GPU 3 on server 1 reaches GPU 3 on server 2 through one leaf switch, without going up to a spine. Keep that picture in mind for this question.
Predict. NCCL builds a ring for a 16-GPU job across two servers. How many times does that ring cross between servers?
Answer. Twice: once out of server 1 and once back. Every other hop stays on NVLink inside a server. NCCL runs several rings at once (it calls them channels), and each one leaves through a different NIC, so all eight cards carry traffic at the same time.
With eight 400 Gb/s NICs per server, that adds up to roughly 400 GB/s of all-reduce bandwidth per server. That's in the same league as NVLink inside a single box, which is the whole point of the design.
Checking the fabric (the fast network between servers) from Linux
Is the card up?
$ ibv_devinfo -d mlx5_0
hca_id: mlx5_0
        transport:                      InfiniBand (0)
        fw_ver:                         28.39.1002
        ...
                port:   1
                        state:                  PORT_ACTIVE (4)
                        active_mtu:             4096 (5)
                        link_layer:             InfiniBand
$ ibstat mlx5_0 | grep -E 'State|Rate'
                State: Active
                Physical state: LinkUp
                Rate: 400
Read it from the bottom up. Physical state: Polling means there's no working link to the switch, so check the cable. LinkUp with State: Initializing means the cable link is fine, but the port hasn't been set up on the network yet. That job belongs to the subnet manager, the program that hands out addresses and sets up the routes on an InfiniBand network. Rate should match what you paid for. A 400 Gb/s card showing 200 usually means a bad cable, or a port that settled on a lower speed with the switch (it negotiated down).
Some clusters skip InfiniBand and run RDMA (network cards writing straight into another machine's memory) over ordinary Ethernet. That's called RoCE. There, link_layer says Ethernet, and rdma link show shows which network interface goes with each RDMA device.
Which NIC belongs to which GPU?
Inside a server, GPUs and network cards plug into PCIe, the server's internal expansion bus. Some cards sit right next to a GPU and some sit far away. nvidia-smi topo -m prints how far apart every pair of devices is:
$ nvidia-smi topo -m          # trimmed to three GPUs and three NICs
        GPU0   GPU2   GPU4   NIC0   NIC2   NIC4   CPU Affinity   NUMA Affinity
GPU0     X     NV18   NV18   PIX    NODE   SYS    0-55           0
GPU2    NV18    X     NV18   NODE   PIX    SYS    0-55           0
GPU4    NV18   NV18    X     SYS    SYS    PIX    56-111         1

Legend:
  SYS  = Connection traversing PCIe as well as the SMP interconnect between NUMA nodes
  NODE = Connection traversing PCIe as well as the interconnect between PCIe Host Bridges within a NUMA node
  PIX  = Connection traversing at most a single PCIe bridge
  NV#  = Connection traversing a bonded set of # NVLinks
The GPU-to-NIC cells are the ones to read. PIX means the two share a PCIe switch, like neighbours on the same street. NODE means the path goes up through the CPU, and SYS means it also crosses over to the server's other CPU.
The diagram below draws the whole 8-GPU server that table comes from. Each NIC's colour gives its distance from the chosen GPU: green for PIX, amber for NODE, red for SYS.
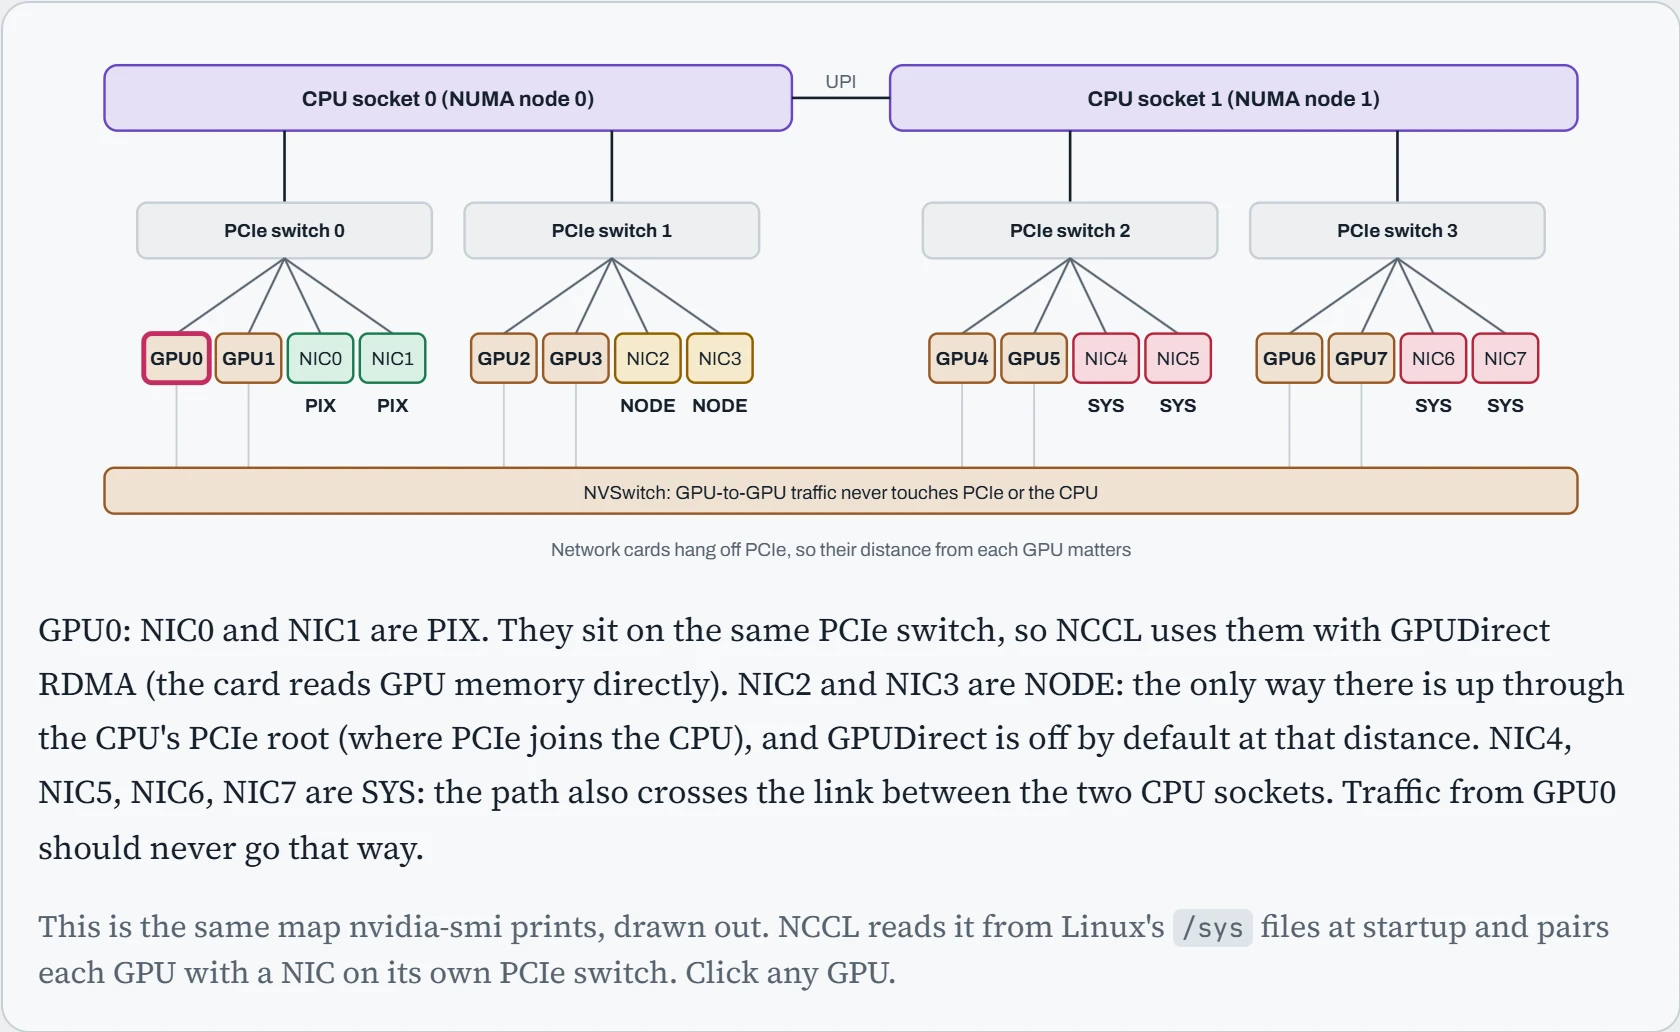
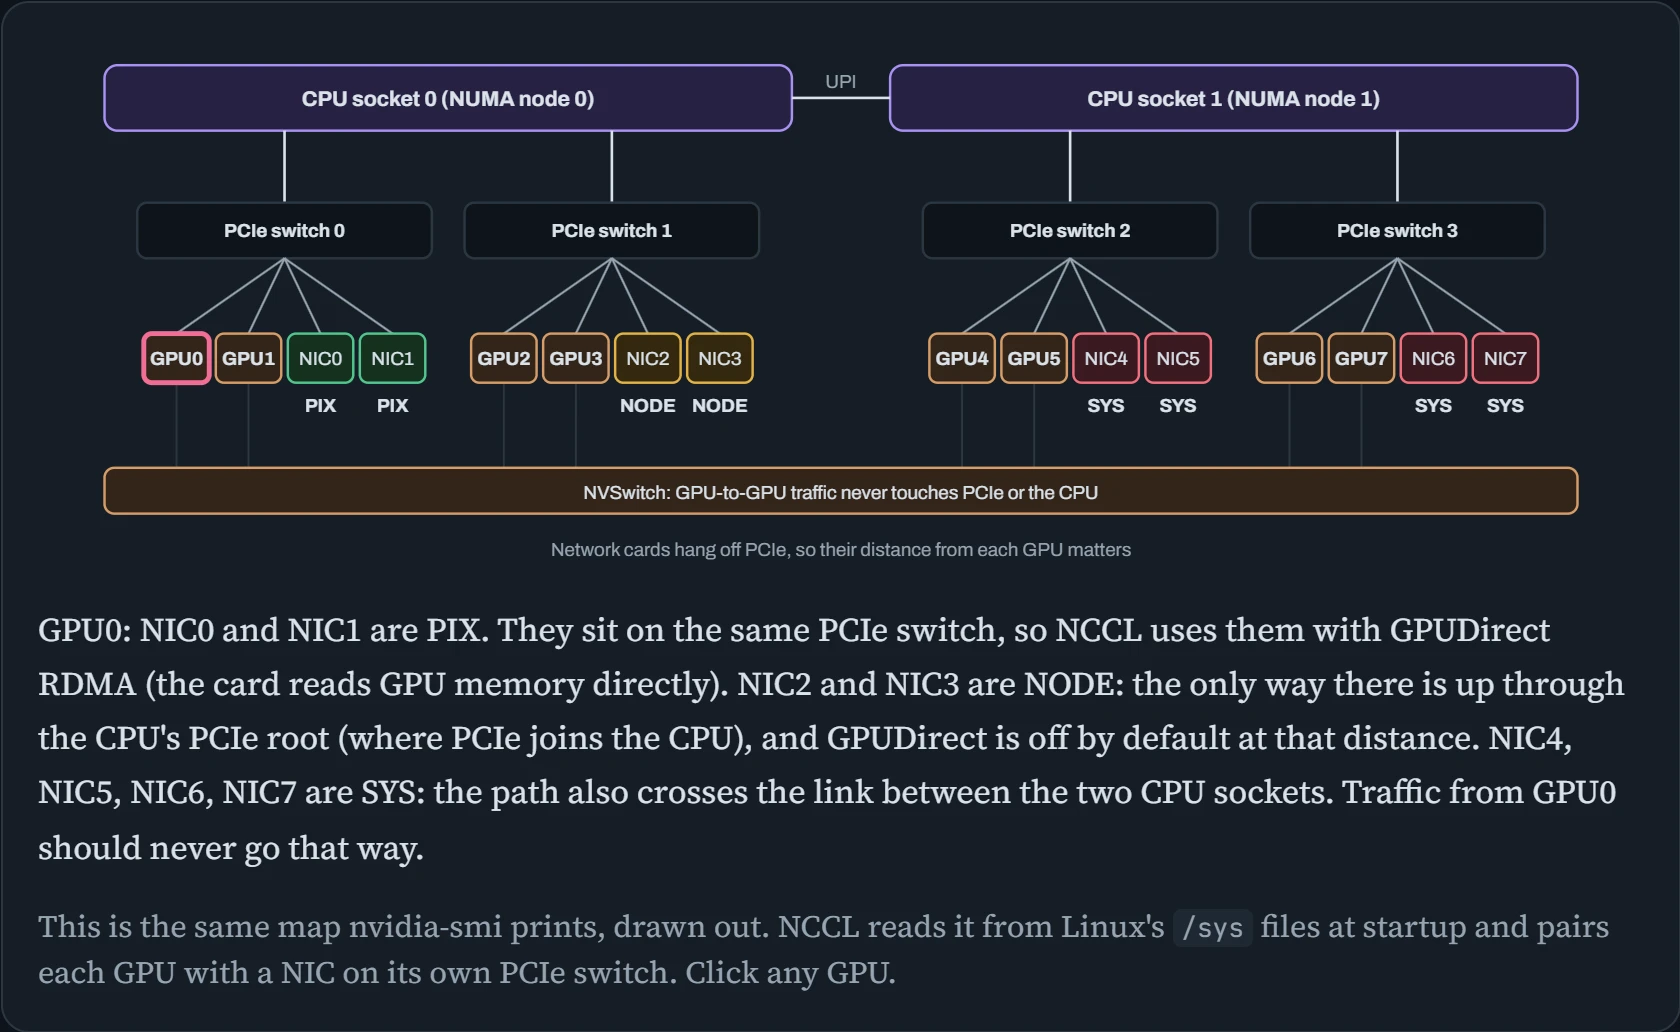
Every GPU here has two green neighbours, and those are the cards it should send through. Any farther, and NCCL by default turns off GPUDirect RDMA, which lets the card read GPU memory directly. Data then takes a detour through the server's main memory, and a red pairing also crosses between the two CPUs on every send.
Can the cards actually move data?
ib_write_bw, from the perftest package, measures the raw speed between one pair of cards, with no NCCL or training code in the way. Start it on one node with no host name, and it waits. Then run it on the other node and give it the first node's name:
node2$ ib_write_bw -d mlx5_0 --report_gbits
node1$ ib_write_bw -d mlx5_0 --report_gbits node2
 #bytes     #iterations    BW peak[Gb/sec]    BW average[Gb/sec]   MsgRate[Mpps]
 65536      5000             392.18             392.11               0.747891
node1$ ib_write_bw -d mlx5_0 --report_gbits --use_cuda=0 node2   # from GPU 0's memory (server uses the flag too)
 65536      5000             389.64             389.57               0.743047
The first run sends from normal system memory (host memory). The second, with --use_cuda=0, sends straight from GPU 0's memory. The two should be nearly the same. If the GPU number is far lower, GPUDirect RDMA (the card reading GPU memory directly) isn't working. Check that the nvidia_peermem kernel module is loaded. On newer setups, check instead that NCCL and the driver are using DMA-BUF, a Linux feature that does the same job without that module.
What RDMA needs from Linux
RDMA needs two things from Linux, and both catch almost everyone the first time, especially in containers. It needs the device files under /dev/infiniband, and it needs permission to lock a lot of memory in place so Linux can't move it (you'll see why in the mechanism section). Here's what the container from the opening example had: no device files, and a lock limit of just 64 KB.
container$ ls /dev/infiniband
ls: cannot access '/dev/infiniband': No such file or directory
container$ ulimit -l
64
The fix: pass the devices in, remove the memory-lock limit, and give the container permission to lock memory (the IPC_LOCK capability):
$ docker run --gpus all --network=host --ipc=host \
    --device=/dev/infiniband --ulimit memlock=-1 --cap-add=IPC_LOCK \
    my-training-image torchrun ...
Without containers (on bare metal), set memlock unlimited in /etc/security/limits.conf. Under Slurm, the job scheduler, jobs get their limits from slurmd, the background service that starts them, so its systemd unit needs LimitMEMLOCK=infinity too. On Kubernetes, the NVIDIA Network Operator and an RDMA device plugin are the add-ons that make the devices show up inside pods.
Lossless Ethernet for RoCE
InfiniBand never drops packets: its switches only send when there's room. Ethernet normally drops packets when a queue overflows, and RDMA traffic recovers from drops very badly. So RoCE networks add two features. PFC (priority flow control) lets a switch tell the sender “pause” for one class of traffic instead of dropping it. ECN lets a switch mark packets when its queues start filling, so senders slow down before any pause is needed. Both have to be set the same on every NIC and switch, and the counters show whether they're working:
$ ethtool -S ens1f0 | grep -E "prio3_pause|discard"
     rx_prio3_pause: 18342
     tx_prio3_pause: 0
     rx_discards_phy: 0
$ cat /sys/class/infiniband/mlx5_0/ports/1/hw_counters/np_ecn_marked_roce_packets
4410
Here RDMA runs in priority class 3: the NIC received pause frames (the switch asked it to wait) and dropped nothing, and ECN has been marking packets. That's a healthy congested network. Millions of pauses, or rising discards, mean the settings disagree somewhere, and RoCE performance will swing wildly from run to run.
Measure the collective itself
ib_write_bw tests one pair of cards. nccl-tests tests what training actually does: one group operation across every GPU at once (a collective, such as all-reduce), using the same library and the same paths your job will use. Run it before you blame the model code.
$ srun -N2 --ntasks-per-node=8 --gpus-per-node=8 --mpi=pmix \
    ./build/all_reduce_perf -b 512M -e 1G -f 2 -g 1
#       size         count      type   redop    root     time   algbw   busbw #wrong     time   algbw   busbw #wrong
#        (B)    (elements)                               (us)  (GB/s)  (GB/s)            (us)  (GB/s)  (GB/s)
   536870912     134217728     float     sum      -1   2734.5  196.33  368.12      0   2731.9  196.52  368.47      0
  1073741824     268435456     float     sum      -1   5455.1  196.83  369.06      0   5452.8  196.92  369.22      0
There are two speed columns, and the one you want is busbw. algbw is just the data size divided by the time. But in a ring, each GPU actually sends close to twice that much data (1.875 times, with these 16 GPUs), so busbw multiplies by 2(N−1)/N, the same ring factor from earlier. That turns it into the speed the busiest link actually ran at, which you can compare directly with the hardware's rated speed.
Here that's 369 GB/s. Each server has eight 400 Gb/s NICs, which is 400 GB/s in total, so the job reached about 92% of the cards' full rated speed (their line rate). That's a healthy result. Now tell NCCL not to use InfiniBand, so it has to fall back to plain TCP sockets, and run it again:
$ NCCL_IB_DISABLE=1 srun ... ./build/all_reduce_perf -b 1G -e 1G -g 1
  1073741824     268435456     float     sum      -1   692737    1.55    2.91      0   ...
The same 1 GB all-reduce takes 0.69 seconds instead of 5.5 milliseconds, over a hundred times slower. Keep this rule of thumb in mind: one server with NVLink gives hundreds of GB/s of busbw, several servers should come close to each server's total NIC bandwidth, and a few GB/s means you're on sockets.
Building nodes that stay identical
Everything on this page assumes every node is the same: the same kernel, driver, InfiniBand stack, NCCL and users. With four nodes you can set them up by hand. With sixty-four, hand-made setups drift apart within weeks, and a job that hangs only on node 37 is the result. So clusters are built by provisioning: a bare machine is switched on and turned into a working node with no hand-made steps at all. Read the chain left to right:
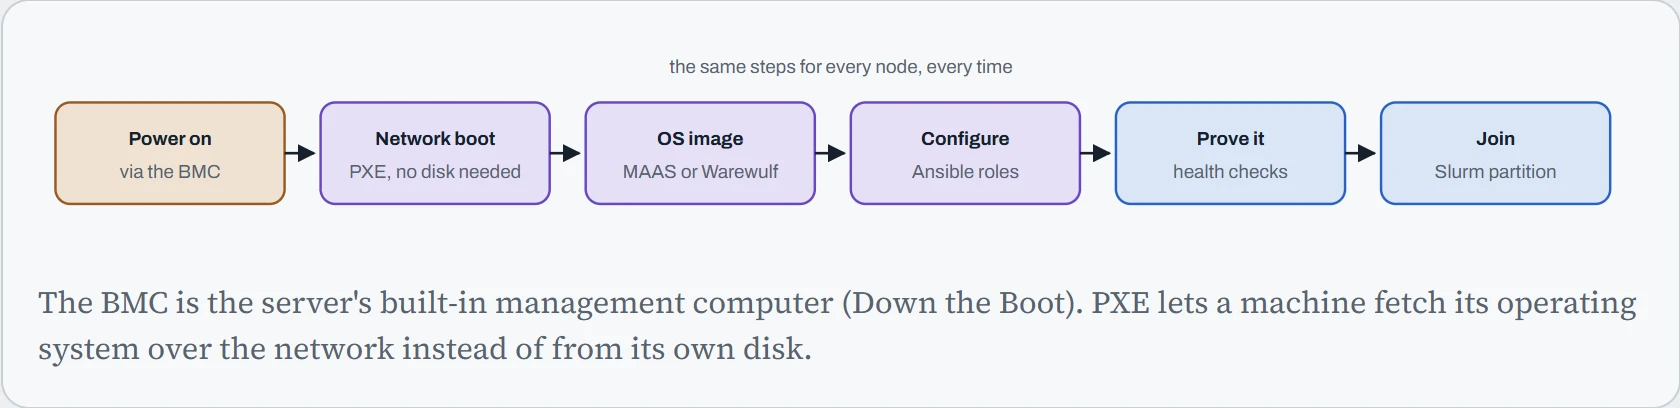
MAAS (common with Ubuntu) installs an image onto each node's disk. Warewulf, popular in HPC, often boots nodes stateless: the whole system runs from memory and is rebuilt from the image at every reboot, so drift can't survive a restart. Either way, Ansible then applies the configuration as code, the same way every time. Software that researchers need in several versions goes into Lmod modules, often built with Spack, so each job picks its own CUDA or MPI without changing the node:
$ cat site.yml
- hosts: gpu_nodes
  become: true
  roles:
    - nvidia_driver       # pinned version, held
    - doca_ofed           # InfiniBand drivers
    - sssd_ldap           # the same users and UIDs on every node
    - slurm_node
    - nfs_mounts
$ ansible-playbook -i inventory.ini site.yml --limit gpu37 --check --diff   # what would change?
$ module avail cuda
------------------------- /opt/modules -------------------------
   cuda/12.4    cuda/12.8 (D)
$ module load cuda/12.8 && spack install openmpi@5.0 +cuda fabrics=ucx
--check --diff runs the playbook without changing anything and prints what would change: a quick way to catch a node that has drifted. Firmware belongs in the same discipline. GPU, NIC and BIOS firmware versions should match across the cluster, recorded in the inventory and checked like any other setting, because a mismatched NIC firmware can show up as one slow link that drags every job down (the straggler problem below).
Predict. User alice was created by hand on each node. She's UID 1001 on gpu01 but UID 1003 on gpu02, and both nodes share /shared over NFS. Her job on gpu02 can't write to her own folder. Why?
Answer. NFS stores owners as numbers, not names. Her folder belongs to UID 1001, so on gpu02, where alice is 1003, the folder looks like it belongs to someone else (whoever is 1001 there, or nobody), and the permission check says no (Down the Permission).
That's why clusters take users from one directory, LDAP or similar, through SSSD on every node, so every name maps to the same number everywhere. getent passwd alice on each node should print the same line.
Running jobs with Slurm
On a shared cluster you don't log in to a GPU node and start training. You ask the scheduler, and it starts your job when the GPUs you asked for are free. Slurm is the scheduler on most AI clusters. Its idea is simple: nodes are grouped into partitions (say gpu and debug), every job states what it needs, and Slurm queues jobs by priority. A training job is a shell script with its requests at the top:
#!/bin/bash  (train.sbatch)
#SBATCH --job-name=ft-70b
#SBATCH --partition=gpu
#SBATCH --nodes=4 --ntasks-per-node=1
#SBATCH --gpus-per-node=8 --cpus-per-task=96
#SBATCH --time=24:00:00
#SBATCH --output=logs/%x-%j.out          # %x = job name, %j = job id
head=$(scontrol show hostnames "$SLURM_JOB_NODELIST" | head -n1)
srun torchrun --nnodes="$SLURM_NNODES" --nproc_per_node=8 \
     --rdzv_backend=c10d --rdzv_endpoint="$head":29500 train.py
$ sbatch train.sbatch
Submitted batch job 48213
srun starts one copy of the command on every node of the job, and each copy of torchrun then starts eight processes, one per GPU. The first node's name becomes the meeting point (the rendezvous from later in this lesson). For interactive work, salloc reserves resources and gives you a shell, so you can debug on real GPUs without writing a script. Then the commands you'll use every day:
$ salloc --partition=debug --gpus=1 --time=1:00:00     # reserve one GPU for an hour
$ srun --pty bash                                       # a shell on the node you got
$ squeue -u $USER -o "%.8i %.9P %.10j %.8T %.10M %R"
   JOBID PARTITION       NAME    STATE       TIME NODELIST(REASON)
   48213       gpu     ft-70b  PENDING       0:00 (Priority)
   48190       gpu   sweep-03  PENDING       0:00 (QOSMaxGRESPerUser)
$ sacct -j 48102 --format=JobID,State,Elapsed,AllocTRES%35
48102        COMPLETED   11:42:07 billing=768,cpu=384,gres/gpu=32,node=4
The last column of squeue is the most useful thing on a busy cluster: it says why a job is waiting. Resources means the GPUs aren't free yet. Priority means other jobs are ahead in the queue. QOSMaxGRESPerUser means you've hit a limit: a QoS (quality of service) is a named set of rules the admins attach to jobs, such as a maximum number of GPUs per user, a time limit, or a priority boost. sacctmgr show qos lists them. Finally, sacct is the accounting record of every finished job: how long it ran and exactly what it was given, which is what GPU-hour reports and chargeback (Down the Fleet) are built from. Job arrays (--array=0-9) run ten copies of a script with a different $SLURM_ARRAY_TASK_ID, the standard way to run a sweep, and the Pyxis plugin adds --container-image to run a job inside a container.
Continue the lesson
The whole lesson, with its drawings and its questions. 8 more sections after the ones above.