
Logging, syslog, debugs and timestamps
Logs from two switches cannot be put in one order, and the cause is two defaults: by default log messages are not time-stamped and sequence numbers are not displayed. System messages and debug output go to one logging process, which sends them to the console, the buffer, terminal lines or a syslog server. Each line has a facility, a severity from 0 to 7, a mnemonic and a description.
By Arif, founder of Daveth · Updated
The full 9 min walkthrough is in Daveth Pro (Network). See what the plan opens
What this page answers
Are Cisco log messages time-stamped by default?
No. By default log messages are not time-stamped and sequence numbers are not displayed, so lines from different devices cannot be put in order until both are enabled. Read it in “The two fields that are not there”
What is the format of a Cisco syslog message?
seq no:timestamp: %facility-severity-MNEMONIC:description. The facility names the part of the software, the severity is a digit from 0 to 7, and the mnemonic names the exact event. Read it in “Reading one line”
What are the default logging settings on a Catalyst switch?
Logging to the console is enabled at severity debugging; the buffer is 102400 bytes; time stamps are disabled; logging to a server is disabled, with facility Local7 and severity informational once configured. Read it in “Four destinations, four defaults”
Two switches you cannot line up
Two switches were involved in the same incident. You have the logs from both. You cannot put them in one order. Why not?
It is not a tooling problem. It is two defaults, and by the end of this page you will know which two.
Where messages go
How many places can one message reach?
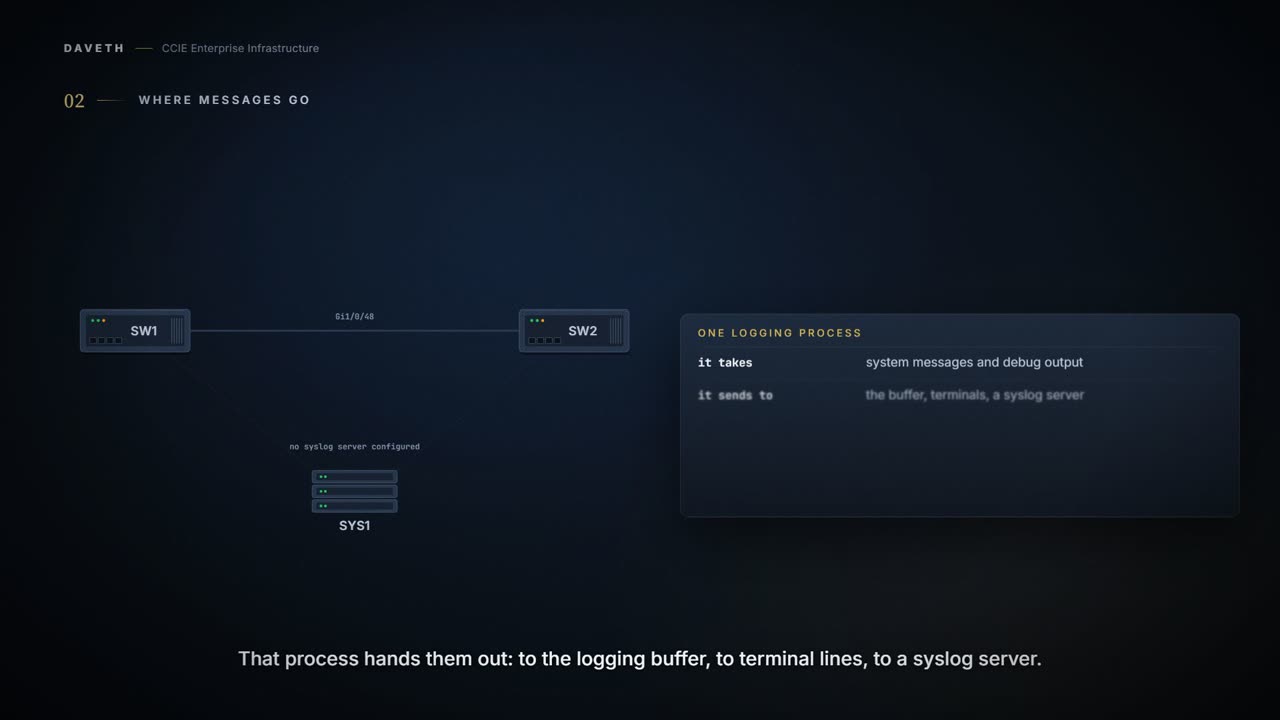
By default, a switch sends the output from system messages and debug privileged EXEC commands to a logging process. The logging process controls the distribution of logging messages to various destinations, such as the logging buffer, terminal lines, or a UNIX syslog server, depending on your configuration. The process also sends messages to the console. When the logging process is disabled, messages are sent only to the console.
Notice the first sentence: system messages and debug output go to the same logging process. A debug does not get a channel of its own. Whatever that process sends to the console, the buffer or a server, it sends debug output there too, at whatever level each destination allows.
Reading one line
What is each part of a log line for? The guide prints the shape:
The format, as the guide prints it.
seq no:timestamp: %facility-severity-MNEMONIC:description (hostname-n)
The guide's element table has seven entries. The facility says which part of the software spoke. The severity says how urgent that part thought it was:
Single-digit code from 0 to 7 that is the severity of the message.
The MNEMONIC names the exact event: it is the string you search for when you have seen this before. The description is the sentence everyone reads first. The last element, hostname-n, only appears on a stack member, with its switch number. And the first two, seq no and timestamp, are the subject of the next section.
What a log line proves: which part of the software emitted it, how severe that part judged the event, and what it says happened. What it does not prove: when it happened, unless timestamps are configured. And the severity is the emitting software's own judgement, not the impact on your network. A severity 3 about a protocol you do not run matters less than a severity 5 about one you do.
Both halves of that are worth holding, and the second is the one people skip. A log is one device's account of what it noticed. It did not ask anybody else, it cannot see what the far end saw, and an event that mattered to two switches will appear twice, in two voices, described in whatever terms each of them uses.
The two fields that are not there
Look at the format again, at its first two fields. Now predict: on a switch nobody has configured for logging, are seq no and timestamp filled in? Step 1 of the walk asks it.
By default, log messages are not time-stamped. By default, sequence numbers in log messages are not displayed.
Neither. The two fields that let you put lines in order, within one device and across devices, are both off until you ask for them. So correlation, the main reason anyone keeps logs, is something you have to turn on.
There is something quietly absurd about a system that will faithfully record thousands of events and decline to say when any of them happened.
Which kind of time do you want in the stamp? There are two:
log uptime — Enables time stamps on log messages, showing the time since the system was rebooted. log datetime — Enables time stamps on log messages. Depending on the options selected, the time stamp can include the date, time in milliseconds relative to the local time zone, and the time zone name.
The two lines this page recommends, on every device. Configuration only.
SW1(config)# service timestamps log datetime localtime msec show-timezone
SW1(config)# service sequence-numbers
Uptime tells you how long this switch had been running. That is useful for reading one switch's boot sequence, and close to useless for comparing two switches, which is what an incident needs. Step 3 of the walk: SW1 stamps 18:40:12 and SW2 stamps 00:41:03 for a drop they both saw within 2 ms.
If there is more than one log message with the same time stamp, you can display messages with sequence numbers to view these messages.
Sequence numbers order one device's lines, including two with the same stamp. They do not order two devices: each switch counts on its own (step 6).
Can you tell from one line which kind of stamp it carries? Read three consecutive lines from the guide's own example:
The guide's example, as printed. Three consecutive lines.
*Mar 1 18:46:11: %SYS-5-CONFIG_I: Configured from console by vty2 (10.34.195.36)
18:47:02: %SYS-5-CONFIG_I: Configured from console by vty2 (10.34.195.36)
*Mar 1 18:48:50.483 UTC: %SYS-5-CONFIG_I: Configured from console by vty2 (10.34.195.36)
The same event, three stamp shapes. The first has a date and seconds. The second has no date at all, and the element table lists hh:mm:ss as the short uptime format, so 18:47:02 could be a time of day or eighteen hours since a reboot, and the line cannot tell you which. The third has milliseconds and a zone. That is the whole problem, in the published text.
This course's reading: the procedure prints the datetime options as [msec | localtime | show-timezone], which reads as one of three. The format section prints them as separate options, and the third example line carries milliseconds and a zone together, so this page uses them together. Not claimed: what the leading asterisk on two of those lines means; the chapter does not say.
Four destinations, four defaults
Which do you expect to get more messages, the console or the syslog server? The defaults, as the guide's table prints them:
| Feature, as printed | Default setting, as printed |
|---|---|
| System message logging to the console | Enabled. |
| Console severity | Debugging. |
| Logging buffer size | 102400 bytes. |
| Time stamps | Disabled. |
| Logging server | Disabled. |
| Syslog server IP address | None configured. |
| Server facility | Local7 |
| Server severity | Informational. |
By default, the console receives debugging messages and numerically lower levels. By default, the terminal receives debugging messages and numerically lower levels. By default, syslog servers receive informational messages and numerically lower levels.
And numerically lower levels. What number is debugging, and what is informational? The chapter never pairs the names with numbers. Its Command Reference does, and states the rule in general:
Specifying a severity level causes messages at that level and all numerically lower levels to be sent to the configured logging destination.
| Severity | Level, as printed | Description, as printed |
|---|---|---|
| 0 | emergencies | System is unusable (severity=0) |
| 1 | alerts | Immediate action needed (severity=1) |
| 2 | critical | Critical conditions (severity=2) |
| 3 | errors | Error conditions (severity=3) |
| 4 | warnings | Warning conditions (severity=4) |
| 5 | notifications | Normal but significant conditions (severity=5) |
| 6 | informational | Informational messages (severity=6) |
| 7 | debugging | Debugging messages (severity=7) |
Sorted by number here; the published list is alphabetical.
Severity 0 is the most urgent, so numerically lower means more severe. The console's debugging is 7, everything; a server's informational is 6, everything except debugging. The first version of this lesson said the chapter never states the level-and-lower rule. It does, three times, above.
Continue the lesson
The whole lesson, with its drawings and its questions. The rest of this section and 6 more after it.