
Capstone D: an HPC training cluster with InfiniBand, shared storage and Slurm
NCCL picks the fastest network it can use, not the fastest that exists: if it cannot open the InfiniBand cards, it falls back to TCP over Ethernet and says so only in its debug log. The cluster has a login node, a Slurm controller, compute nodes on the fabric, and shared storage, each with its own quiet failure.
What this page answers
Why is my GPU cluster running at Ethernet speed?
NCCL could not open the InfiniBand cards and quietly fell back to TCP. With NCCL_DEBUG=INFO, the log shows NET/Socket instead of NET/IB. Read it in “Sixteen GPUs, home-broadband speed”
What are the parts of a Slurm GPU cluster?
Users log in to a login node and submit jobs, the Slurm controller decides which nodes run them, compute nodes train over the InfiniBand fabric, and shared storage is mounted at the same path on every node. Read it in “What you're building”
Sixteen GPUs, home-broadband speed
Two nodes, eight GPUs each, every GPU with its own 400 Gb/s InfiniBand card. Before training, you run the standard NCCL benchmark across both nodes, which measures how fast the GPUs can combine their results. The number that matters is busbw:
$ srun -N2 --ntasks-per-node=8 --gpus-per-node=8 --container-image=nvcr.io#nvidia/pytorch:25.09-py3 \
      all_reduce_perf -b 1G -e 4G -f 2 -g 1
#       size         count      type   redop    root     time   algbw   busbw
  1073741824     268435456     float     sum      -1   397520    2.70    5.06
  4294967296    1073741824     float     sum      -1  1580145    2.72    5.10
Outputs on this page are realistic examples. Commands, settings and log formats are real.
About 5 GB/s, where hardware like this should manage hundreds. What's going on?
- The GPUs are throttling from heat
- NCCL is sending over the ordinary Ethernet port instead of InfiniBand
- The test messages are too small to measure properly
Answer. NCCL picks the fastest network it can use, not the fastest one that exists. If it can't open the InfiniBand cards, it quietly falls back to plain TCP over whatever Ethernet port it finds, and says so only in its debug log:
$ NCCL_DEBUG=INFO srun … all_reduce_perf … 2>&1 | grep -E "NET/(IB|Socket)" | head -2
gpu01:41022:41022 [0] NCCL INFO NET/Socket : Using [0]eth0:10.0.0.11<0>
gpu01:41022:41022 [0] NCCL INFO Using network Socket
Here the container couldn't see the InfiniBand devices: /dev/infiniband wasn't passed in. Other common causes are a locked-memory limit that's too small, the RDMA libraries missing from the image, or a link that's down. On a healthy run the log says NET/IB : Using [0]mlx5_0:1/IB, and busbw lands in the hundreds of GB/s. The lesson for the whole capstone: every layer can fail silently into a slow path, so you check each one with a number before building on it.
What you're building
The cluster has three networks' worth of jobs, so the picture has three layers. Read it top to bottom. Users log in to a login node and submit jobs. The Slurm controller decides which job runs on which nodes. The compute nodes do the training, talking to each other over the InfiniBand fabric, and reading data and writing checkpoints to shared storage that every node mounts at the same path.
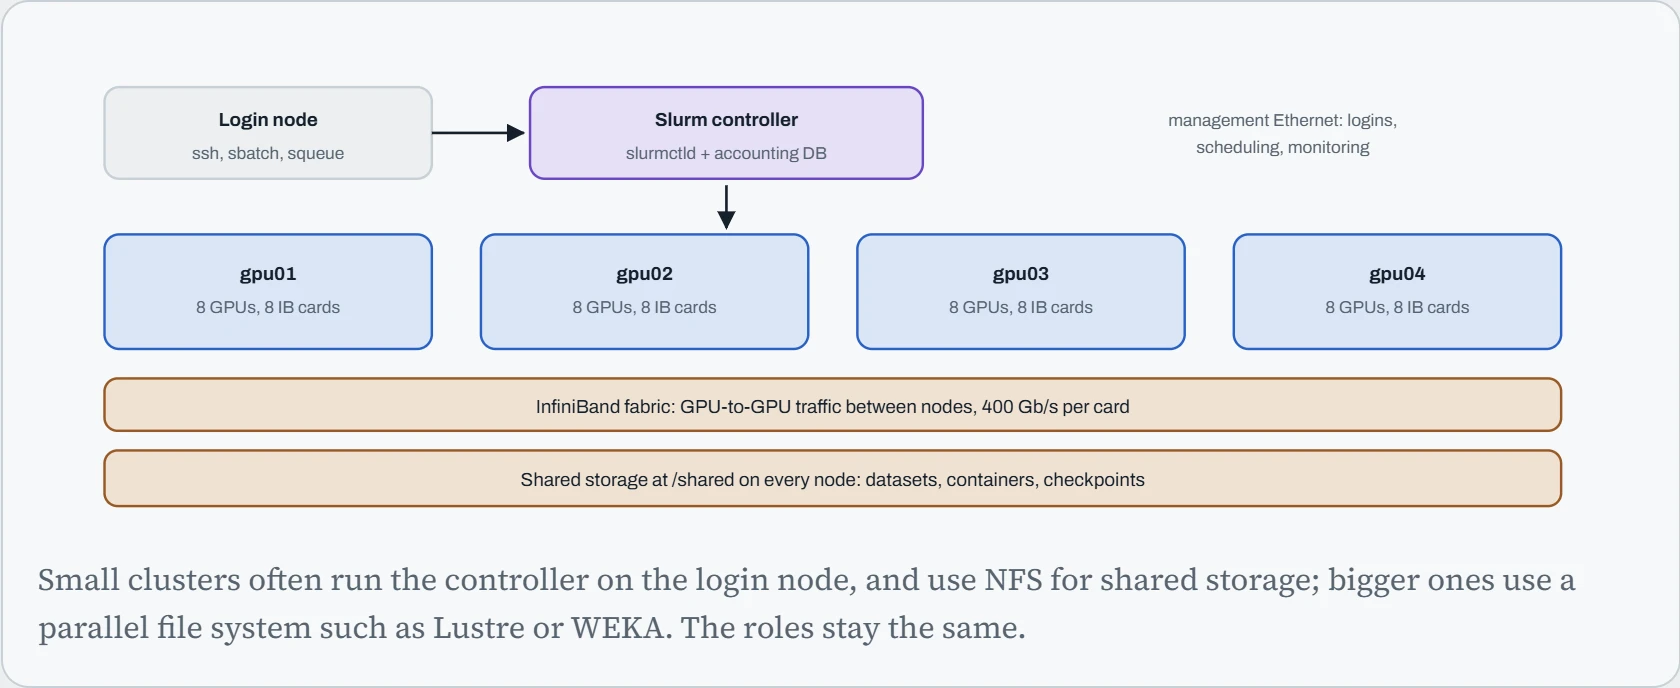
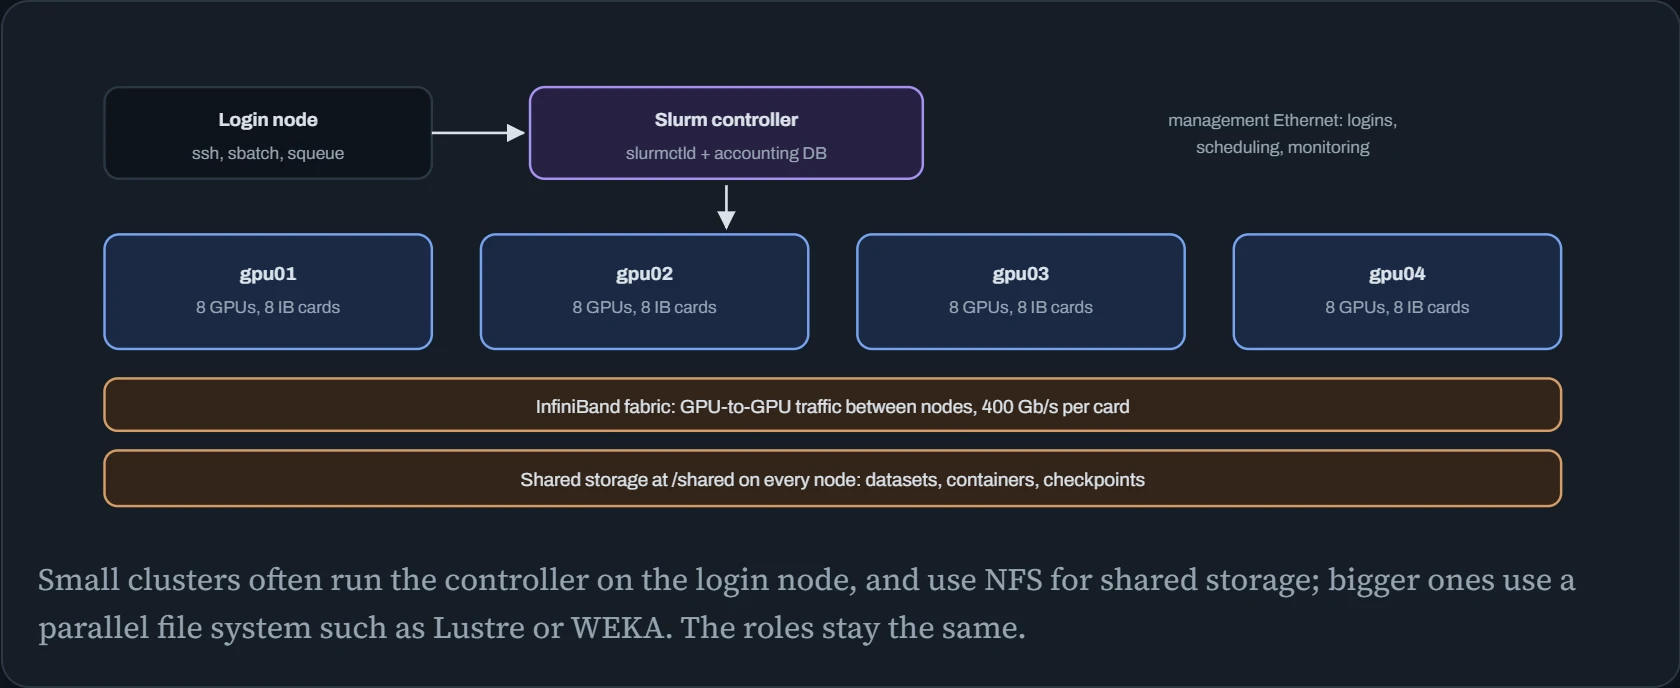
Each layer has its own way of quietly failing. The fabric can fall back to TCP (the hook). Nodes can drift apart in driver versions (Down the Fleet). Shared storage can be fast for one node and slow when all of them write a checkpoint at once. And Slurm can leave nodes idle while jobs wait, if it isn't given good information. The rest of this page takes those one at a time.
The build order
Ten milestones. Notice how much has to be true before the first real training job: that's the hook's lesson turned into a plan.
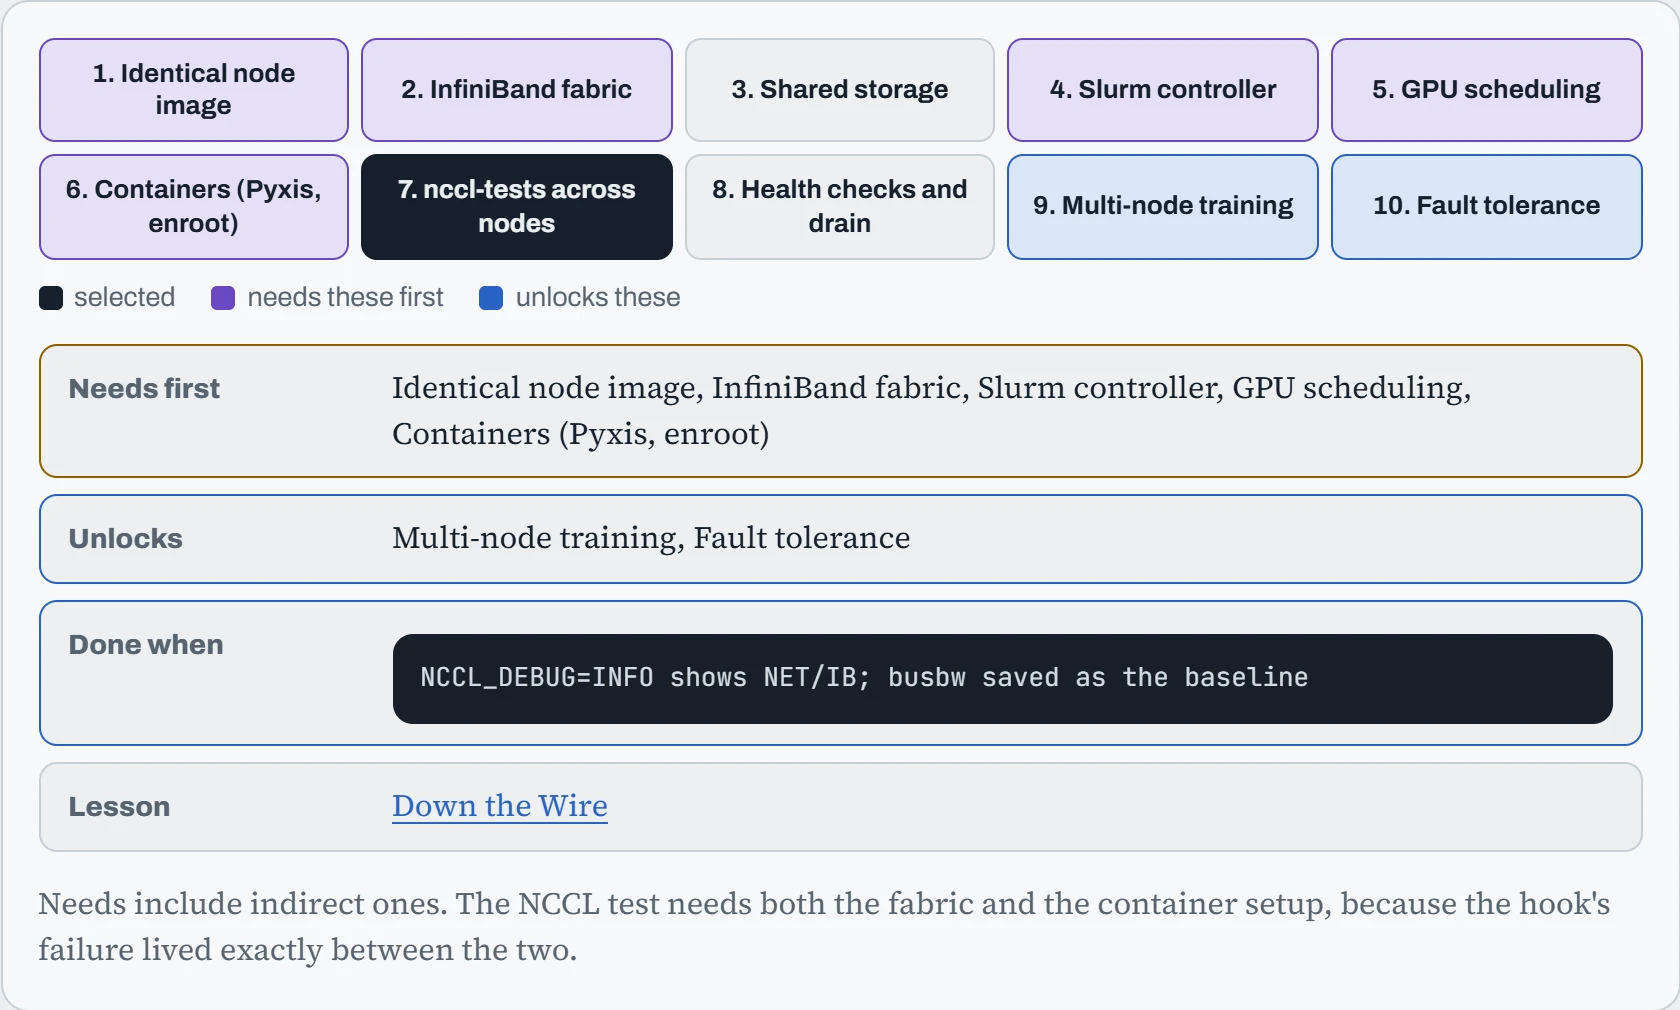
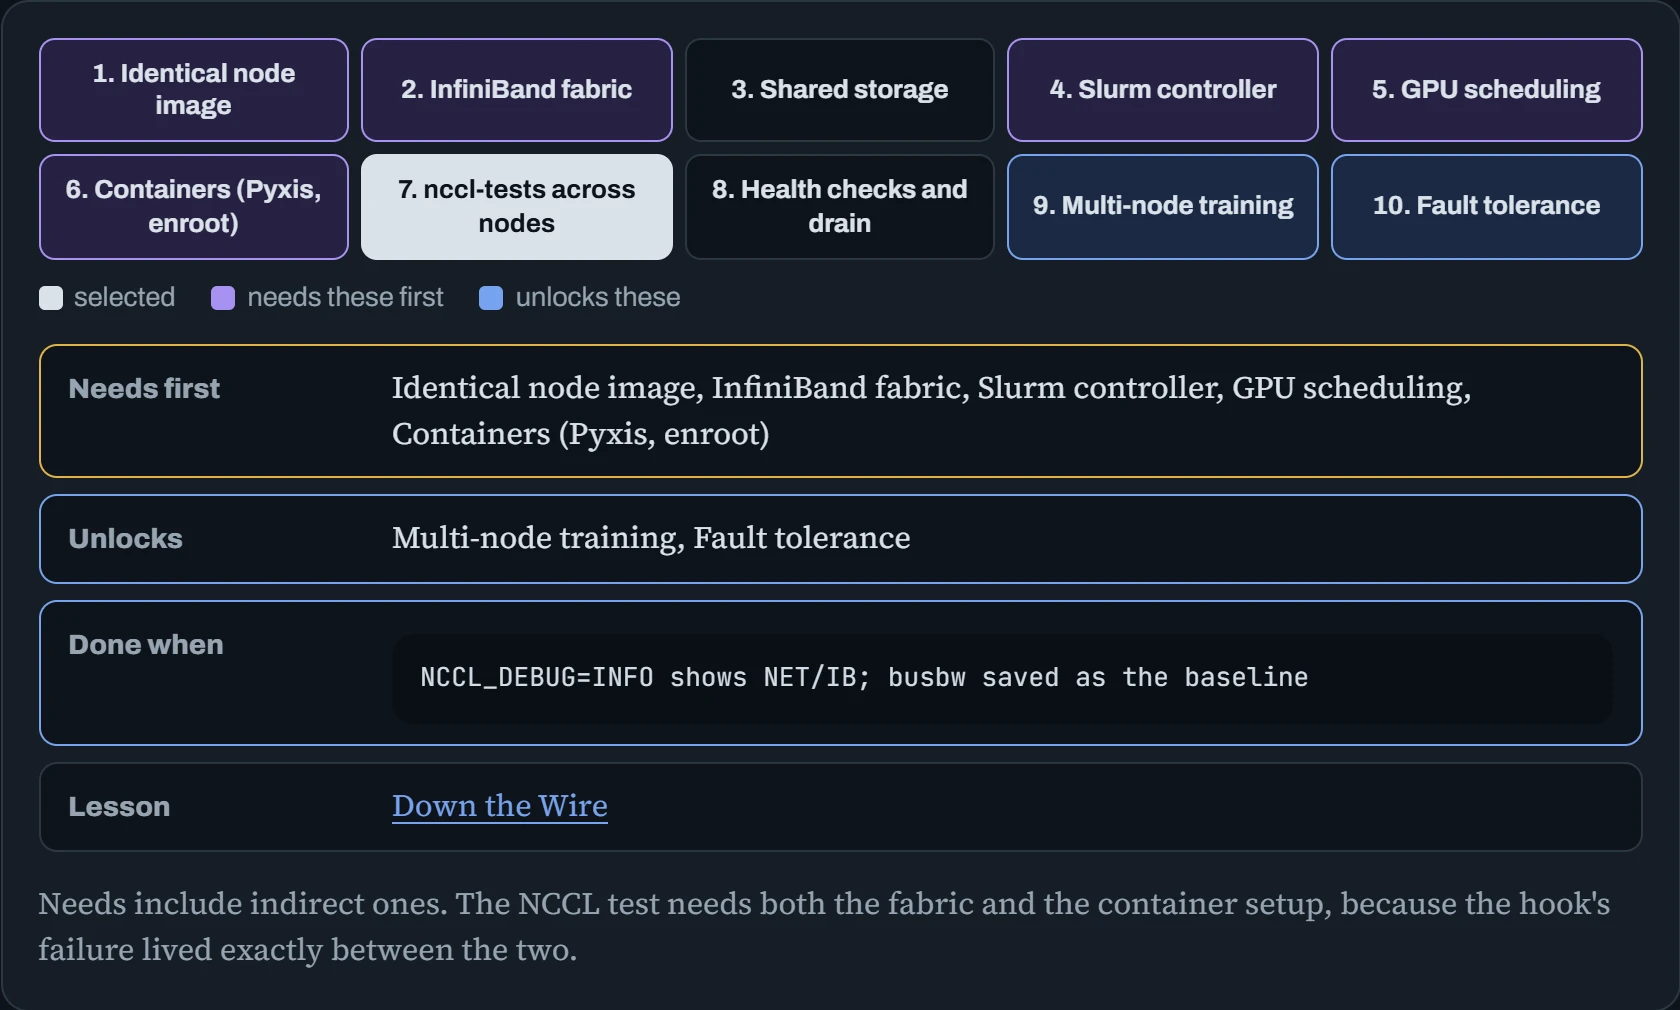
The first milestone, an identical image on every node, sits under everything, and it's the one people skip. Two nodes with different driver or NCCL versions can each pass every test alone and still hang together. Building every node from one image, and checking that they really match, prevents a whole class of problems that are miserable to find later.
Proving each layer
Validation goes from the bottom up, with a number for each layer. Keep the results: they're your baseline, and every later problem gets compared against them.
| Layer | Command | Healthy looks like |
|---|---|---|
| Nodes identical | clush -a 'uname -r; cat /proc/driver/nvidia/version | head -1' | dshbak -c | One group: every node prints the same |
| InfiniBand links | ibstat | grep -E "State|Rate" | State: Active, Rate: 400 on every port |
| RDMA between two nodes | ib_write_bw -d mlx5_0 --report_gbits | Close to the link rate, for example about 390 Gb/s on 400 |
| GPUs inside jobs | srun -N1 --gpus-per-node=8 nvidia-smi -L | Exactly the 8 GPUs the job asked for |
| NCCL within a node | all_reduce_perf -g 8 | Hundreds of GB/s over NVLink |
| NCCL across nodes | the hook's command, with NCCL_DEBUG=INFO | NET/IB in the log, busbw in the hundreds of GB/s |
| Shared storage | fio writing from every node at once | Total write speed you can plan checkpoints around |
| GPU health | dcgmi diag -r 2 | Pass on every test, every node |
The table goes from the lowest layer to the highest on purpose. If ib_write_bw is slow, no NCCL setting will help, and if GPUs inside jobs are wrong, the NCCL numbers mean nothing. Notice the storage row says “from every node at once”: a single node writing alone hides the real limit, which only appears when the whole cluster saves a checkpoint together. And the GPU health check becomes part of the cluster itself: Slurm's HealthCheckProgram setting runs a checker on every node regularly and drains any node that fails, so no new jobs land there (Down the Bus covers what the GPU checks look at).
Running and surviving jobs
A multi-node training job is a short batch script. Slurm gives it nodes and GPUs, srun starts one torchrun per node inside a container (through the Pyxis plugin and enroot), and the torchruns find each other at the first node's address (Down the Wire):
# train.sbatch
#!/bin/bash
#SBATCH --job-name=sft-70b
#SBATCH --nodes=3
#SBATCH --ntasks-per-node=1
#SBATCH --gpus-per-node=8
#SBATCH --time=12:00:00
#SBATCH --requeue
#SBATCH --output=logs/%x-%j.out

head=$(scontrol show hostnames "$SLURM_JOB_NODELIST" | head -n1)
srun --container-image=nvcr.io#nvidia/pytorch:25.09-py3 --container-mounts=/shared:/shared \
  torchrun --nnodes "$SLURM_NNODES" --nproc-per-node 8 \
    --rdzv-backend c10d --rdzv-endpoint "$head:29500" --rdzv-id "$SLURM_JOB_ID" \
    /shared/code/train.py --ckpt-dir /shared/ckpt/sft-70b --resume latest
$ sbatch train.sbatch
Submitted batch job 4182
$ sacct -j 4182 -D -X --format=JobID,State,NodeList,Elapsed
JobID           State        NodeList    Elapsed
4182       REQUEUED    gpu[01-03]   05:12:40
4182        RUNNING    gpu[02-04]   01:03:11
The last output shows fault tolerance working. Five hours in, a GPU on gpu01 failed. The health check drained the node, the job was killed, and because of --requeue Slurm put it back in the queue. It restarted on three healthy nodes and, thanks to --resume latest, carried on from its last checkpoint on shared storage. Nobody was woken up. Two details make that work: checkpoints saved regularly (and on SIGTERM, which Slurm sends before killing a job, Down the Signal), and every node seeing the same /shared path. How often to checkpoint is a trade-off covered in Down the Fleet.
Predict. A 70B full fine-tune saves about 1.1 TB of state per checkpoint (16 bytes per weight). Your NFS server writes at 2 GB/s. Every node saves at once, every 30 minutes. What fraction of the run is spent saving?
Answer. Roughly 1,100 GB ÷ 2 GB/s ≈ 550 seconds, about 9 minutes, out of every 30: close to a third of the run, with all GPUs waiting. That's why checkpoint size and storage speed are designed together.
The fixes stack: a parallel file system or local NVMe with background upload, each rank writing only its own shard in parallel (PyTorch's distributed checkpoint does this), asynchronous saving so training continues while the copy is written, and less frequent saves once the failure rate is known.
Continue the lesson
The whole lesson, with its drawings and its questions. 3 more sections after the ones above.