
Capstone C: a GPU Kubernetes inference platform built as code, with autoscaling
An LLM server's work happens on the GPU, so autoscaling on CPU use never fires: CPU sits at 14% whether the server is idle or overloaded. Scale on the request queue instead, num_requests_waiting. The platform runs users through a gateway to GPU pods, with two chained autoscalers and everything described in code.
What this page answers
Why does my LLM server not autoscale under load?
The autoscaler adds replicas when CPU passes 70%, but the work happens on the GPU and the CPU stays at 14%. Scale on the queue, num_requests_waiting, for example with KEDA. Read it in “Overloaded, and not scaling”
Why does a GPU inference platform need two autoscalers?
One adds serving pods and the other adds GPU nodes for them to run on. They chain: when a new pod has no free GPU, it waits until the node autoscaler brings one up. Read it in “What you're building”
Overloaded, and not scaling
A product launch sends a wave of users to your chat endpoint. Responses that took two seconds now take forty. You set up autoscaling weeks ago, so you check what it's doing:
$ kubectl get hpa llm
NAME   REFERENCE        TARGETS        MINPODS   MAXPODS   REPLICAS   AGE
llm    Deployment/llm   cpu: 14%/70%   2         10        2          9d
$ kubectl exec deploy/llm -- curl -s localhost:8000/metrics | grep num_requests_waiting
vllm:num_requests_waiting{model_name="chat"} 214.0
Outputs on this page are realistic examples. Commands, settings and metric names are real.
214 requests are waiting, and the autoscaler is sitting at the minimum. Why doesn't it add replicas?
- It has already reached its maximum
- It watches CPU, and a GPU server's CPU stays nearly idle under any load
- Autoscaling takes an hour to react
Answer. The autoscaler is doing exactly what it was told: add replicas when CPU use passes 70%. But the work of an LLM server happens on the GPU. The CPU just shuffles requests around, so it stays at 14% whether the server is idle or drowning. The signal that does track overload is the queue: num_requests_waiting.
The fix is to scale on that metric instead, for example with KEDA reading it from Prometheus. That's the platform lesson in miniature: every automatic decision needs the right signal, and only the system as a whole shows you which signal is right. The mechanism section lets you watch the difference minute by minute.
What you're building
The finished platform, as requests see it. Read from left to right: users reach a gateway that checks who they are and how much they may send, which forwards to serving pods on GPU nodes. Below runs the control side: metrics flow into Prometheus, and two autoscalers act on them. One adds serving pods, the other adds GPU nodes for those pods to run on. All of it, from the network up, is described in code in a git repository.
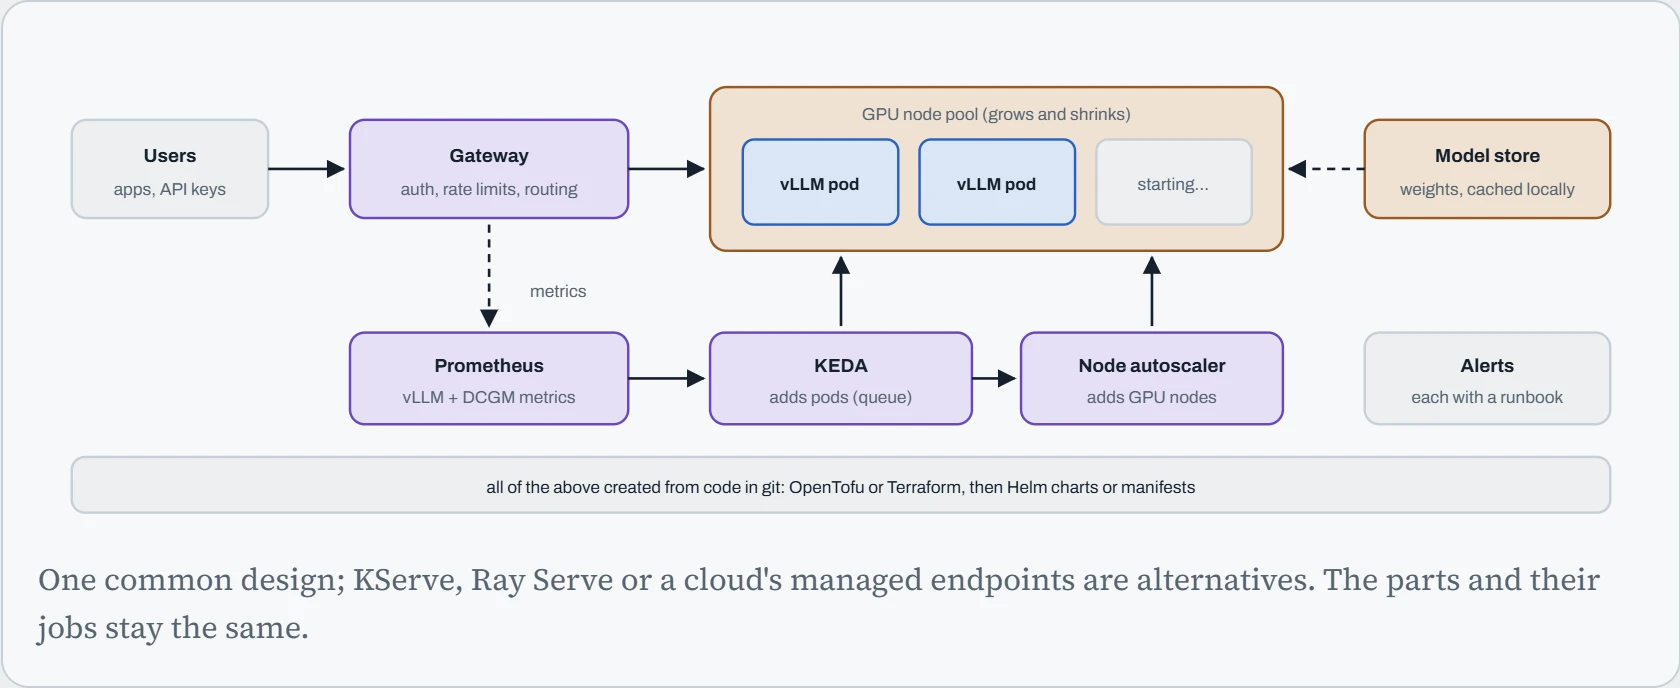
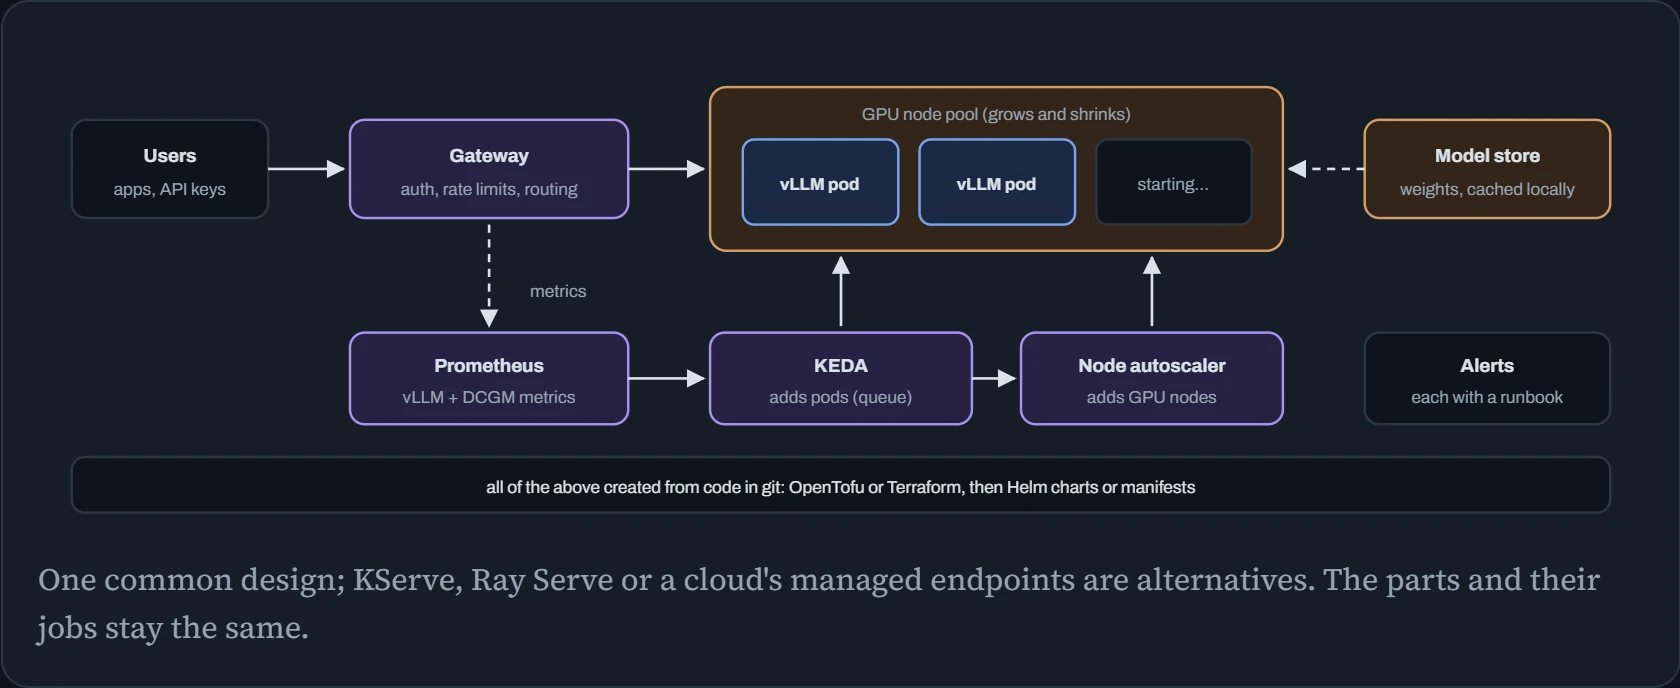
Notice there are two separate autoscalers, and they chain: when KEDA asks for a fifth pod and there's no free GPU, the pod waits until the node autoscaler has rented a new machine. That chain is where most of the slowness in a spike comes from, and why the mechanism sections look at it in detail.
The build order
Ten milestones. Pay attention to where observability sits: before autoscaling, because an autoscaler can only act on metrics that already exist.
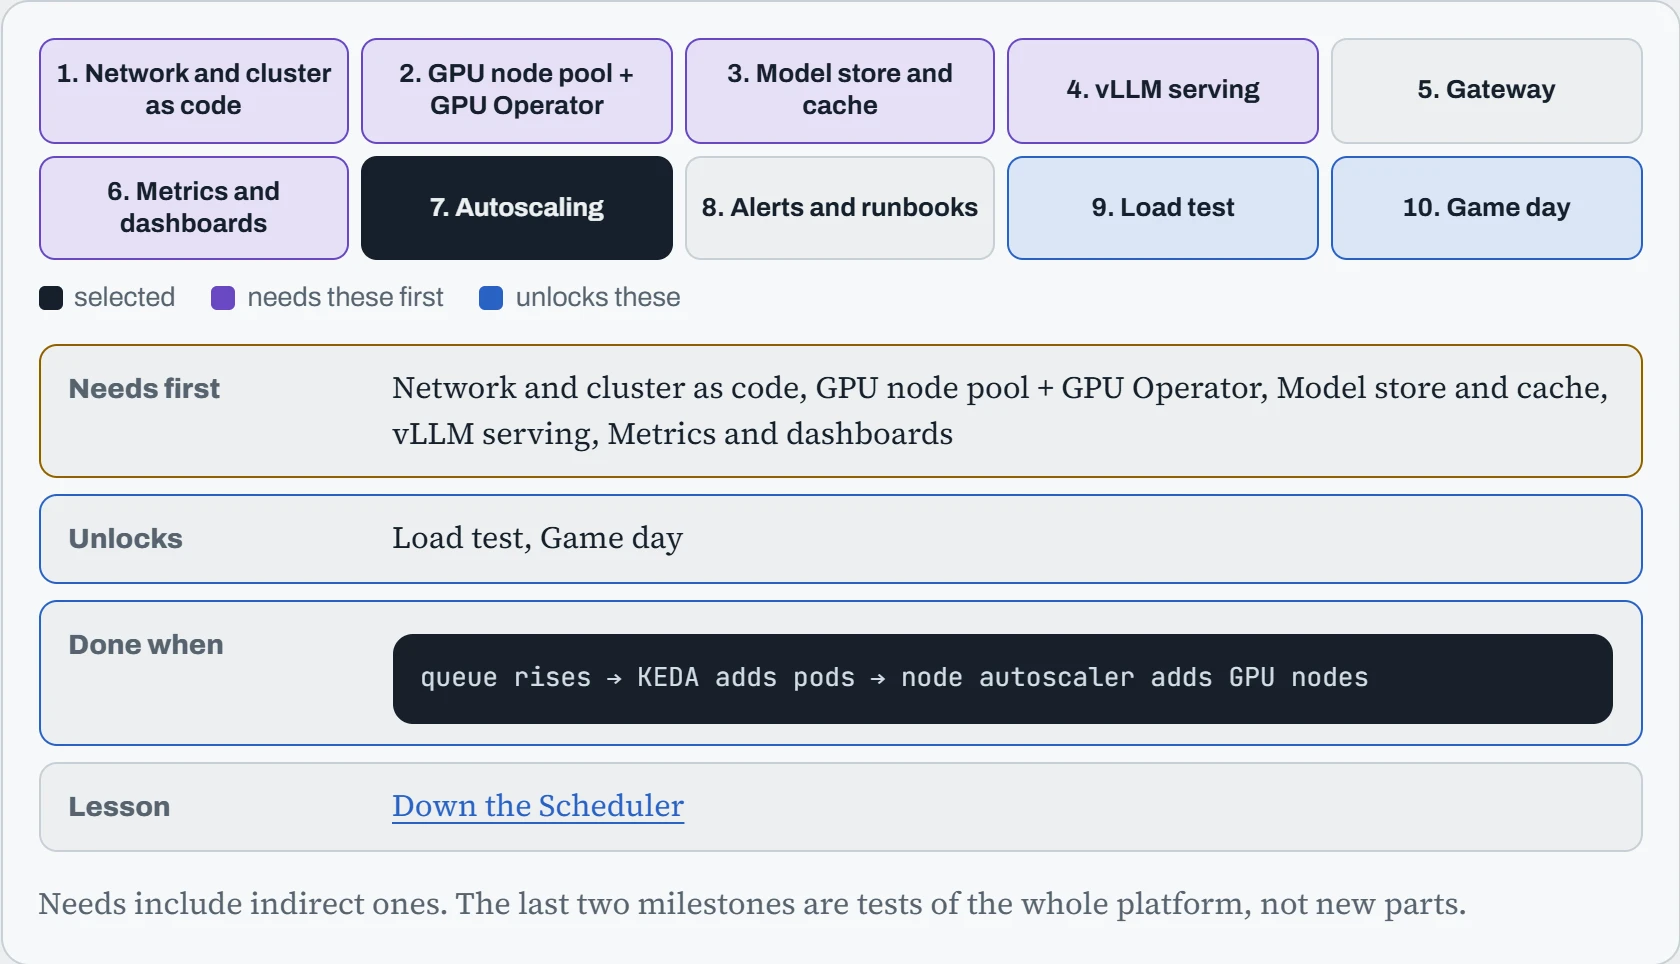
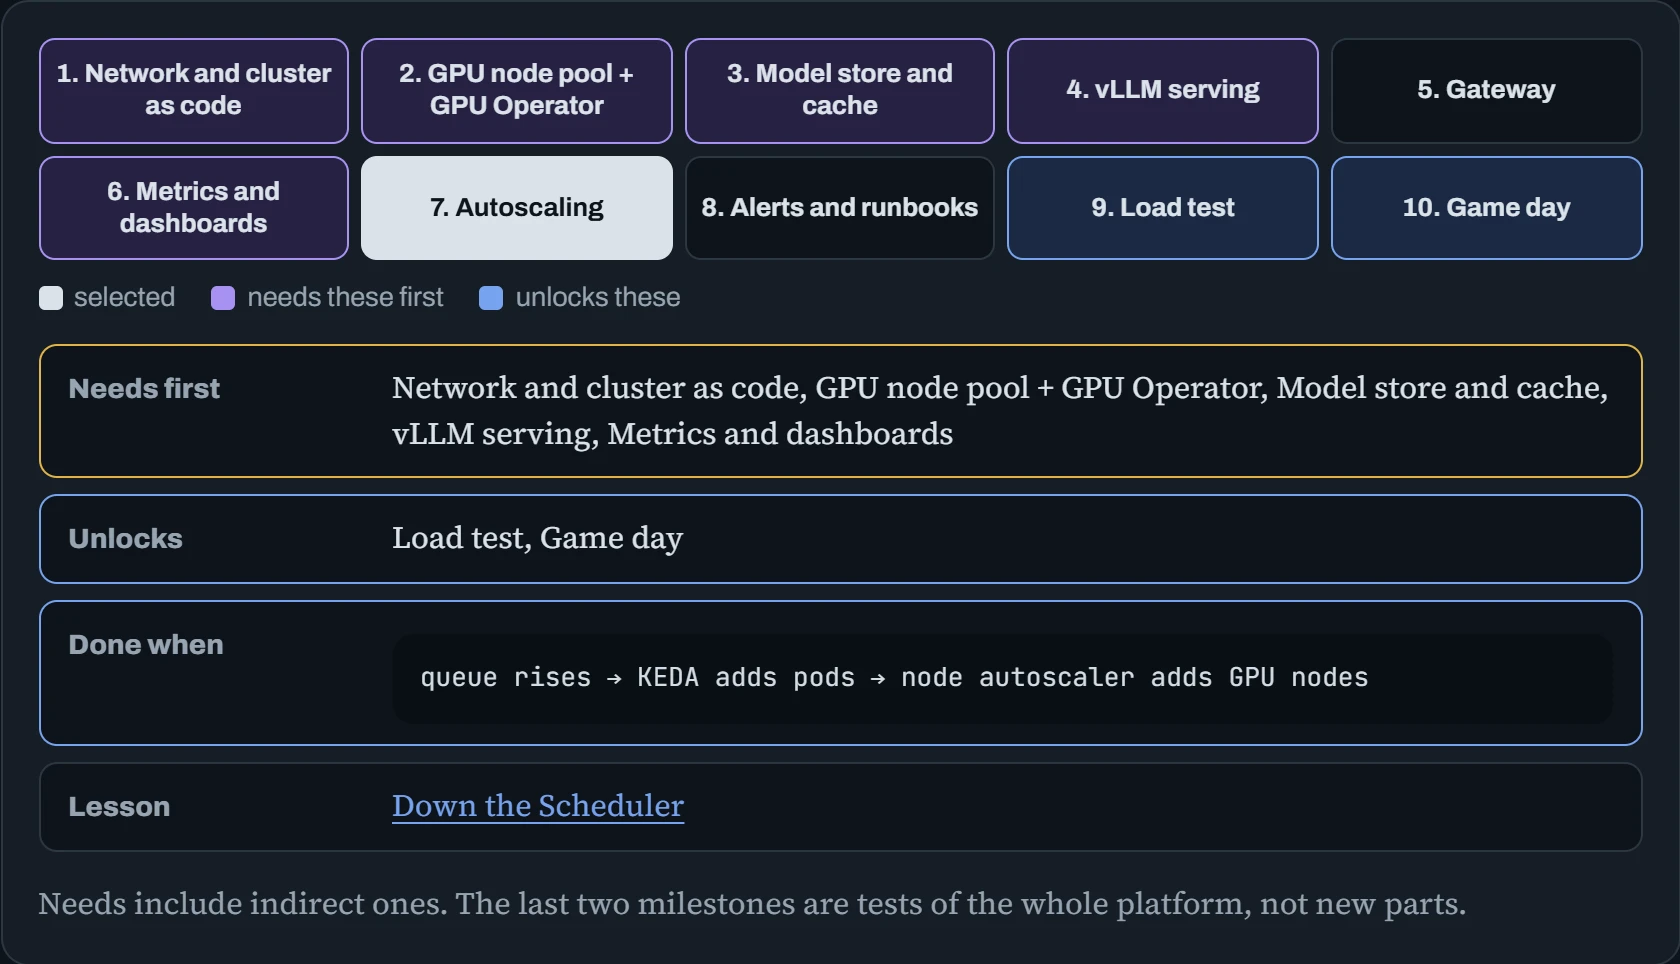
The final two milestones are what turn a working demo into a platform. A load test proves the autoscaling chain reacts the way you think. A game day, where you deliberately break something (drain a GPU node, kill the gateway, expire a certificate) and follow the runbook, proves that people can fix it at 3 a.m. Both usually find problems, which is the point.
The cluster as code
Every piece of infrastructure is written as code and applied with OpenTofu or Terraform (Down the Cloud). That gives you review before changes, a record of every change in git, and the ability to rebuild the whole platform in another region. Here's the GPU node pool on AWS, as one example:
# gpu-nodes.tf
resource "aws_eks_node_group" "gpu" {
  cluster_name    = aws_eks_cluster.main.name
  node_group_name = "gpu-l40s"
  node_role_arn   = aws_iam_role.nodes.arn
  subnet_ids      = module.vpc.private_subnets
  instance_types  = ["g6e.xlarge"]
  ami_type        = "AL2023_x86_64_NVIDIA"
  scaling_config {
    min_size     = 2
    desired_size = 2
    max_size     = 10
  }
  taint {
    key    = "nvidia.com/gpu"
    value  = "true"
    effect = "NO_SCHEDULE"
  }
}
$ tofu plan -out plan.bin
Plan: 14 to add, 0 to change, 0 to destroy.
$ tofu apply plan.bin
Three choices in that block matter for AI. The machine image comes with the NVIDIA driver already installed, which saves minutes on every new node (the last section shows why that matters). The taint keeps ordinary pods off expensive GPU nodes: only pods that explicitly tolerate it can land there. And min_size = 2 is a cost decision as much as a technical one: two GPUs are always paid for, in exchange for never starting from zero. On top of the cluster, the NVIDIA GPU Operator installs the device plugin and monitoring (Down the Scheduler), and Helm charts install everything else, also from git.
Serving and the gateway
Each serving pod runs vLLM on one GPU (or several, for big models), loading weights from a shared model store into a local cache. The two settings people most often get wrong are the health checks. A startup probe gives the pod time to load the model, and a readiness probe tells Kubernetes when the pod may receive traffic (Down the Queue):
# part of the serving Deployment
containers:
- name: vllm
  image: vllm/vllm-openai:v0.11.0
  args: ["--model", "/models/chat-8b", "--served-model-name", "chat", "--max-model-len", "8192"]
  resources:
    limits: { nvidia.com/gpu: 1 }
  startupProbe:   { httpGet: { path: /health, port: 8000 }, periodSeconds: 10, failureThreshold: 60 }
  readinessProbe: { httpGet: { path: /health, port: 8000 }, periodSeconds: 5 }
tolerations:
- { key: nvidia.com/gpu, operator: Exists, effect: NoSchedule }
The startup probe allows up to 10 minutes (60 checks, 10 seconds apart) for the model to load before Kubernetes gives up and restarts the pod. In front of the pods, the gateway (for example LiteLLM, Envoy AI Gateway or a cloud API gateway) does the jobs no single pod can: it checks API keys, enforces a rate limit per customer so one tenant can't starve the rest, routes each model name to its pods, and turns away requests with a quick “try again” when everything is full, rather than letting them queue for minutes.
Predict. A new pod has no readiness probe. Its container starts in two seconds, but loading the model takes three minutes. What happens to requests during those three minutes?
Answer. Some of them fail. Without a readiness probe, Kubernetes counts the pod as ready as soon as its container starts, and the Service sends it a share of the traffic. Those requests hit a server that isn't listening yet, and users see connection errors, exactly when a scale-up was meant to help.
With the readiness probe on /health, the pod only joins the Service once vLLM answers, so new capacity arrives without errors. The startup probe then stops the slow model load from being mistaken for a crash.
Seeing what users feel
Two kinds of metrics feed the platform. The serving engine reports what users feel: requests waiting, time to first token, tokens per second. The DCGM exporter reports what the GPUs do: memory, temperature, errors (Down the Dashboard). Alerts belong on the first kind, written as a promise to users, a service level objective (SLO), like “95% of requests get their first token within 2 seconds”:
# alert rule: the SLO is being broken right now
- alert: SlowFirstToken
  expr: histogram_quantile(0.95, sum by (le) (rate(vllm:time_to_first_token_seconds_bucket[5m]))) > 2
  for: 5m
  annotations:
    runbook_url: https://wiki.internal/runbooks/slow-first-token
# the scaling signal KEDA uses
- query: sum(vllm:num_requests_waiting{model_name="chat"})
Every alert links to a runbook: a short page that says what the alert means, what to check first, and what's safe to do (Down the Fleet). An alert without a runbook wakes someone up and leaves them guessing. And notice that the autoscaling signal and the alert are different queries on the same data: the queue tells the platform to act, the SLO tells people when acting wasn't enough.
Predict. The GPU dashboard shows every GPU at 100% utilization, so the team says the platform is efficient and fine. Users are complaining that it's slow. Who's right?
Answer. The users. GPU utilization only says the GPU had some work in each sampling interval, not that it's doing it well or fast enough. A completely overloaded server with a long queue also shows 100%, and so does a well-tuned one at its comfortable limit.
Utilization tells you about cost, not about users. Time to first token and the queue length tell you about users, which is why the SLO and the scaling signal are built on those.
Continue the lesson
The whole lesson, with its drawings and its questions. 4 more sections after the ones above.