
Fleet reliability: configuration drift, checkpoint cadence, canary upgrades, model registries and runbooks
A single GPU is very reliable, failing about once every 5.8 years, but a job across thousands of GPUs stops when any one fails, so it is interrupted every few hours. Checkpoint at the gap that balances lost work against time spent saving; Young's formula gives a starting point.
What this page answers
How often do GPUs fail in large training clusters?
In Meta's figures of 419 interruptions over 16,384 GPUs and 54 days, each GPU averages one interruption every 2,111 days, about 5.8 years. A job across all of them stops when any one fails. Read it in “Something breaks every three hours”
How often should I checkpoint a training job?
Each failure loses on average half the gap between saves plus the restart, while saving pauses training. Young's formula from 1974 puts the best gap at about the square root of 2 times the save time times the time between failures. Read it in “How often to checkpoint”
Something breaks every three hours
When Meta trained its largest Llama 3 model, it used 16,384 H100 GPUs at once, for months. The team published what went wrong during one 54-day stretch. The training job was interrupted 466 times. 47 of those were planned, like a deliberate restart. The other 419 were surprises, and about 78% of the surprises were hardware problems, confirmed or suspected: mostly faulty GPUs and their memory.
419 surprises in 54 days is one about every three hours, day and night. And this was a well-run cluster with good hardware. The team still kept the job doing useful work more than 90% of the time, because the whole system was built to expect failure.
Your cluster has 1,024 of the same GPUs. A job uses all of them. Roughly how often will it be interrupted?
- About every three hours, the same
- About every two days
- Every few months
Answer. Here's the sum. Spread Meta's 419 surprises over 16,384 GPUs and 54 days, and it works out to one interruption for each GPU every 2,111 days or so. (Not every surprise was a GPU's fault, but every GPU added its share of risk.) That's about once every 5.8 years. A single GPU is very reliable.
But a training job across many GPUs stops when any one of them fails. So the failures of all the GPUs add up. With 1,024 GPUs, you get 1,024 chances, and 2,111 days divided by 1,024 is about two days. With 16,384, it's three hours. This is the most important idea in running a fleet: at scale, failure isn't an accident. It's a rate, and you plan for it like you plan for electricity bills.
Identical machines that drift
Hardware failing is the loud problem. The quiet one is drift: machines that started out identical slowly become different. Someone tests a newer driver on one node and forgets to undo it. Ubuntu's automatic security updates (unattended-upgrades) install a new kernel everywhere, but it only starts running on the nodes that happen to reboot. A colleague lowers one GPU's power limit for an experiment.
None of these breaks anything on its own. But a training job across many nodes runs at the speed of its slowest one (the straggler from Down the Wire). And when something does go wrong, “it only fails on gpu-031” is much harder to debug when gpu-031 is secretly different from the others.
The grid below is a 64-node cluster, one square per node. Pale blue squares match the rest of the fleet. Pink squares are different.
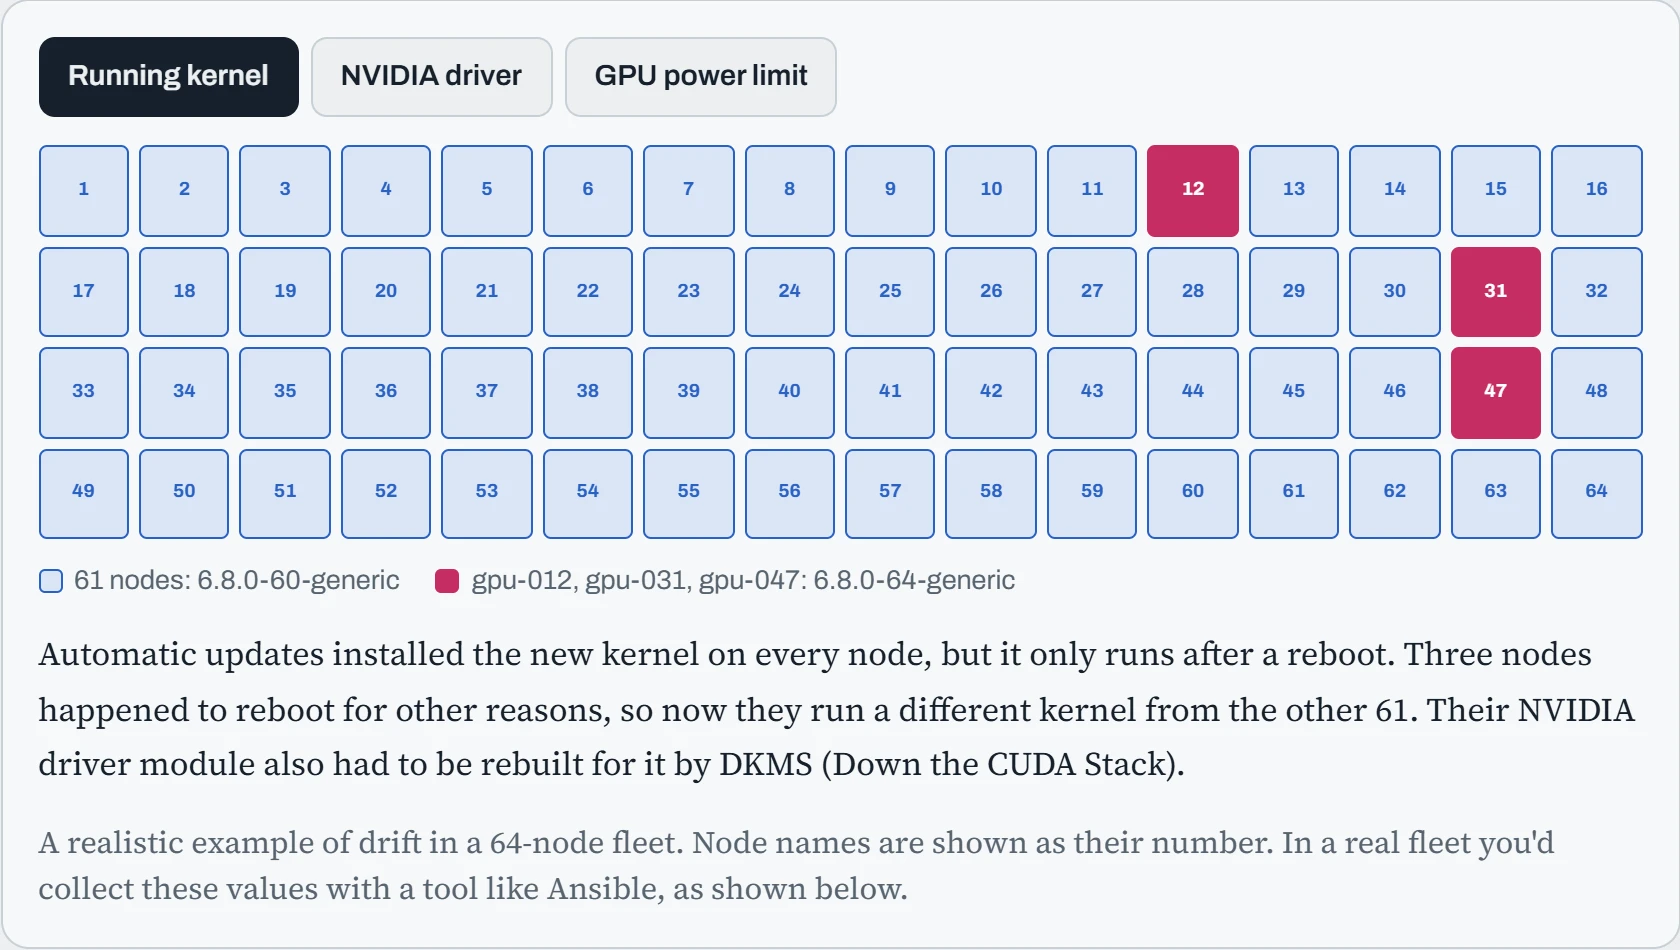
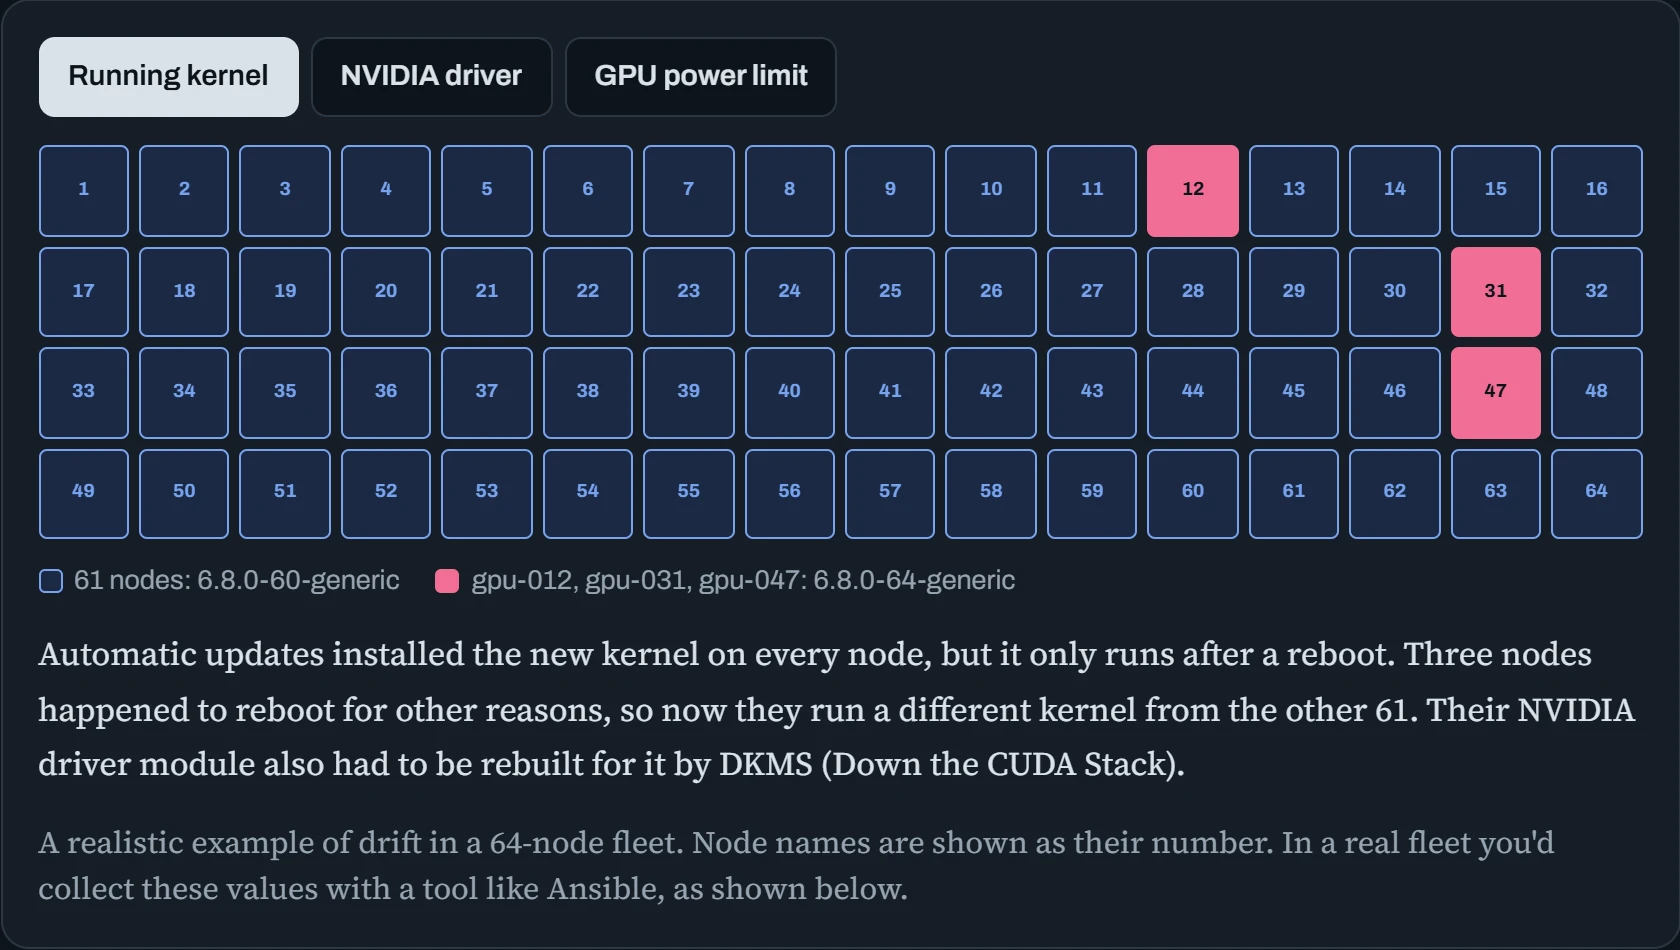
Three different settings, five odd nodes, and nothing that shows up on a dashboard as an error. This is normal. Any fleet left alone drifts. The answer is to describe what every node should look like in code, and keep checking the real nodes against it.
A popular tool for this is Ansible. It logs in to every machine over SSH and runs the same command or the same list of steps (a playbook) on all of them. Start by just asking every node a question and counting the answers:
$ ansible gpu -m shell -a "uname -r" -o | awk '{print $NF}' | sort | uniq -c
     61 6.8.0-60-generic
      3 6.8.0-64-generic
$ ansible gpu -m shell -a "uname -r" -o | grep 6.8.0-64
gpu-012 | CHANGED | rc=0 | (stdout) 6.8.0-64-generic
gpu-031 | CHANGED | rc=0 | (stdout) 6.8.0-64-generic
gpu-047 | CHANGED | rc=0 | (stdout) 6.8.0-64-generic
Two commands, and the three odd nodes have names. Then write down the rule, so drift can't creep back in. This playbook step tells apt to hold the kernel and driver packages at the fleet's version, so automatic updates leave them alone:
- name: Hold the kernel and NVIDIA driver at the fleet version
  ansible.builtin.dpkg_selections:
    name: "{{ item }}"
    selection: hold
  loop: [linux-image-generic, linux-headers-generic, nvidia-driver-570-server]
Running the whole playbook with --check --diff changes nothing. It just reports, node by node, everything that differs from what the playbook says. Run it every night and alert on any change, and drift becomes a daily report instead of a mystery.
The other half of the answer is a golden image: one tested disk image with the OS, kernel, driver and settings already in place, built by a tool like Packer and given a version number. A node that misbehaves isn't repaired by hand. It's wiped and reinstalled from the image. Engineers call this treating servers like cattle, not pets: no single one is special enough to nurse.
How often to checkpoint
If failures arrive at a steady rate, the question becomes how much each one costs. When a job dies, everything since its last checkpoint is lost. So you'd think: save very often. But saving isn't free either. While a checkpoint is being written, training usually pauses.
That's a tug of war. Save rarely, and each failure throws away a lot of work: on average, half the gap between saves, plus the time to restart. Save often, and you spend a lot of time saving. Somewhere in between is a best gap. A simple rule found back in 1974 (Young's formula) says the best gap is about the square root of (2 × save time × average time between failures).
The share of time spent on real training is called goodput. The chart plots goodput (up the side) against how many minutes you leave between checkpoints (along the bottom, on a stretched scale so short and long gaps both fit). The green dot is the best gap. The pink dot is the gap you chose. Start with Meta's 16,384 GPUs, then try a smaller cluster.
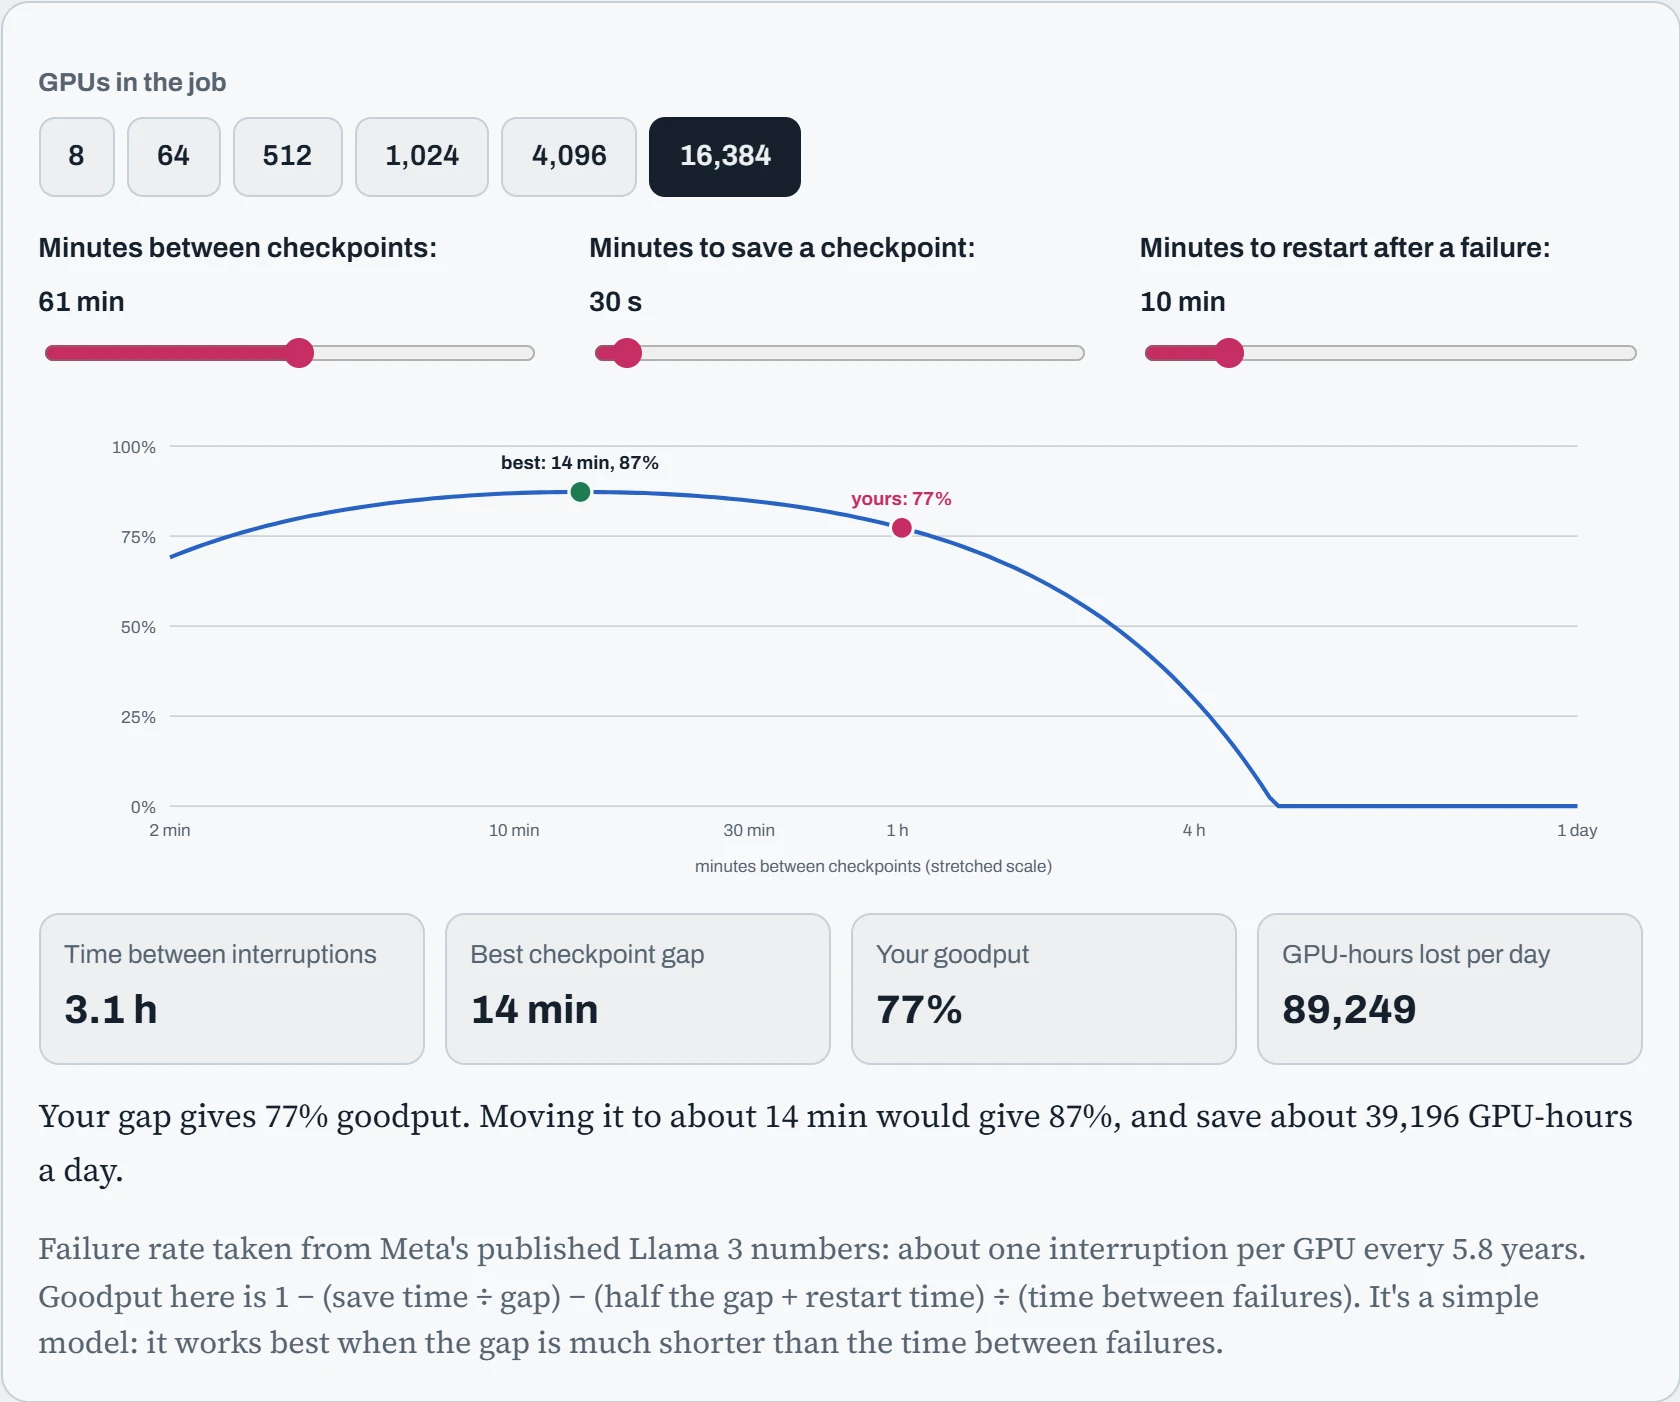
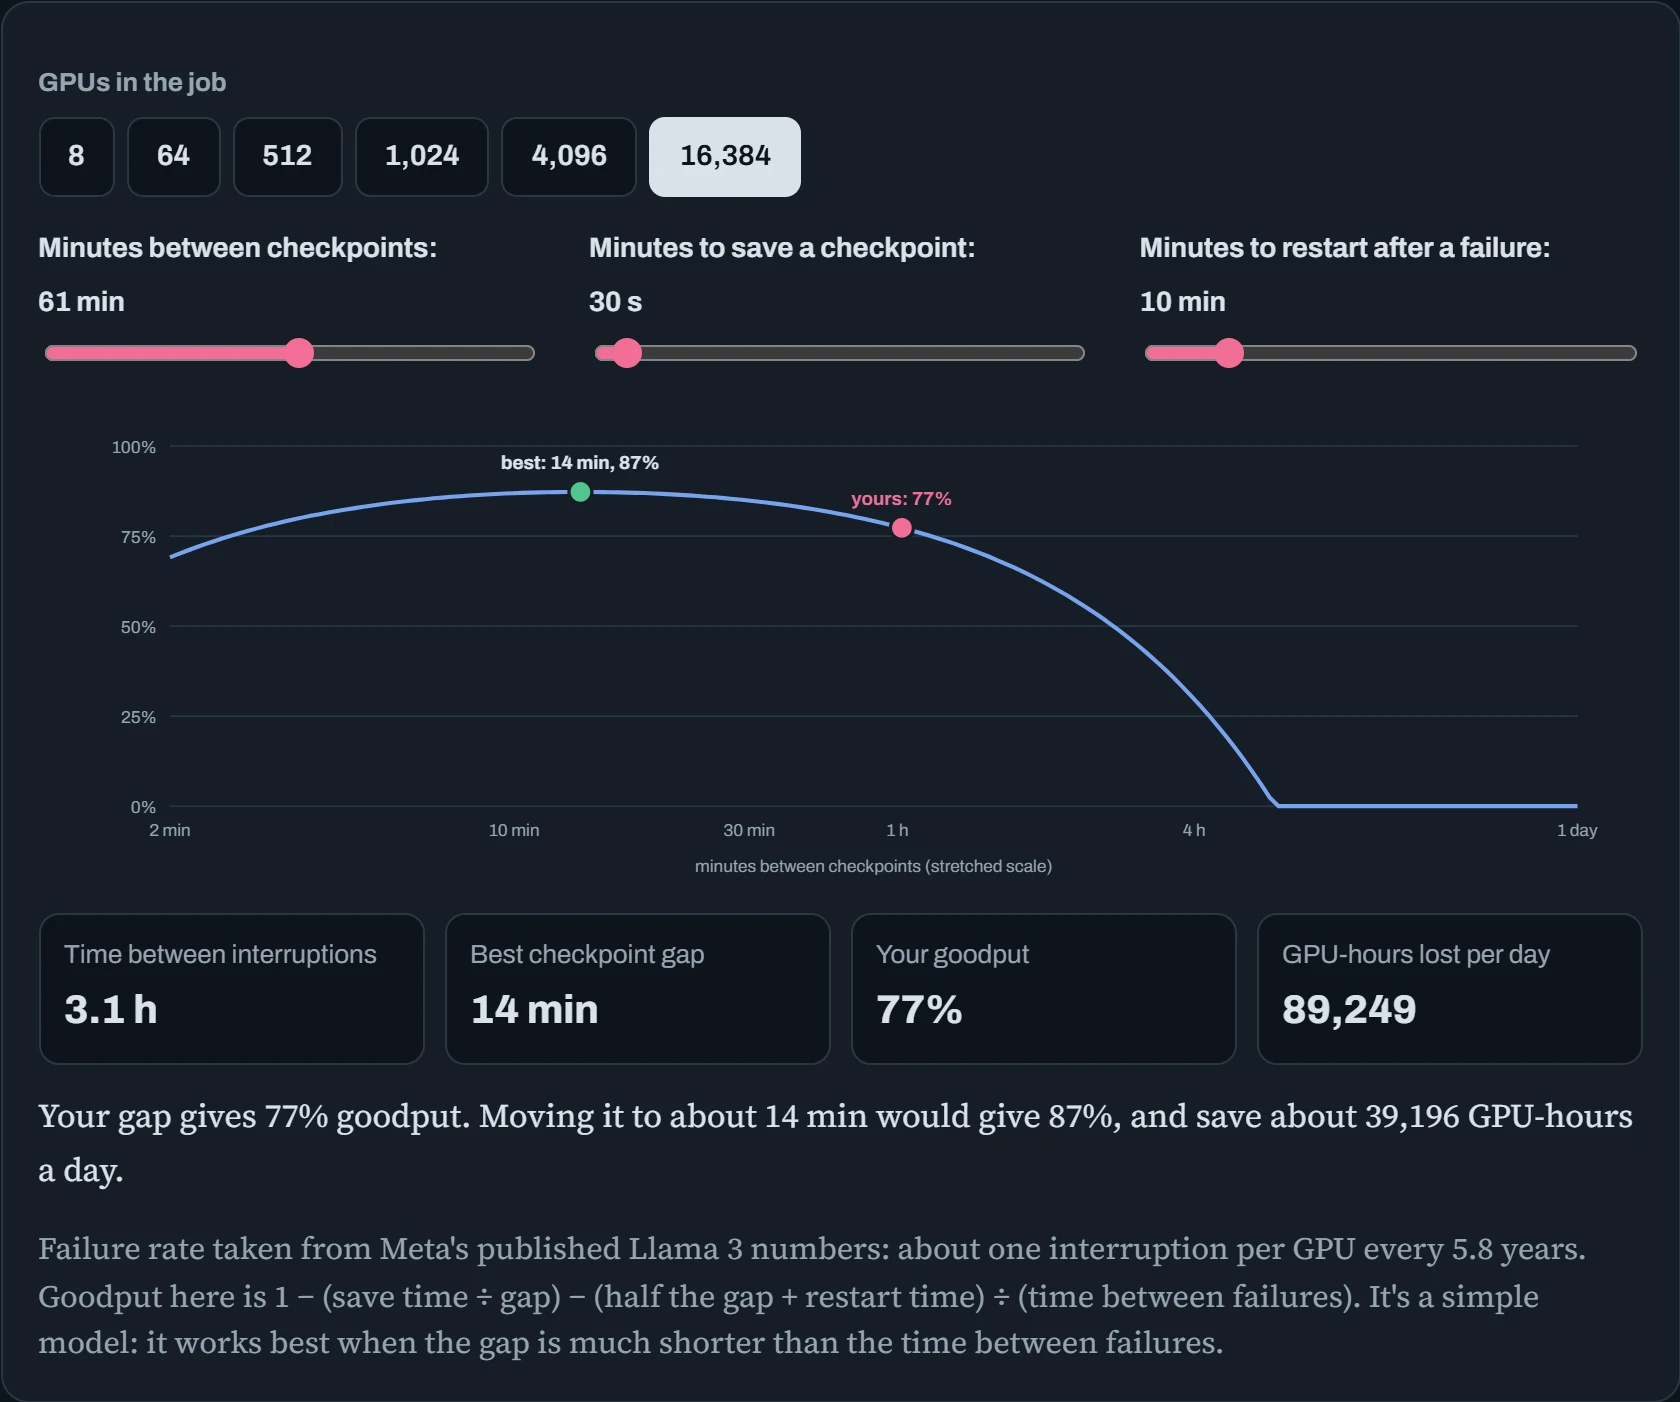
With 16,384 GPUs and an hourly checkpoint, more than a fifth of the cluster's time is thrown away. At that scale it's tens of thousands of GPU-hours every day. Move the gap to the green dot, about 14 minutes, and goodput rises by about ten points, without buying anything. Now take 8 GPUs. Failures are so rare that the best gap is many hours, and checkpoint timing barely matters.
Two other numbers matter as much as the gap. Make saving faster (write first to the fast SSD inside the server, or to CPU memory, and copy to slower storage in the background), and the best gap shrinks. Make restarting faster (keep spare nodes ready, cache images and data close by), and every failure costs less. Big training teams spend real engineering time on both, and this sum is why.
Predict. Stay at 16,384 GPUs, with a 30-second save and a 10-minute restart. Your team makes saving twice as fast. Another team makes restarting twice as fast. Which change gains more goodput?
Answer. Faster restarts win, though not by much. Halving the save time moves the best gap from about 14 minutes to about 10, and goodput goes from about 87% to about 89%. Halving the restart time, from 10 minutes to 5, takes it to about 90%.
The reason is in the formula. With checkpoints at the best gap, saving costs about 4% of the time. But every failure costs the full restart, and failures come every three hours. So at this scale, getting a job running again after a failure matters as much as saving quickly. Big teams keep spare nodes warm for exactly this reason.
Upgrading without an outage
Sooner or later, you have to change every node: a new driver for a security fix, a new kernel, a new CUDA. That's exactly when drift is useful to avoid and dangerous to cause. The safe pattern is the same everywhere, for drivers, operating systems and even model versions: change a few machines, check them properly, and only then change more.
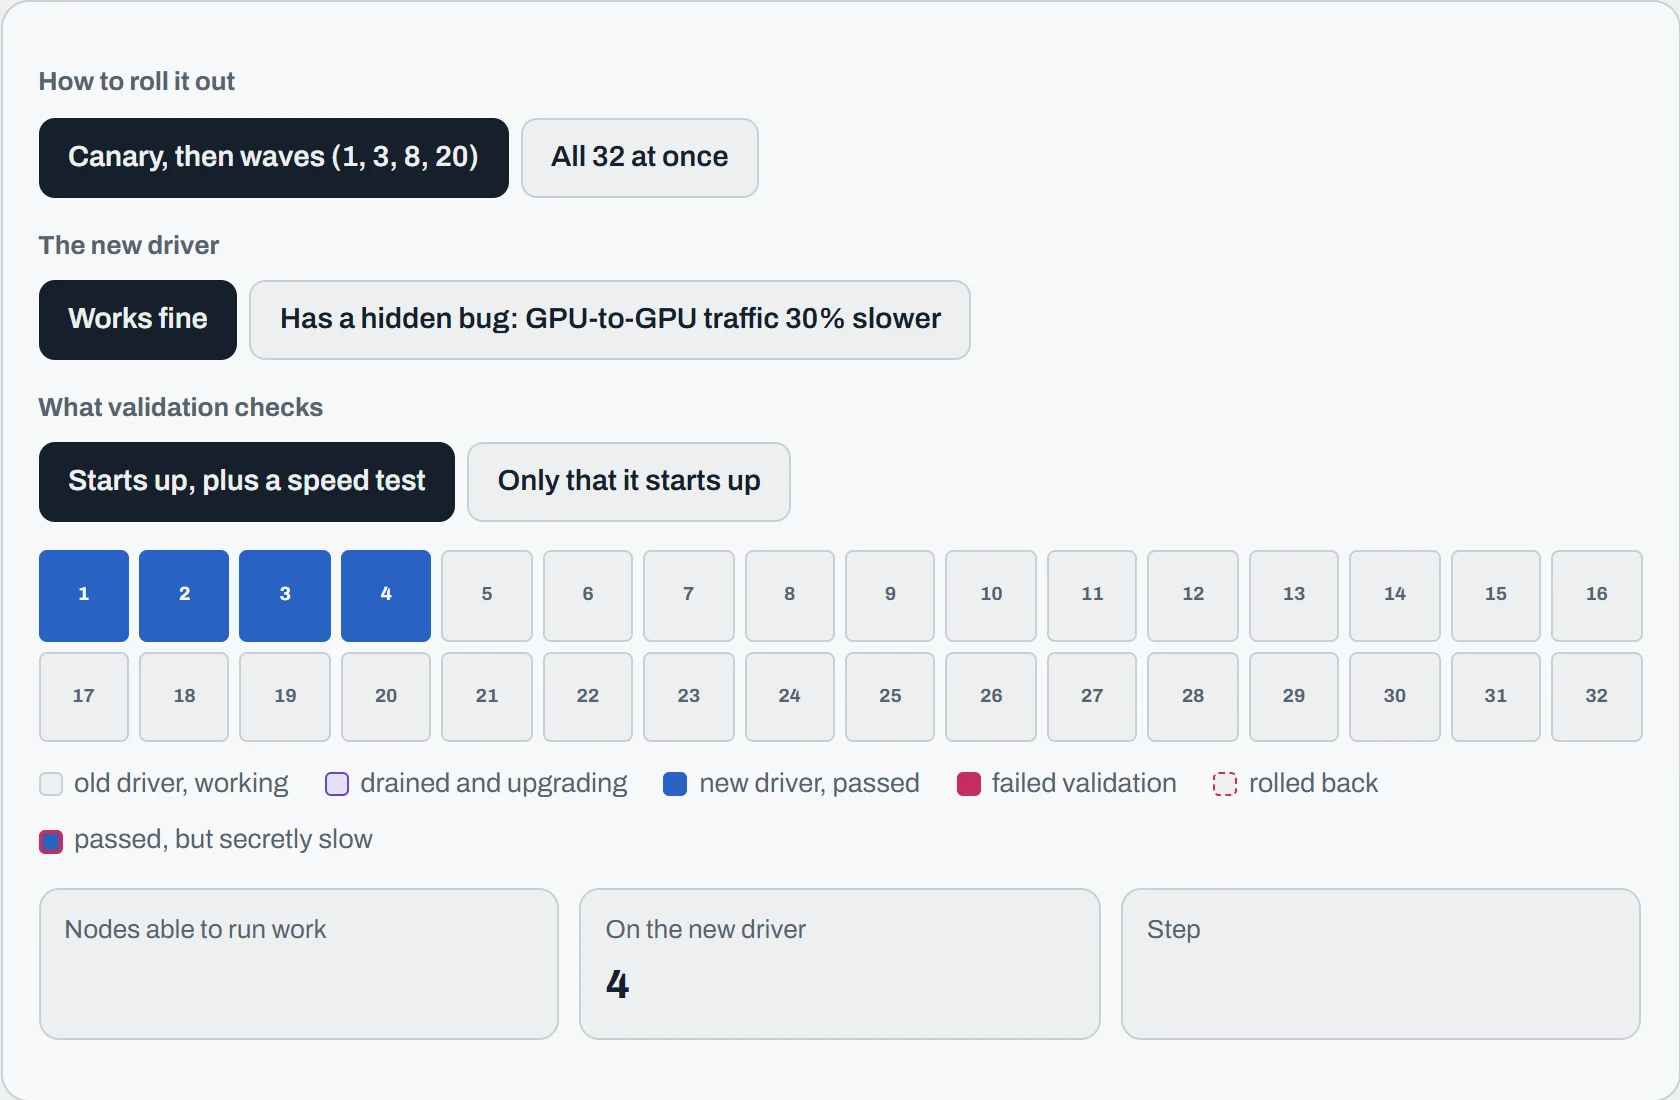
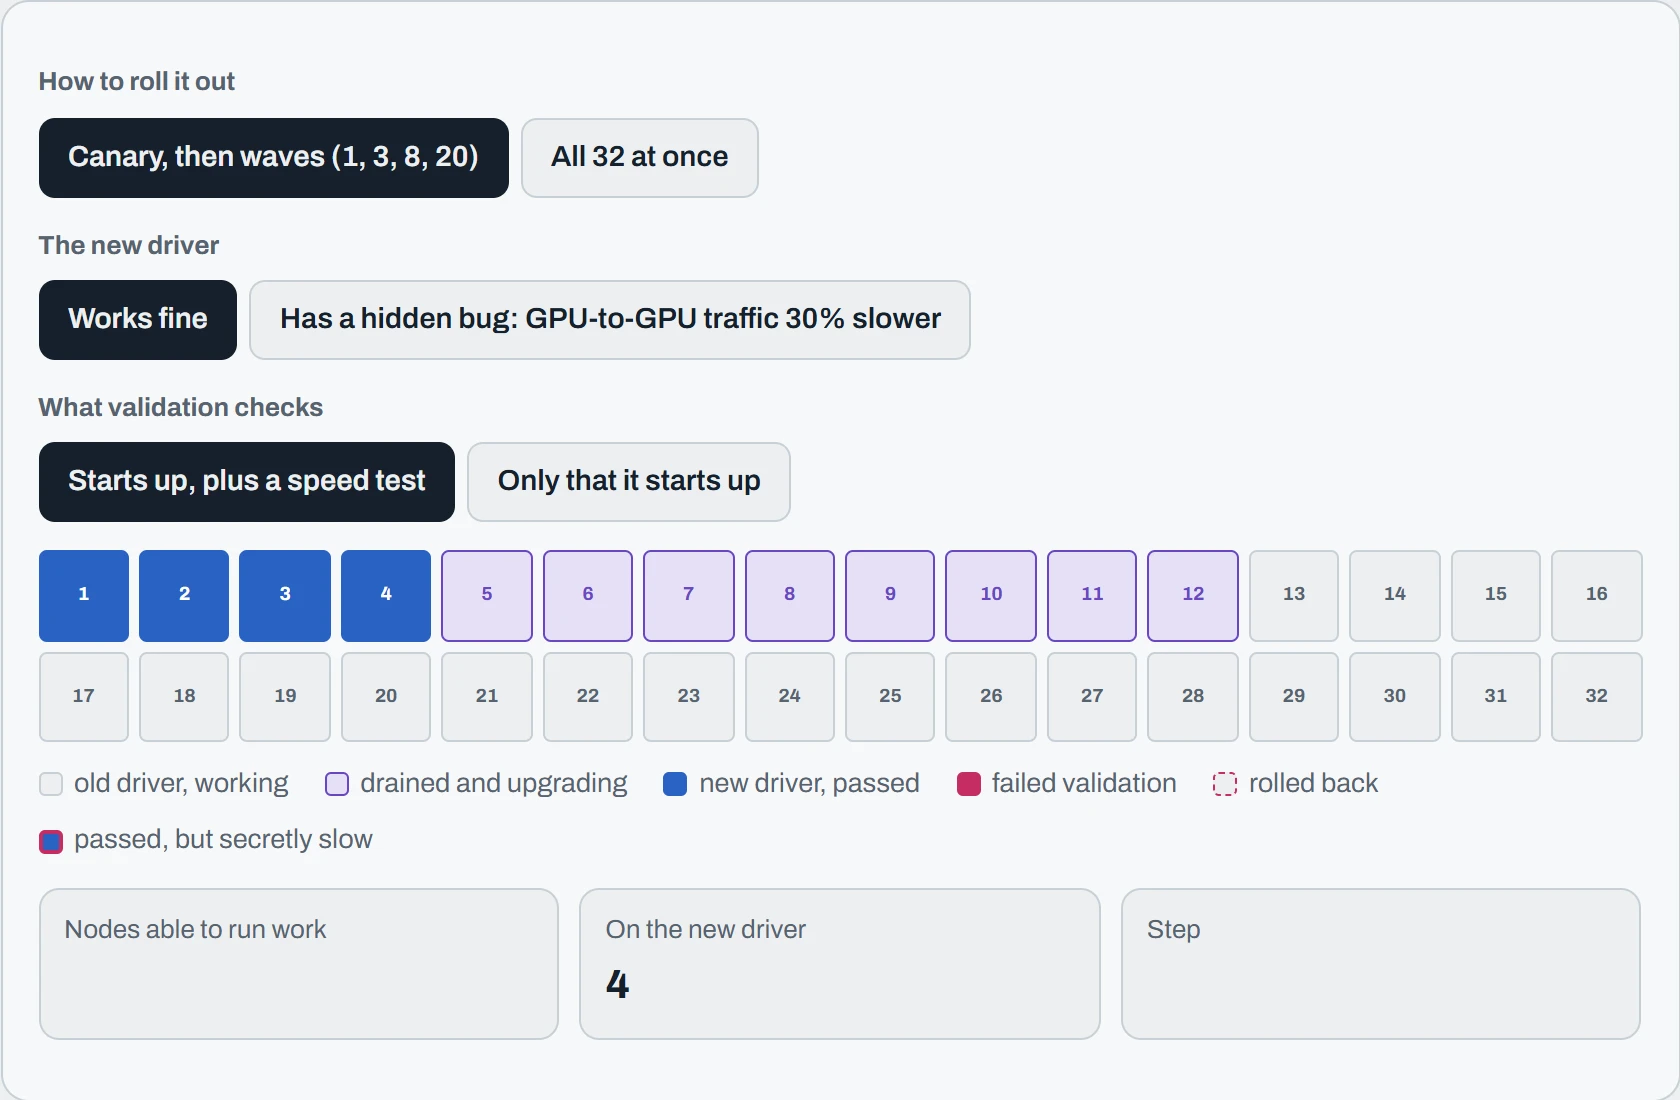
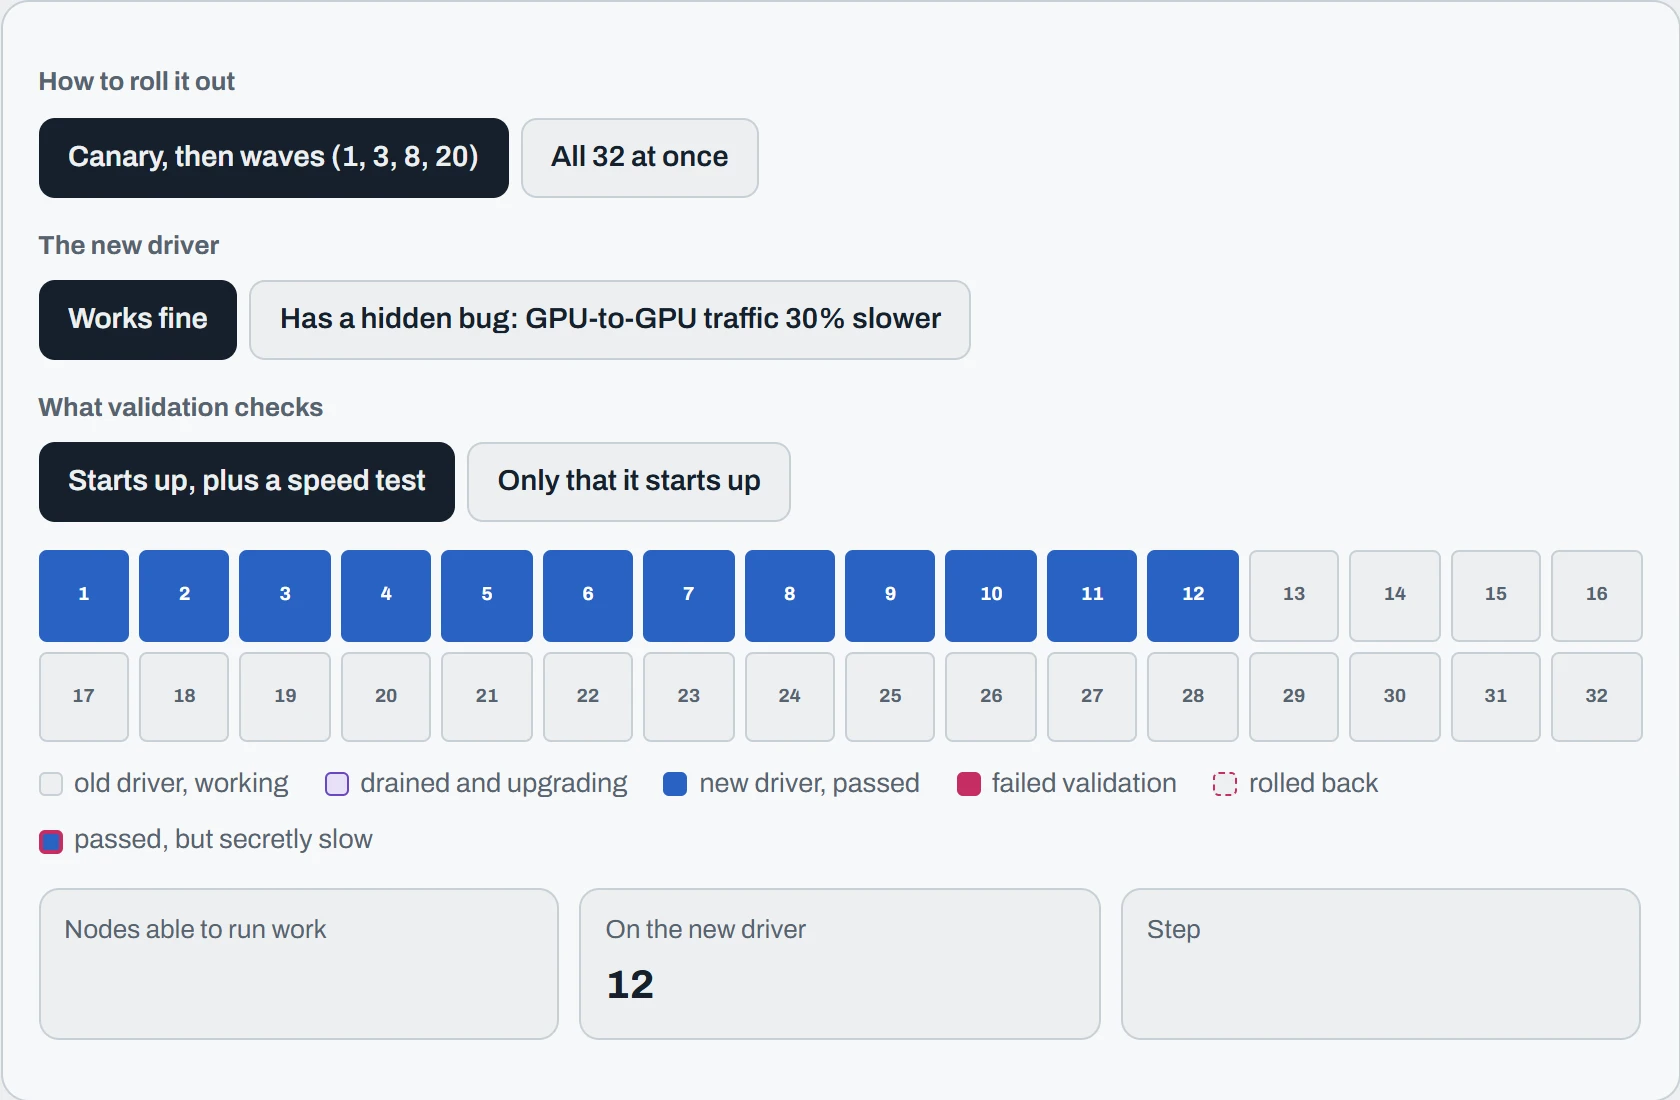
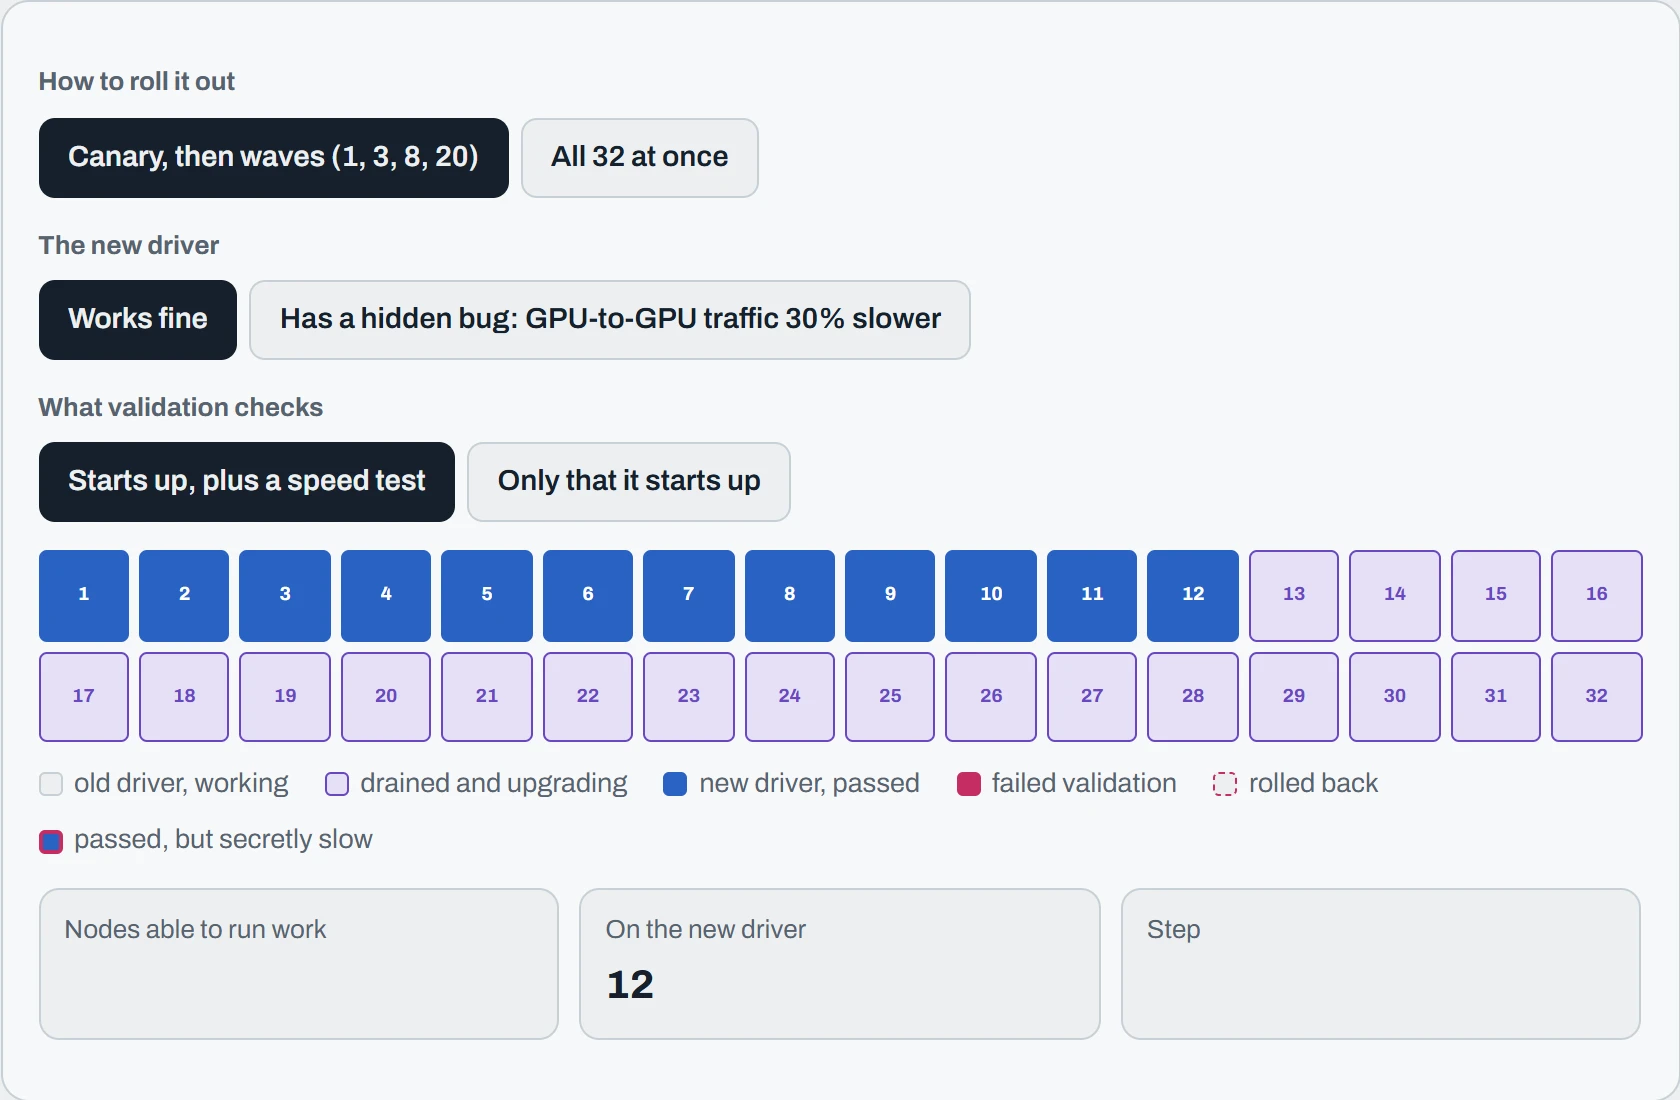
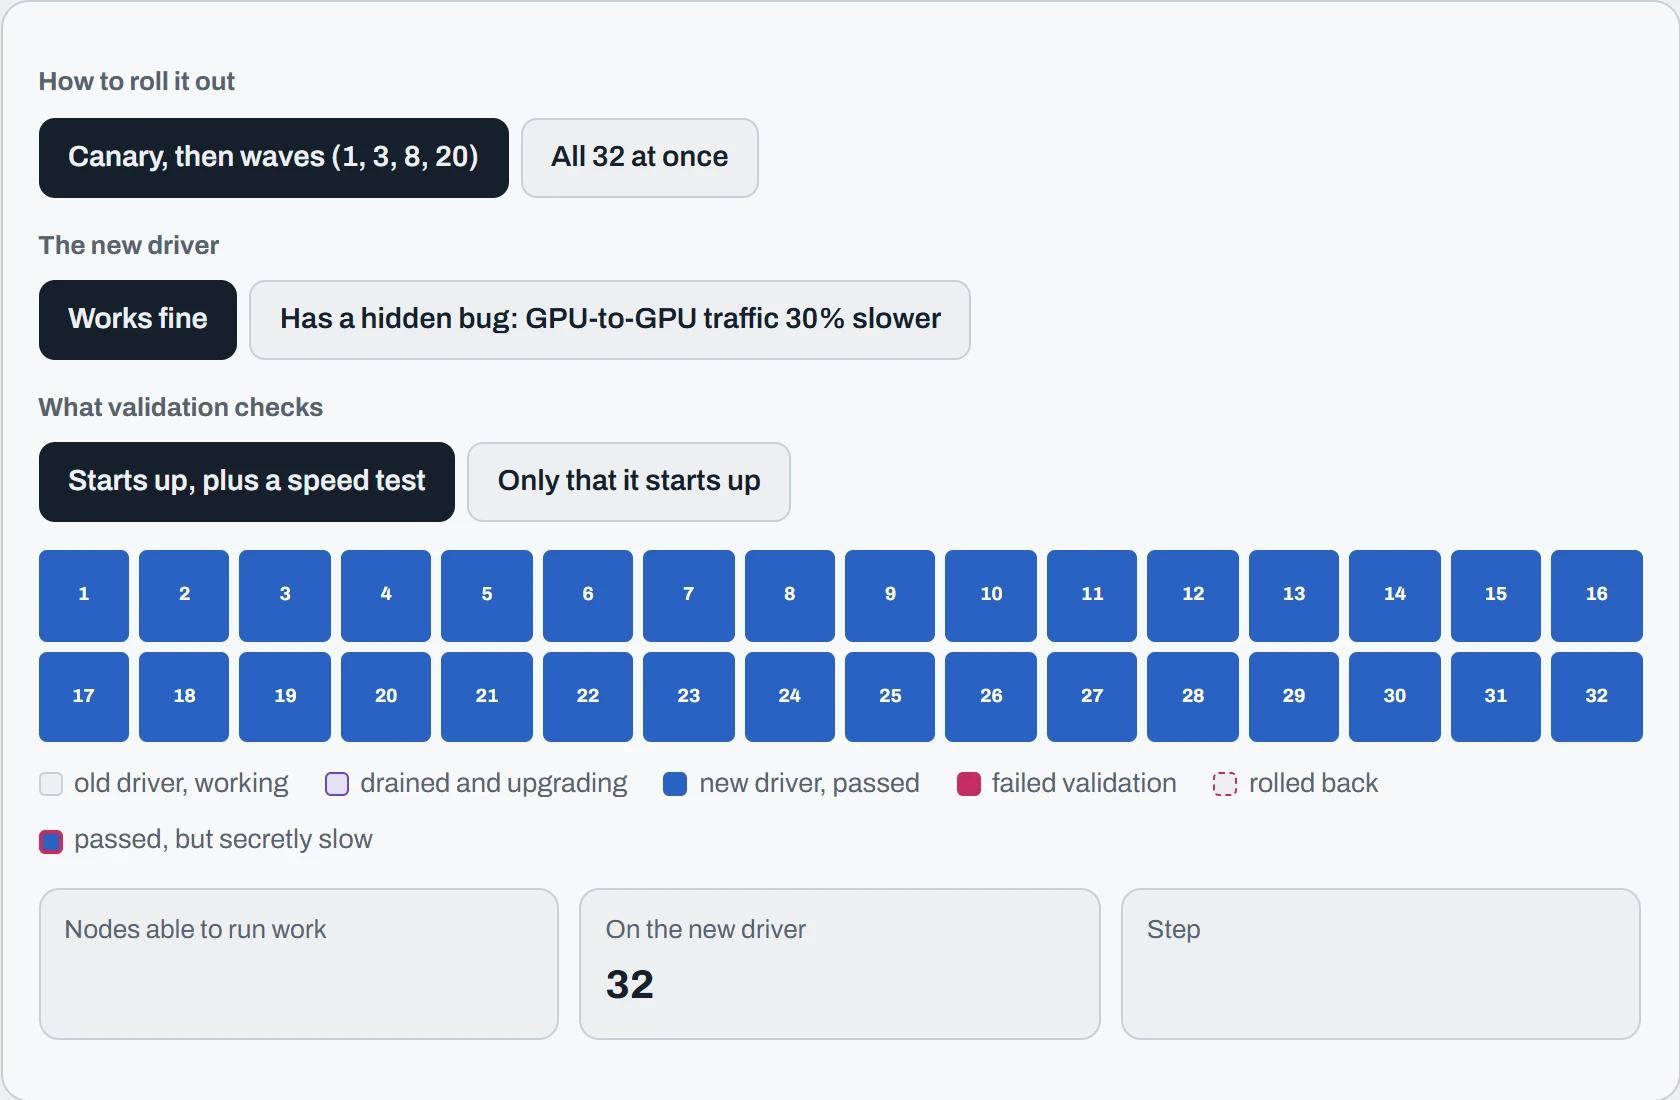
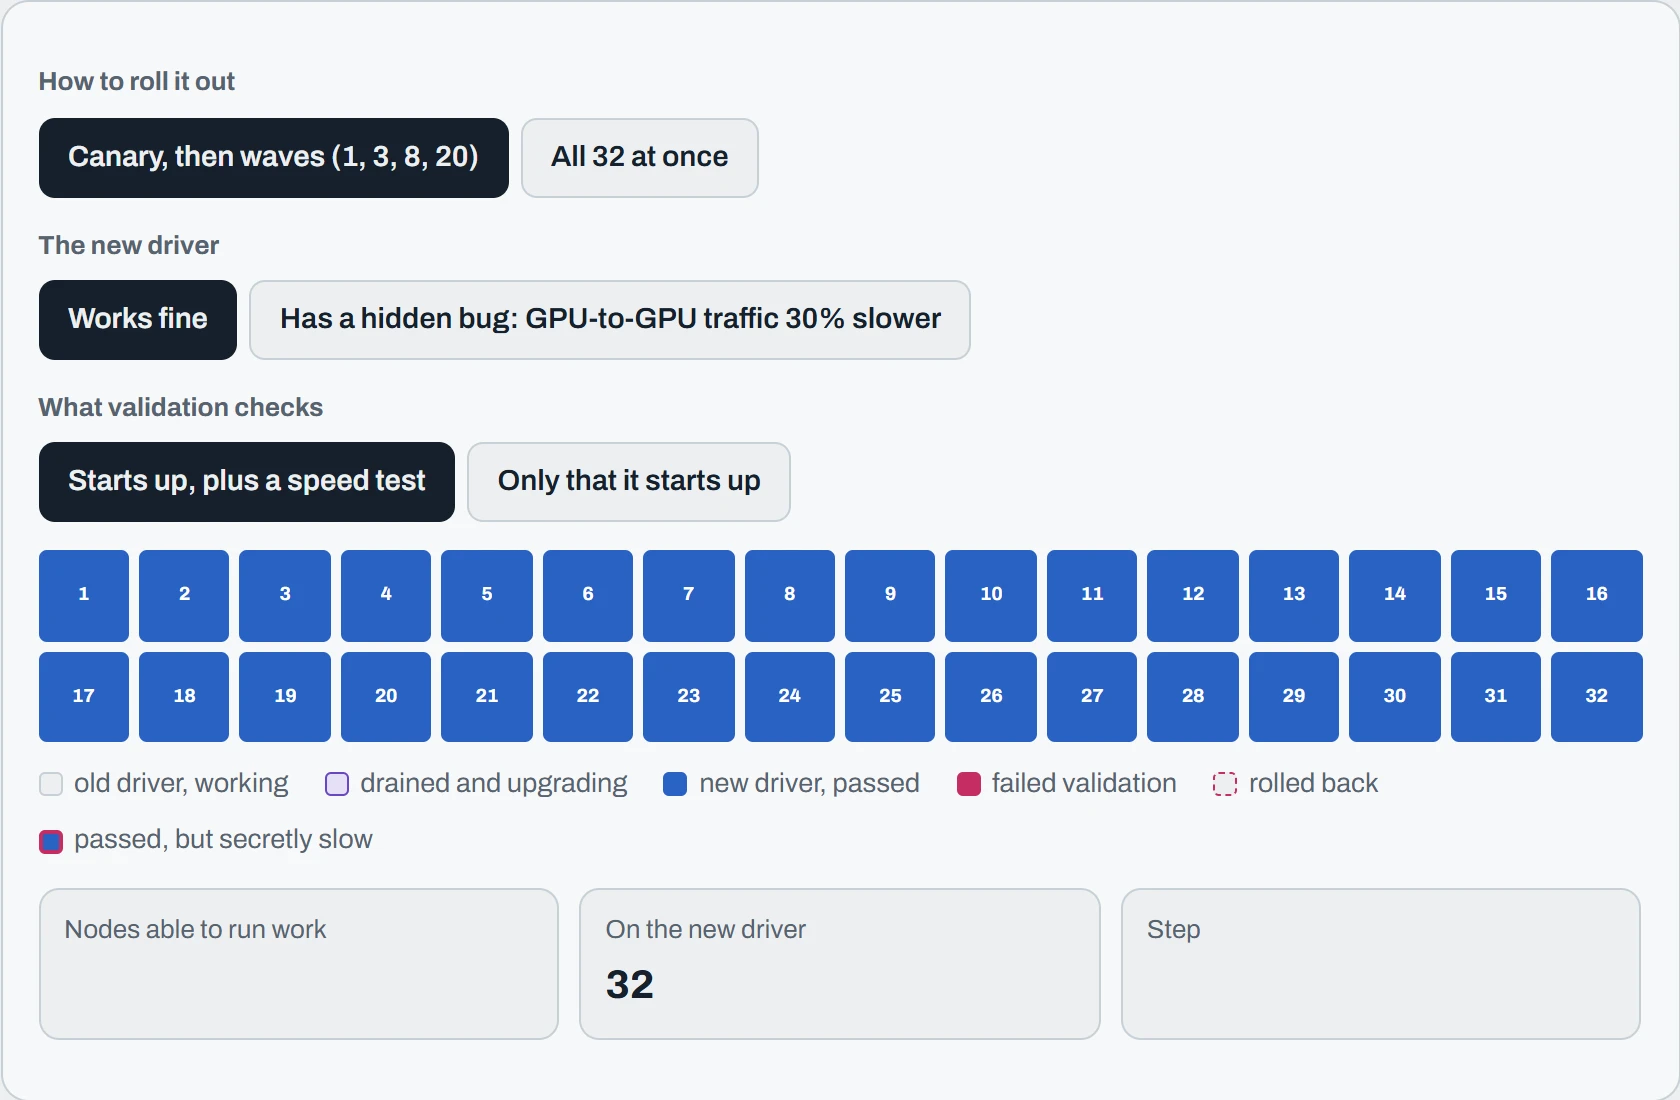
Each node goes through the same steps. Drain it: stop sending it new work, and let or make running jobs move elsewhere. Upgrade it. Validate it with real tests. Return it to service. The first group is tiny, often a single node, and is called the canary, after the birds miners took underground to warn them of bad air. If the canary is fine, the groups (called waves) get bigger.
what if the new driver has a hidden problem, and what if your validation only checks that the node starts up, without measuring its speed?
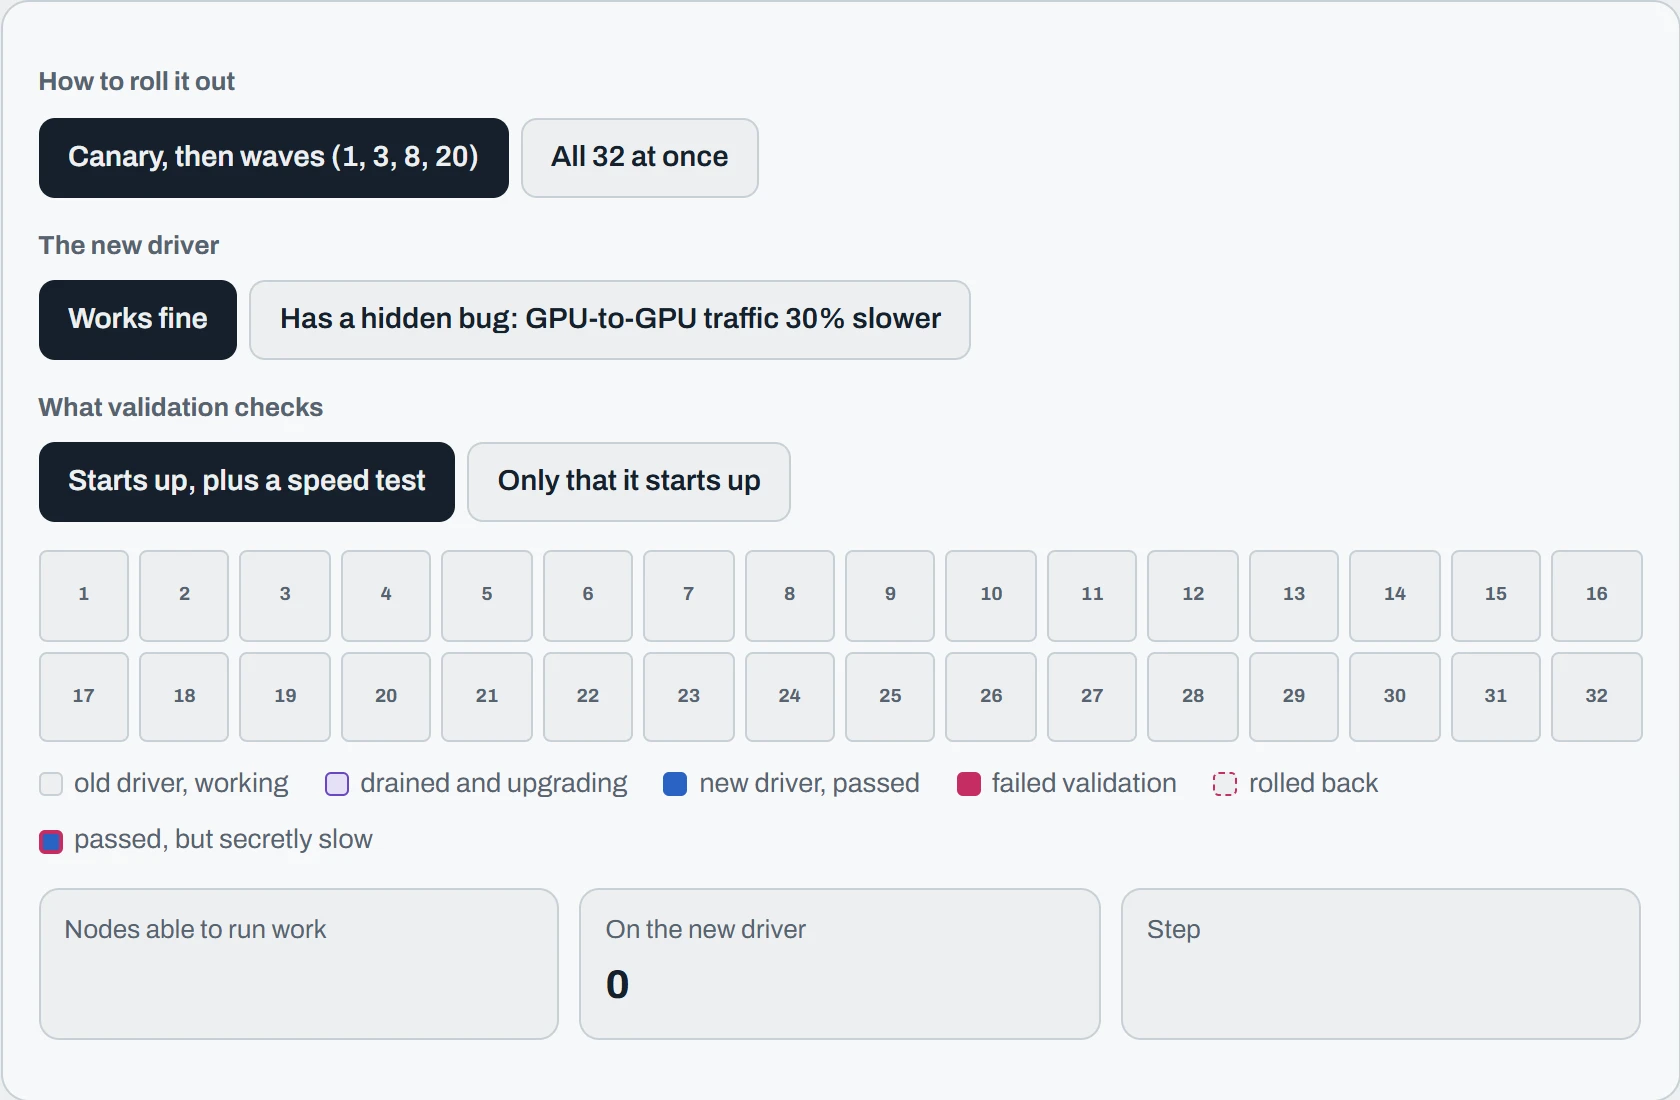
Step 1 of 10
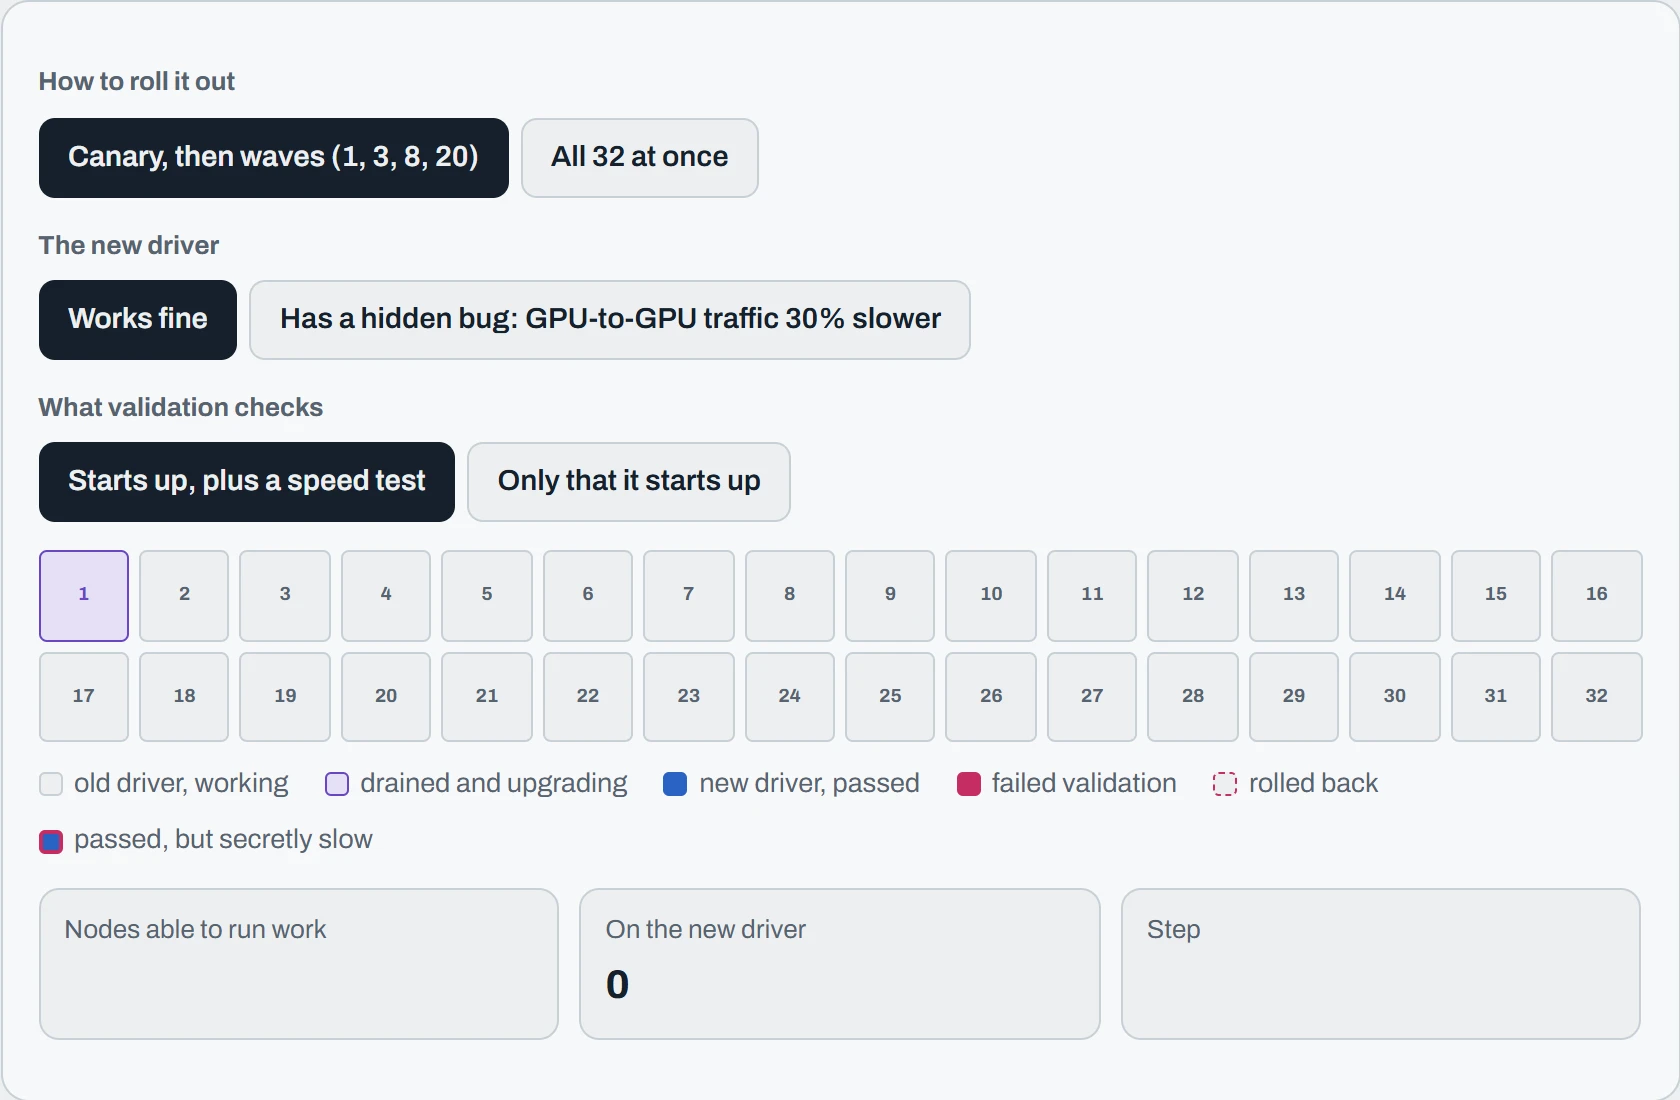
Step 2 of 10
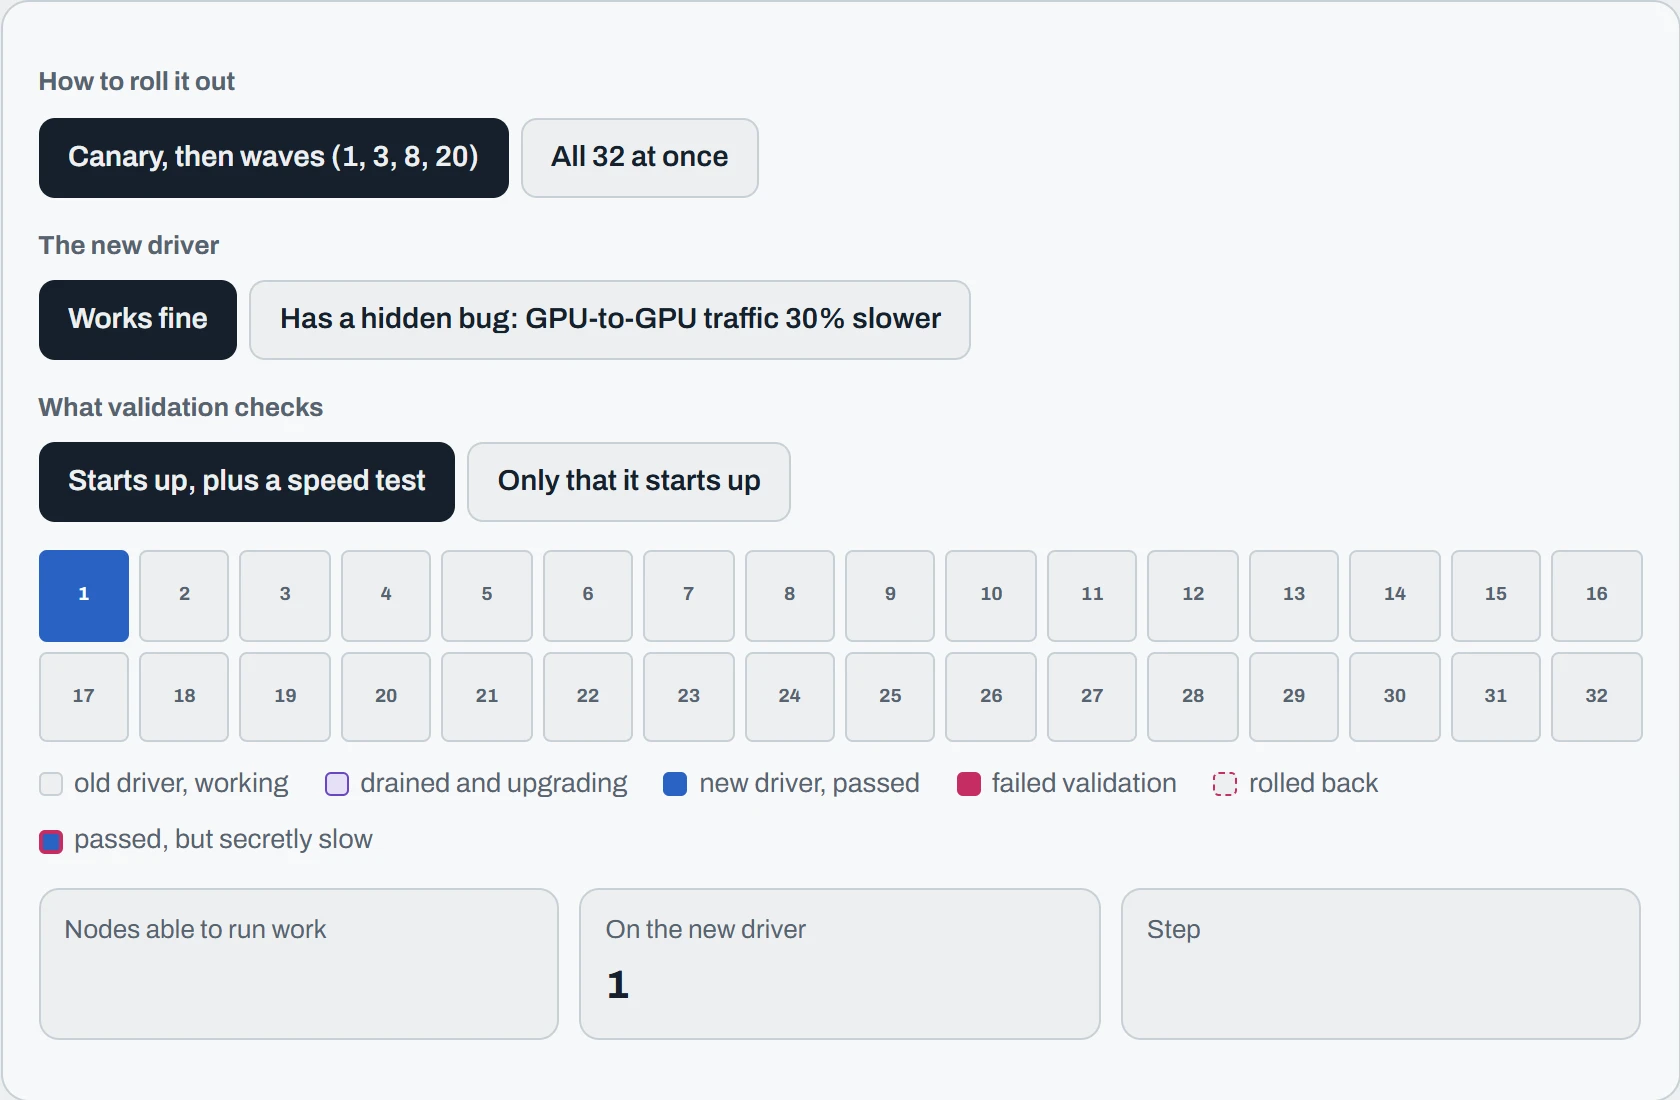
Step 3 of 10
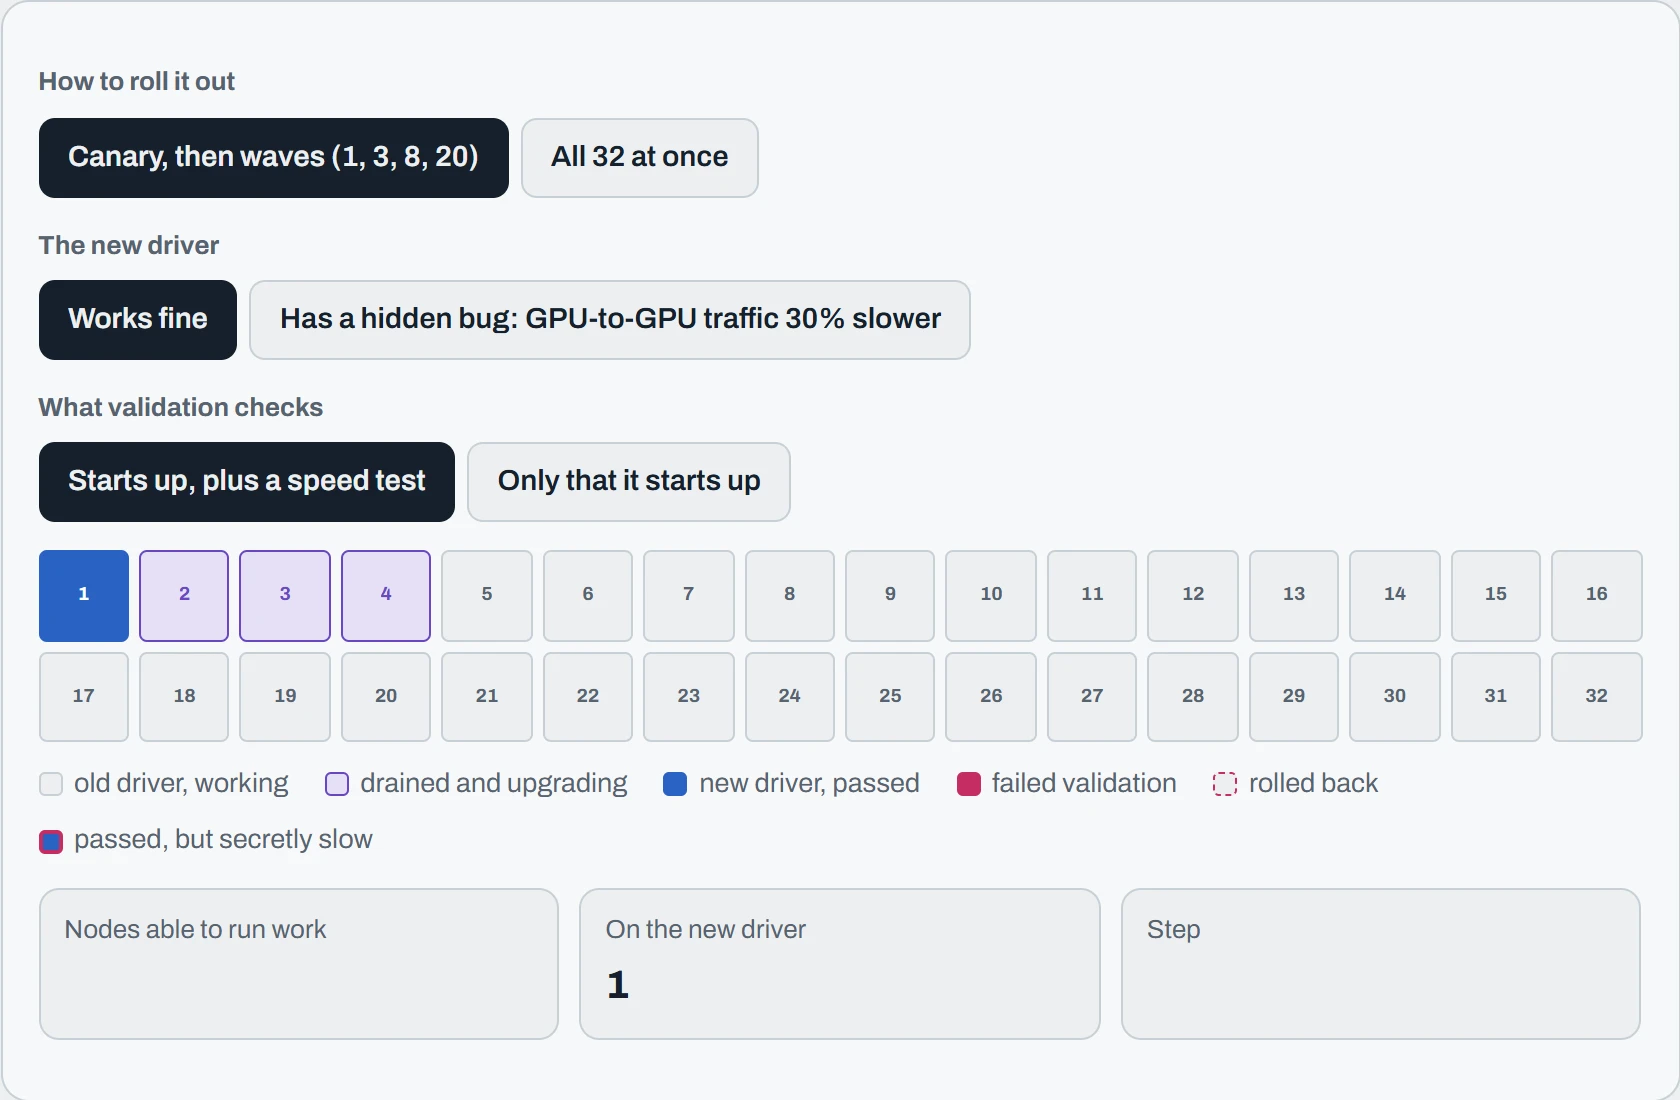
Step 4 of 10
Step 5 of 10
Step 6 of 10
Step 7 of 10
Step 8 of 10
Step 9 of 10
Step 10 of 10
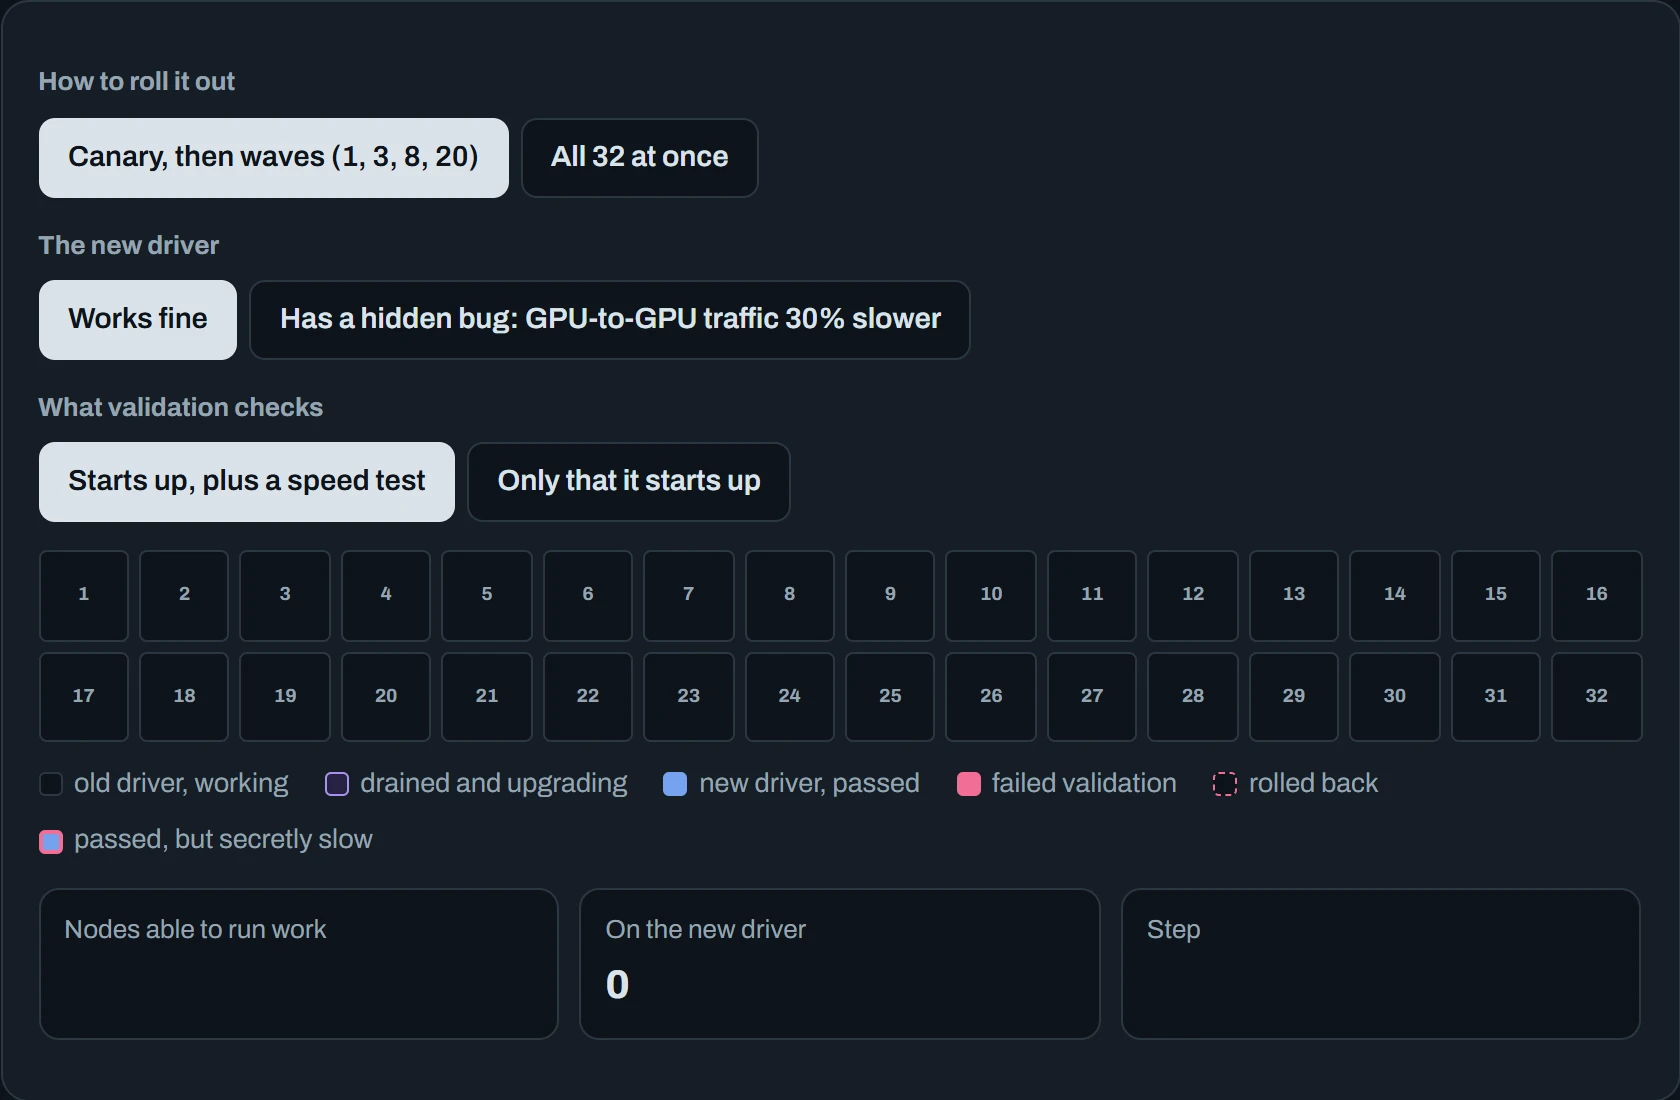
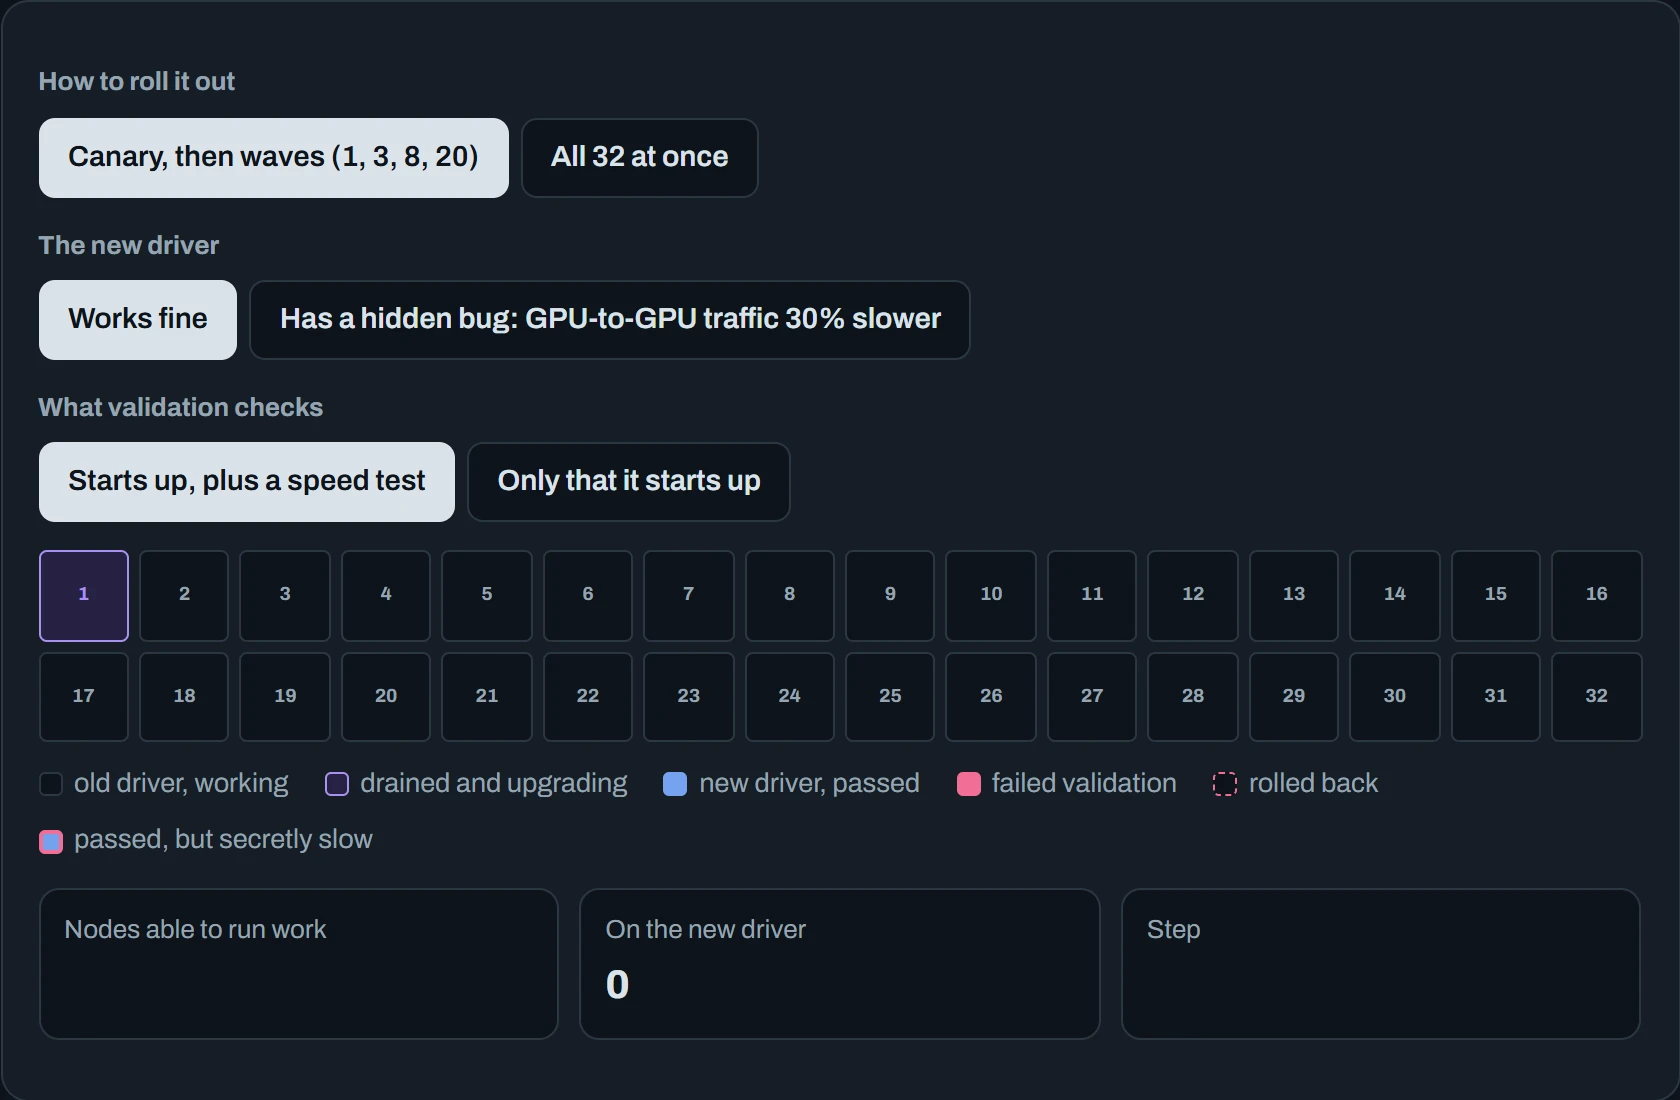
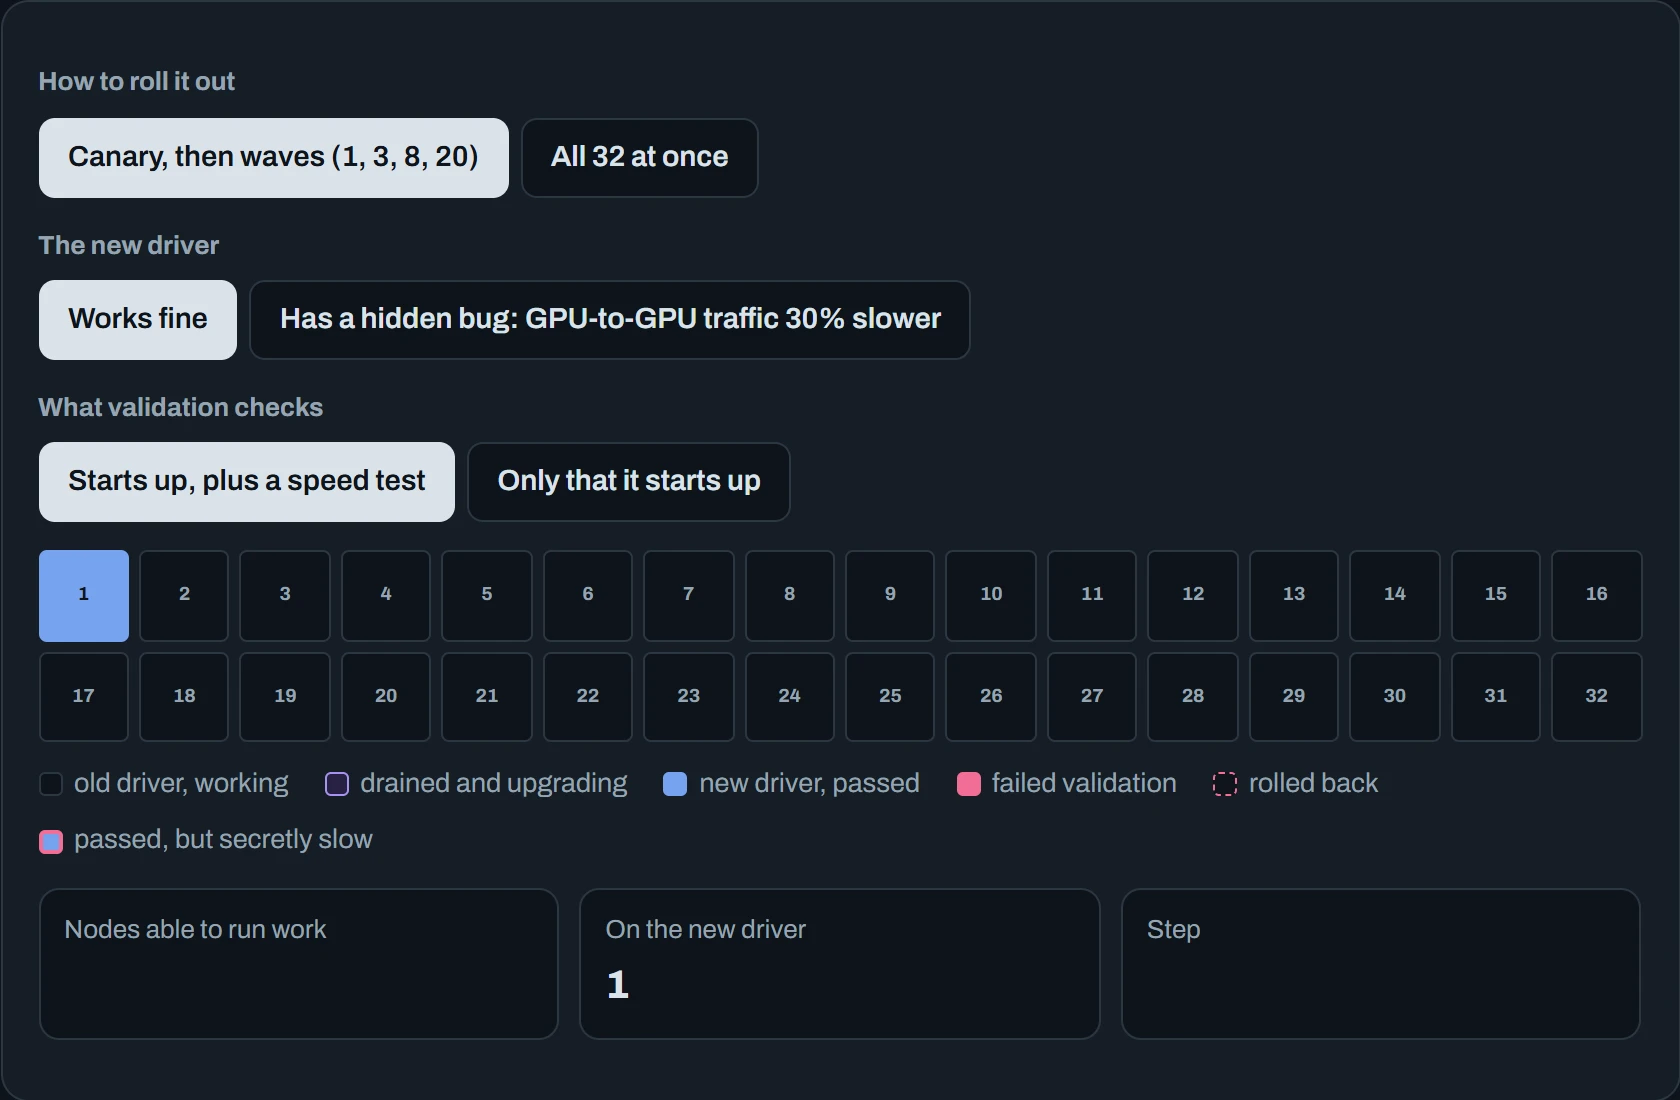
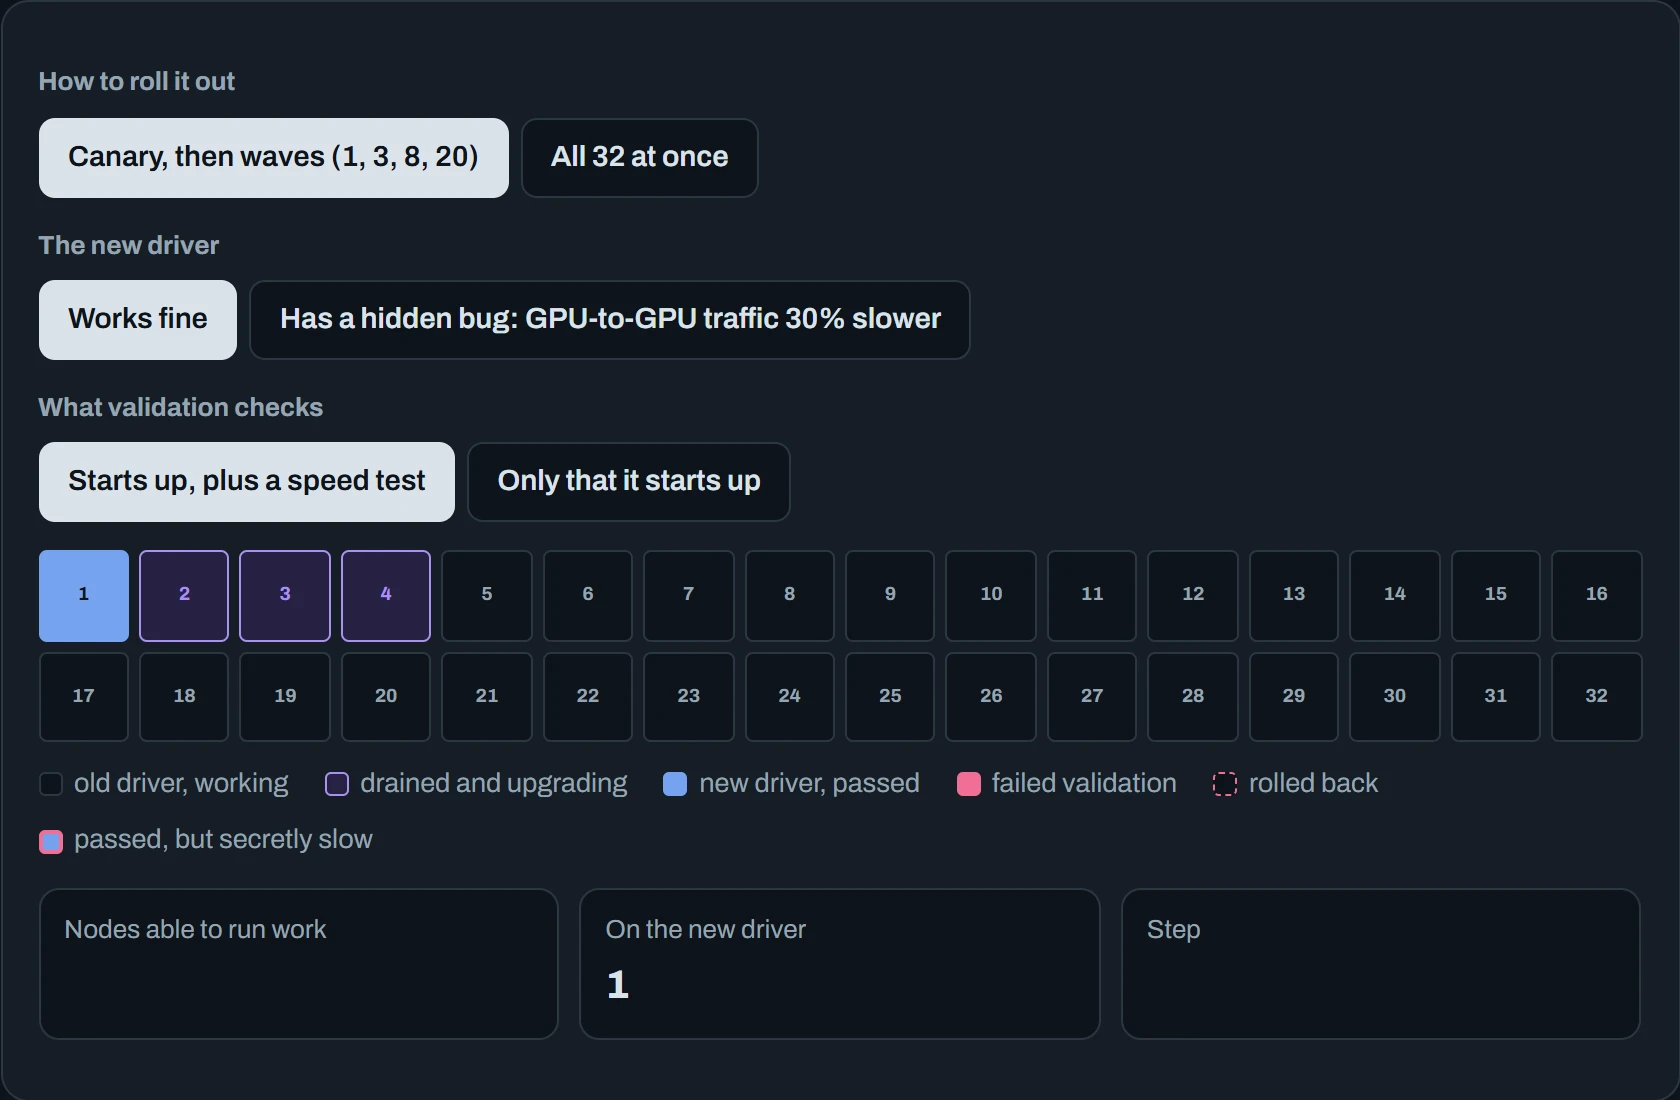
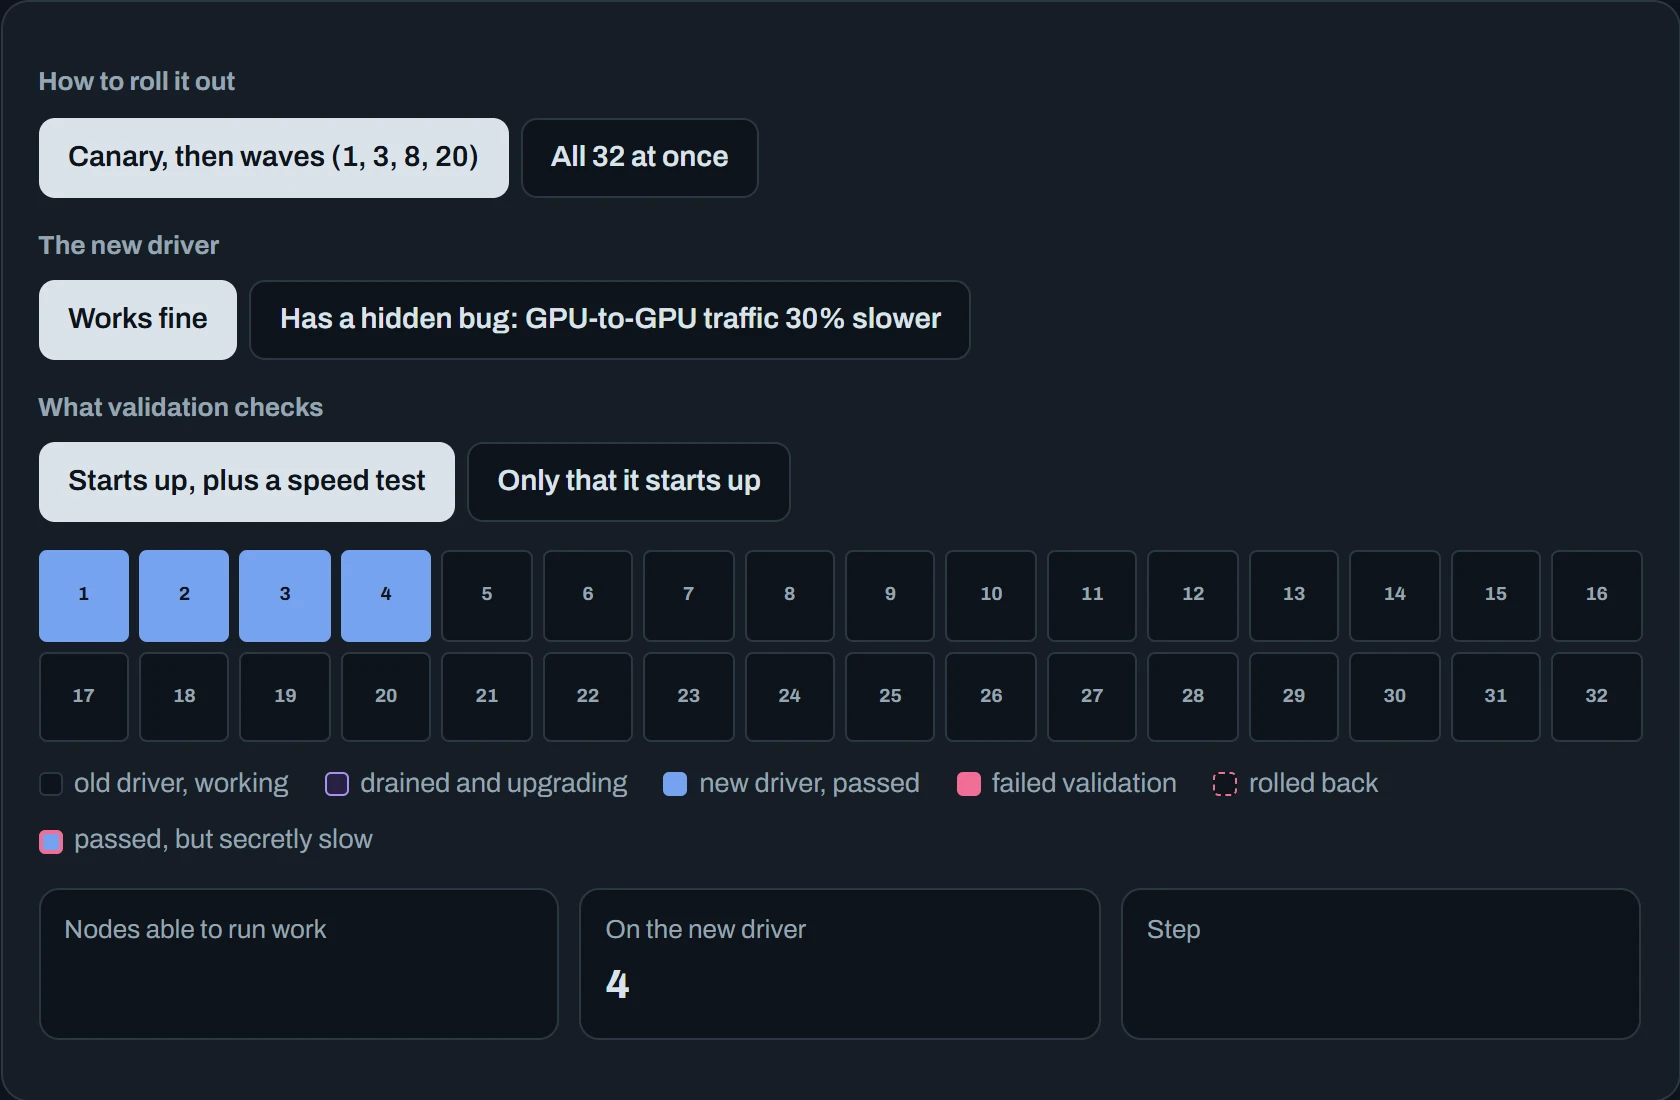
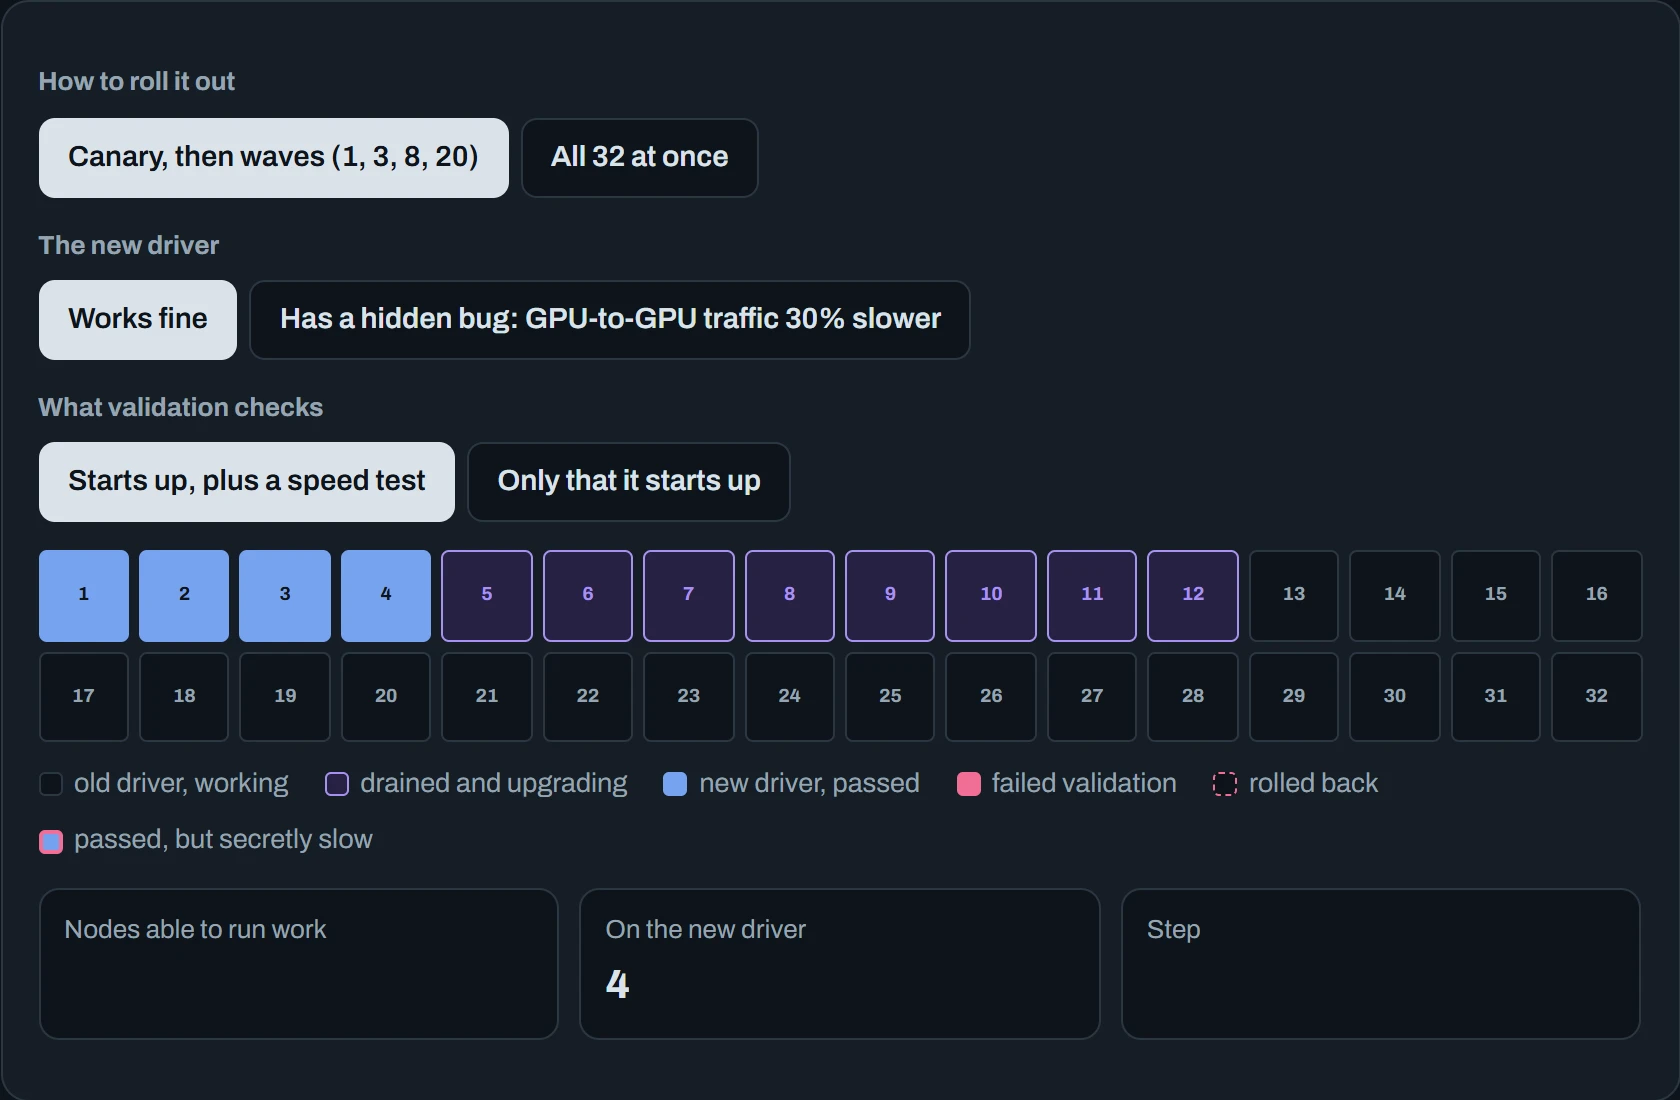
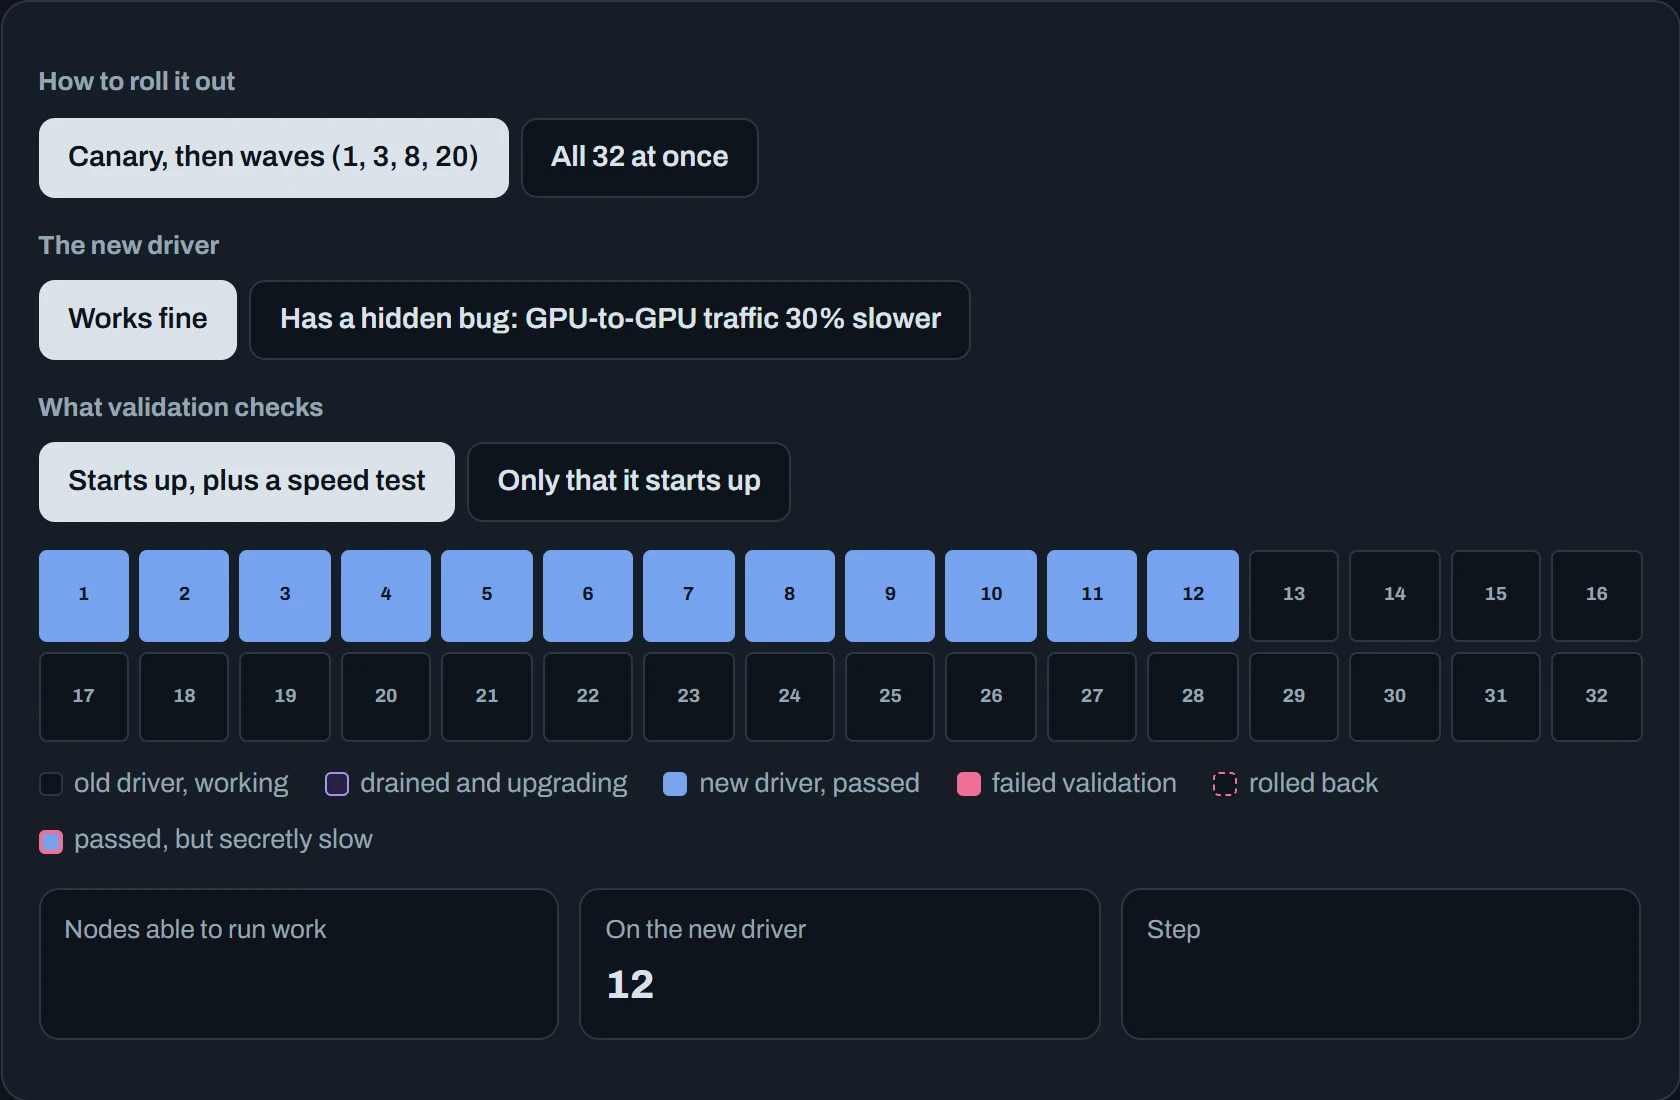
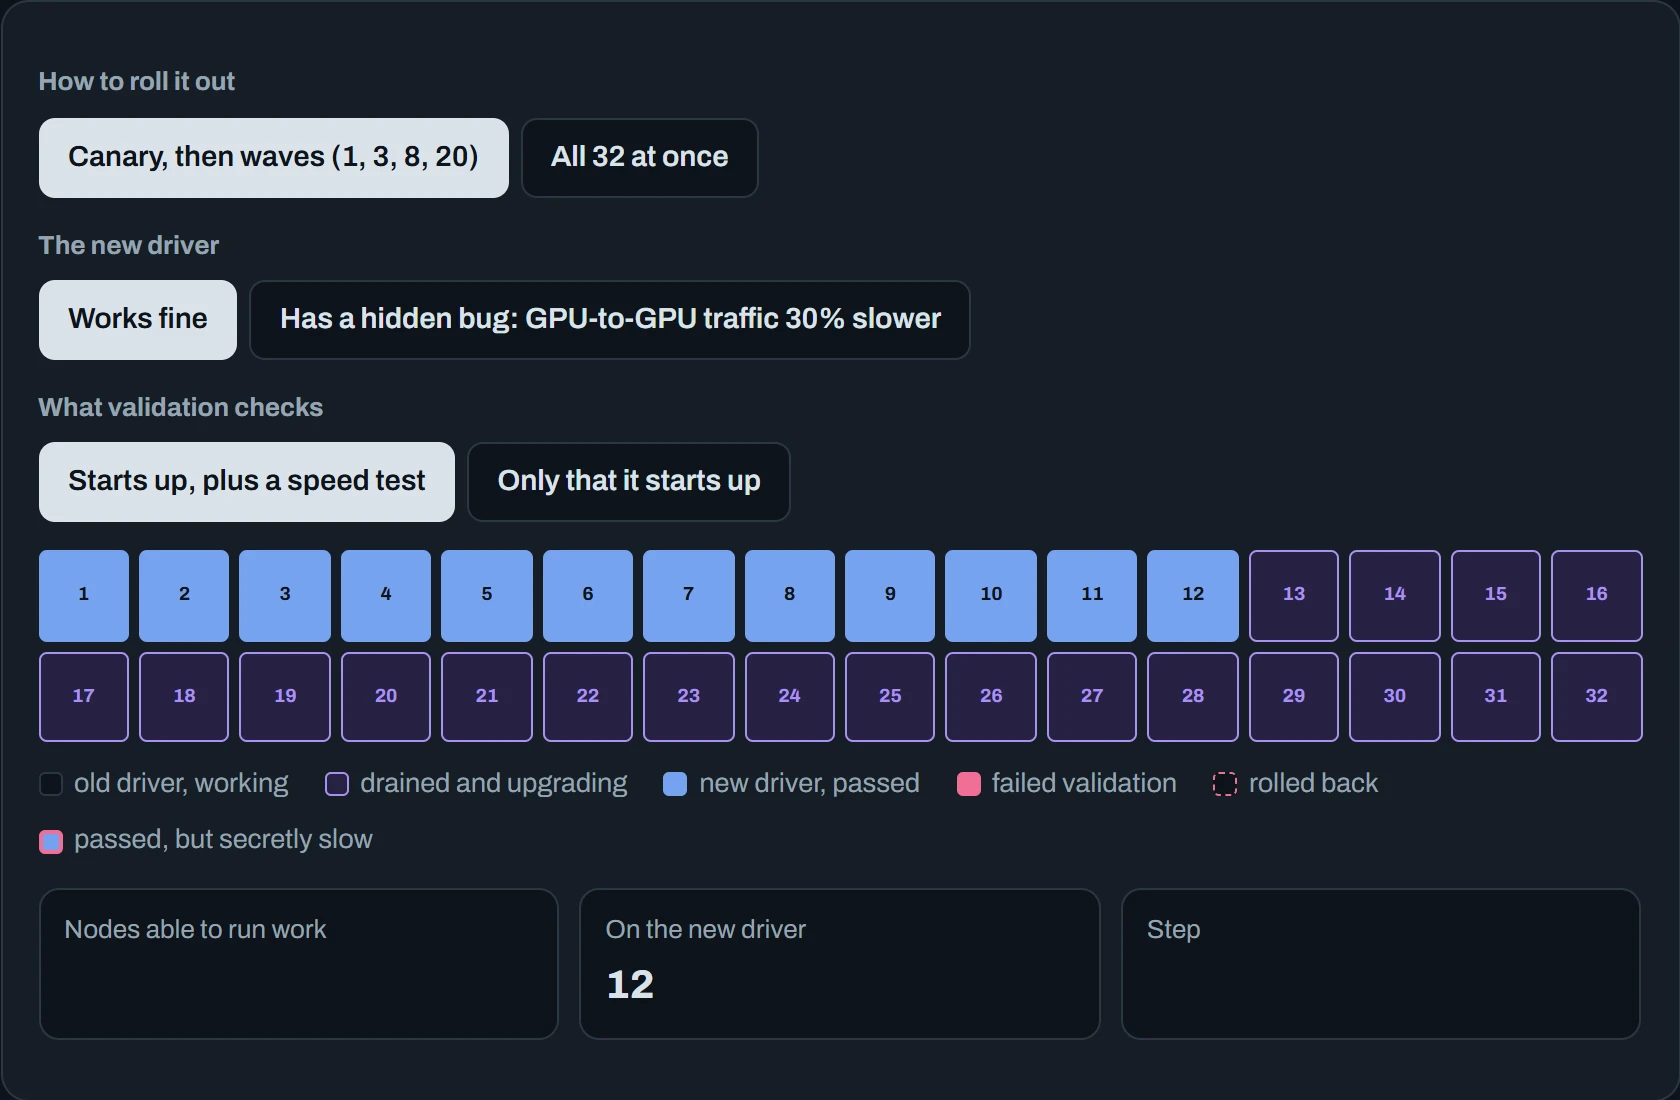
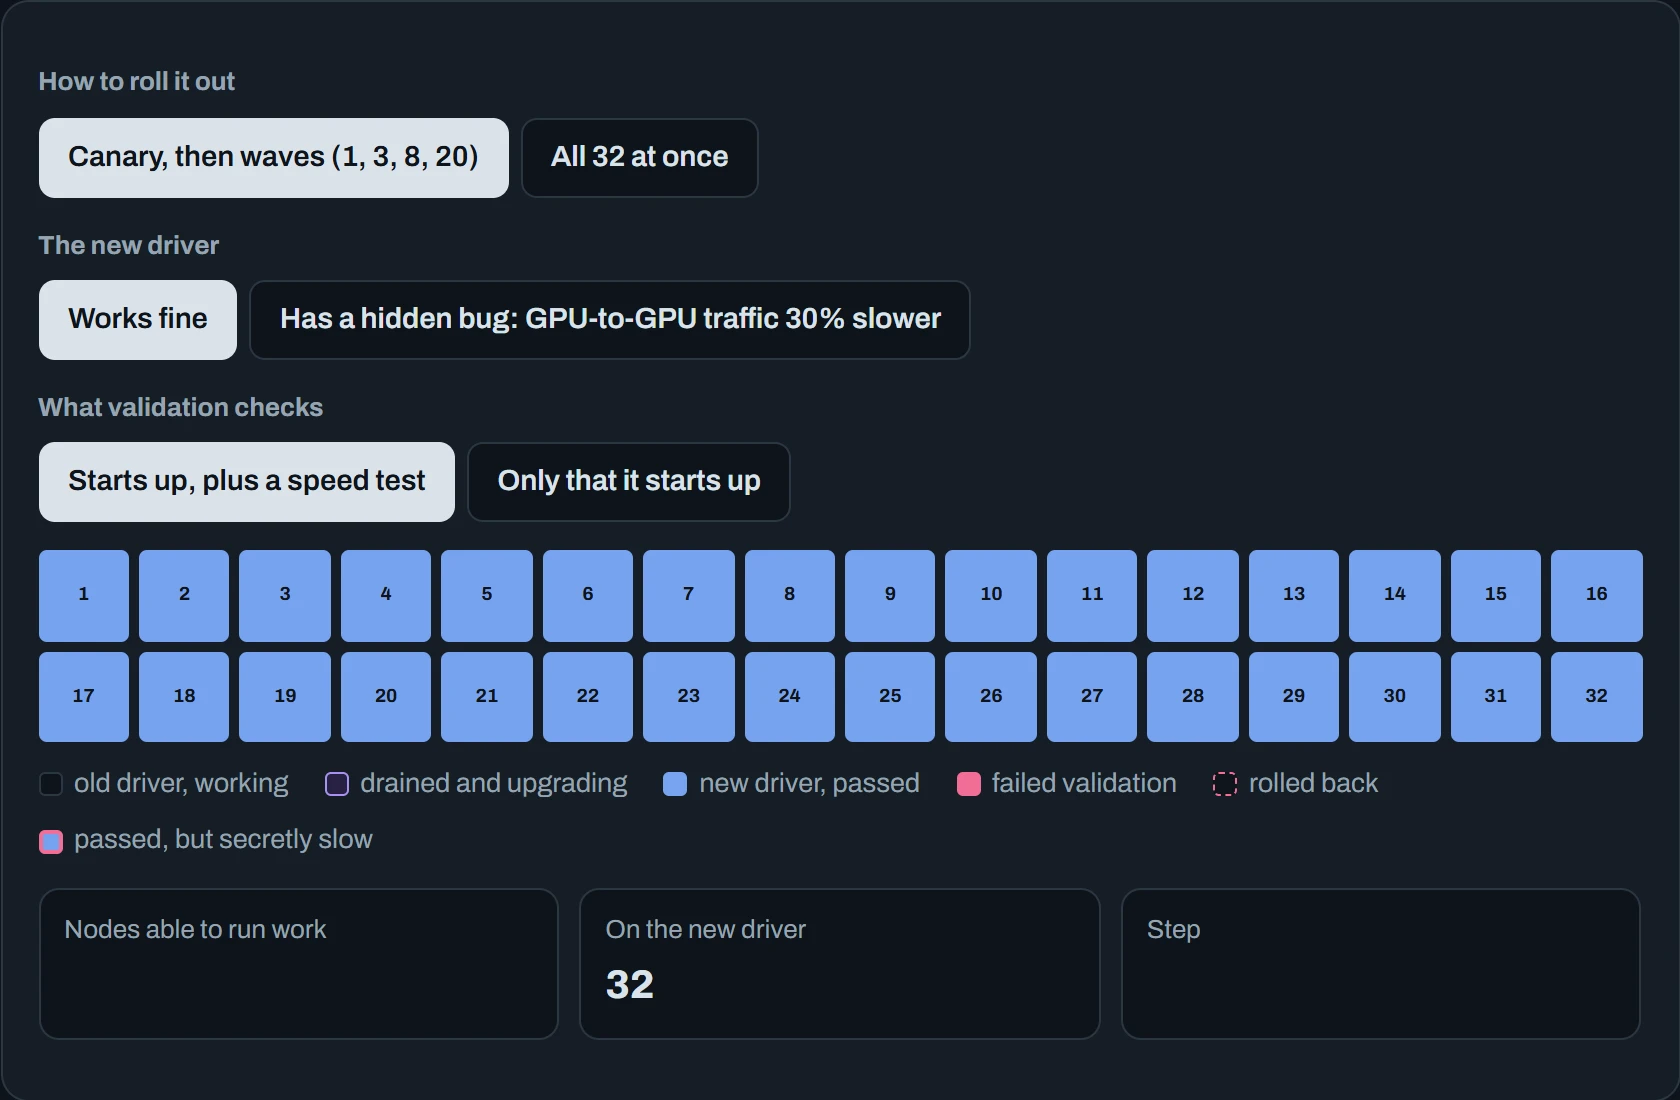
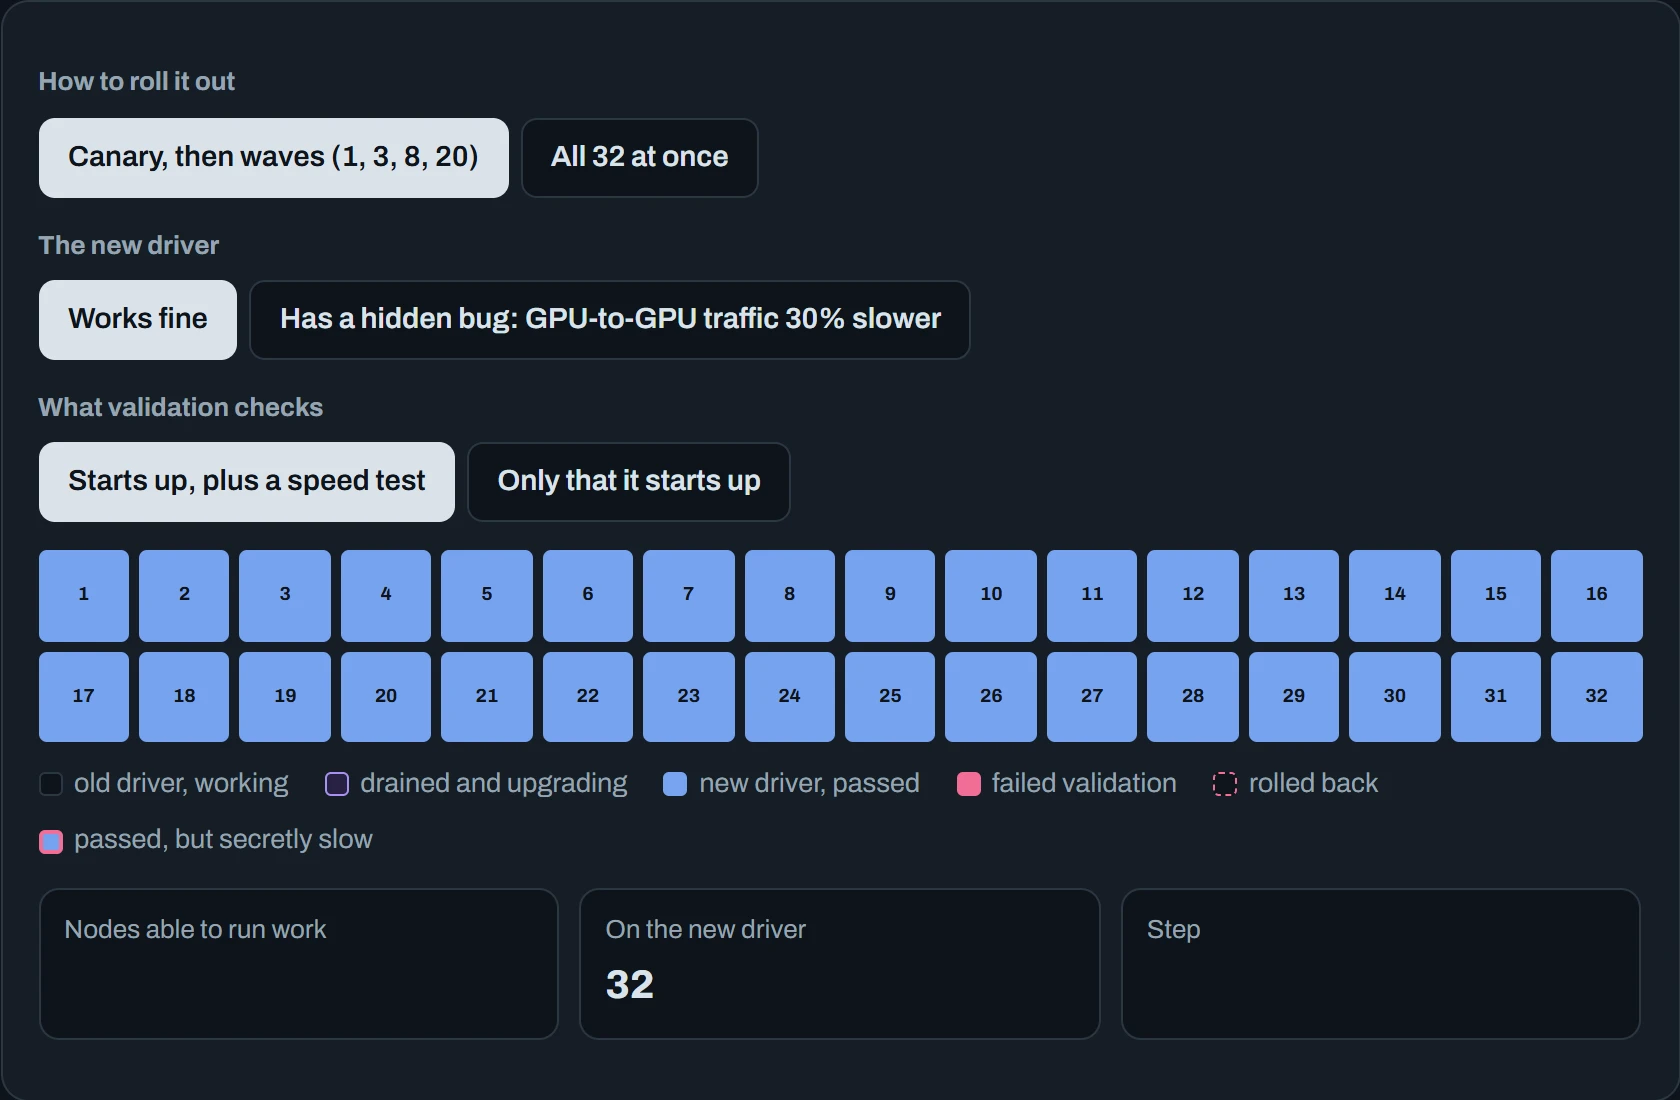
Three lessons fall out. With canaries, a bad driver breaks one node, and you roll back one node. All at once, the same bug takes down all 32, and even a good upgrade leaves you with no working nodes while it runs. And a check that only asks “does it start?” lets a slow driver through every wave. Everything looks healthy, and the whole fleet is quietly 30% slower. Validation has to measure speed against a known baseline: nccl-tests bandwidth from Down the Wire, plus a short benchmark of a real job.
On a real cluster, the drain step looks like this. Kubernetes calls each running program a pod. Slurm, the job queue many training clusters use, lets you attach a reason that everyone can read:
# Kubernetes: stop new pods landing here, then move the running ones off
$ kubectl cordon gpu-017
$ kubectl drain gpu-017 --ignore-daemonsets --delete-emptydir-data
# Slurm: same idea, with a reason everyone can see
$ scontrol update NodeName=gpu-017 State=DRAIN Reason="driver 580, wave 1"
$ sinfo -R
REASON               USER      TIMESTAMP           NODELIST
driver 580, wave 1   ops       2026-10-25T09:02:11 gpu-017
Both do the same job: the node stops taking new work, and anyone who looks can see why. Keep reasons short, because sinfo -R cuts them off after 20 characters.
A few rules make rollouts boring, which is the goal. Change one thing at a time, so when something breaks you know what did it. Write down how to undo the change before you start: the old golden image, or the old package version. Decide in advance what counts as failure, like “nccl-tests bandwidth more than 5% below the baseline”, so nobody argues about it at 3 a.m. Model updates work the same way: a new model version gets a small slice of real traffic first, and tools like Argo Rollouts shift more traffic to it only while its error rate and speed stay good.
Predict. Your fleet has 32 nodes, and the training jobs that must keep running need 24 of them. You start with a canary of 1 node. What's the biggest wave you can use after that, and how many waves will the whole upgrade take?
Answer. Waves of 8 nodes at most, because 32 − 24 = 8 nodes is all you can take out of service at once. After the canary, 31 nodes are left, which is four more waves (8, 8, 8 and 7). That's five waves in all.
This number has a name in most tools: maximum unavailable. It comes from the work you must protect, not from how fast you'd like the upgrade to go. Kubernetes sets it with a PodDisruptionBudget, which stops kubectl drain from taking out more pods than the budget allows.
Taking a node out, and back
Upgrades are planned. Failures aren't, but they should follow the same path. Every node in a healthy fleet is always in exactly one known state, and moves between states for written-down reasons. When a node shows trouble, it goes out of service first and gets investigated second. A node that's “probably fine” and still taking jobs is how one bad GPU ruins a week of training.
The diagram is a node's life cycle. Follow the arrows. A small warning, like a growing count of corrected memory errors, makes a node suspect. A hard failure, like an Xid 79 (the GPU fell off the bus, from Down the Dashboard), skips straight to drained. If the diagnosis finds a broken part, it goes back to the vendor under an RMA (a return-for-replacement request). Either way, the node only comes back after passing the same burn-in tests a new machine would.
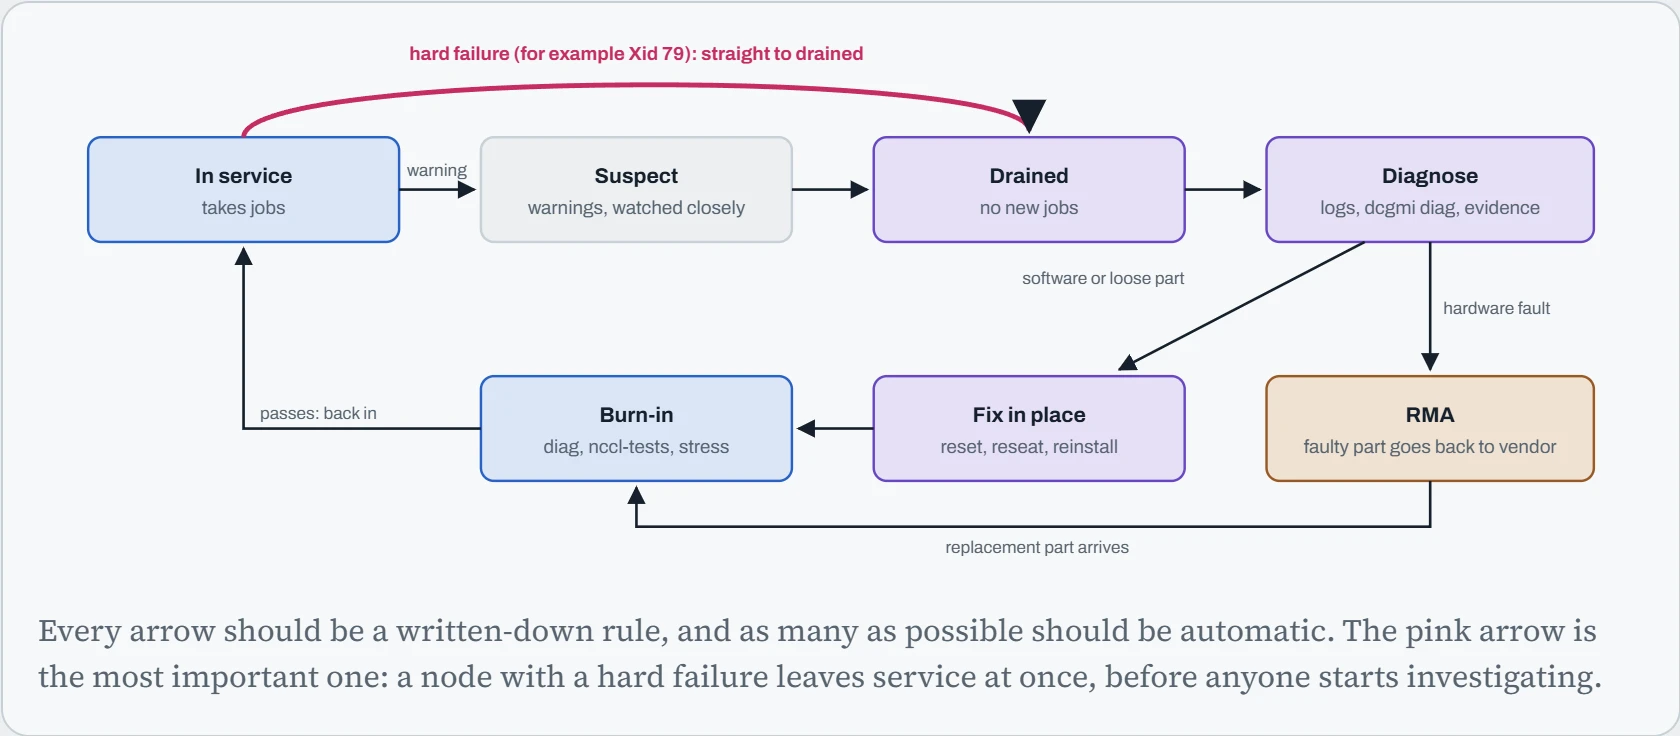
Notice there's no arrow from Diagnose straight back to In service. Even when the fix was “just reset the GPU”, the node goes through burn-in. A fault that went away on its own often comes back, and the next time it will be in the middle of somebody's 1,000-GPU job.
Burn-in uses the tools you've met before. dcgmi diag has levels: -r 1 takes seconds, -r 2 a couple of minutes, and -r 3 runs for many minutes and really works the GPUs. Then comes a bandwidth check against the fleet's baseline:
$ dcgmi diag -r 3                    # deep checks, tens of minutes
$ ./build/all_reduce_perf -b 8 -e 8G -f 2 -g 8   # within 5% of baseline?
$ scontrol update NodeName=gpu-017 State=RESUME  # only if both pass
The node goes back in only when both checks pass, so a fault that was just hiding gets caught here, on an empty machine, instead of in someone's job.
For a real hardware fault, collect evidence before the node is wiped, because the vendor will ask for it: nvidia-bug-report.sh gathers the driver's logs into one file, and the Xid lines from dmesg show what happened and when. Good evidence turns a week of back-and-forth with support into a replacement part.
Shipping changes through a pipeline
A fleet stays healthy when nobody changes it by hand. Every change, a new image, a driver bump, a new model version, goes through the same path: a commit to git, automatic tests, then a gradual rollout. Two pieces make that work for AI. CI (continuous integration) needs a GPU to test anything real, so teams register some of their own GPU machines as self-hosted runners for GitHub Actions or GitLab. A good GPU test is short: does the image start, does nvidia-smi see the GPU, does one forward pass of a tiny model give the expected numbers?
GitOps handles the rollout. A tool like Argo CD or Flux watches a git repository of Kubernetes manifests and keeps the cluster matching it, the same reconcile idea as in Down the Scheduler. Releasing a new model is then a pull request that changes one image digest, and Argo Rollouts turns it into a canary that checks real metrics before going further:
# rollout.yaml, in the GitOps repository
apiVersion: argoproj.io/v1alpha1
kind: Rollout
metadata:
  name: chat
spec:
  replicas: 10
  strategy:
    canary:
      steps:
      - setWeight: 10                        # 1 of 10 replicas runs the new version
      - pause: {duration: 30m}
      - analysis: {templates: [{templateName: ttft-and-errors}]}   # PromQL checks; failure rolls back
      - setWeight: 50
      - pause: {duration: 30m}
  selector: {matchLabels: {app: chat}}
  template:
    metadata: {labels: {app: chat}}
    spec:
      containers:
      - name: vllm
        image: registry.local/chat@sha256:7c1e…   # the only line a release PR changes
The analysis step runs the same PromQL as your SLO alerts (Down the Dashboard): if time to first token or the error rate gets worse on the canary, Argo Rollouts sends all traffic back to the old version without anyone waking up. Rolling back by hand is just as simple: revert the pull request, and GitOps does the rest.
Predict. To save money, a team attaches its GPU runner to the project's public GitHub repository, so pull requests get tested on real GPUs. What can a stranger do?
Answer. Open a pull request that changes the workflow or the tests, and run any code they like on your GPU machine, inside your network, with whatever credentials the runner holds. Mining cryptocurrency is the mild outcome; stealing secrets or moving on to other machines is the serious one. GitHub warns against self-hosted runners on public repositories for exactly this reason.
Keep GPU runners on private repositories, run each job in a fresh container or VM, give runners no long-lived secrets, and require approval before workflows from outside contributors run.
Continue the lesson
The whole lesson, with its drawings and its questions. 6 more sections after the ones above.