
Monitoring and configuration endpoints
SD-WAN Manager API paths start with /dataservice, and the next word says where the answer lives: /template changes configuration, /statistics reads what Manager has aggregated, and /device reads device state, much of it in real time from the device. Some realtime calls are for vEdge routers only. The API version is not in the URL but in the Accept header, and defaults to v1.0.
By Arif, founder of Daveth · Updated
The full 6 min walkthrough is in Daveth Pro (Network). See what the plan opens
What this page answers
What are the main SD-WAN Manager API namespaces?
/template for feature templates, device templates and device policy; /statistics for aggregated device state and statistics; and /device for device actions and real-time device state, all under /dataservice. Read it in “The prefix, and the namespaces”
How is the SD-WAN Manager API version selected?
Not in the URL: with a vendor-specific Accept header, such as application/vnd.cisco.2.0+json. Without one, the default version is v1.0. Read it in “Where the version hides”
What does attaching a device template through the API return?
The response to the attach request contains a process ID for the template attach action, not the result, so you check the action's status separately. Read it in “Writing: what does the response say?”
Which tree is the answer in?
You are authenticated, and you have a question: how is EDGE-1 doing right now, or push this template to forty sites. The reference documents hundreds of endpoints. What it does not give you is the habit of knowing where to look, and that habit comes from a few words at the front of the path.
The prefix, and the namespaces
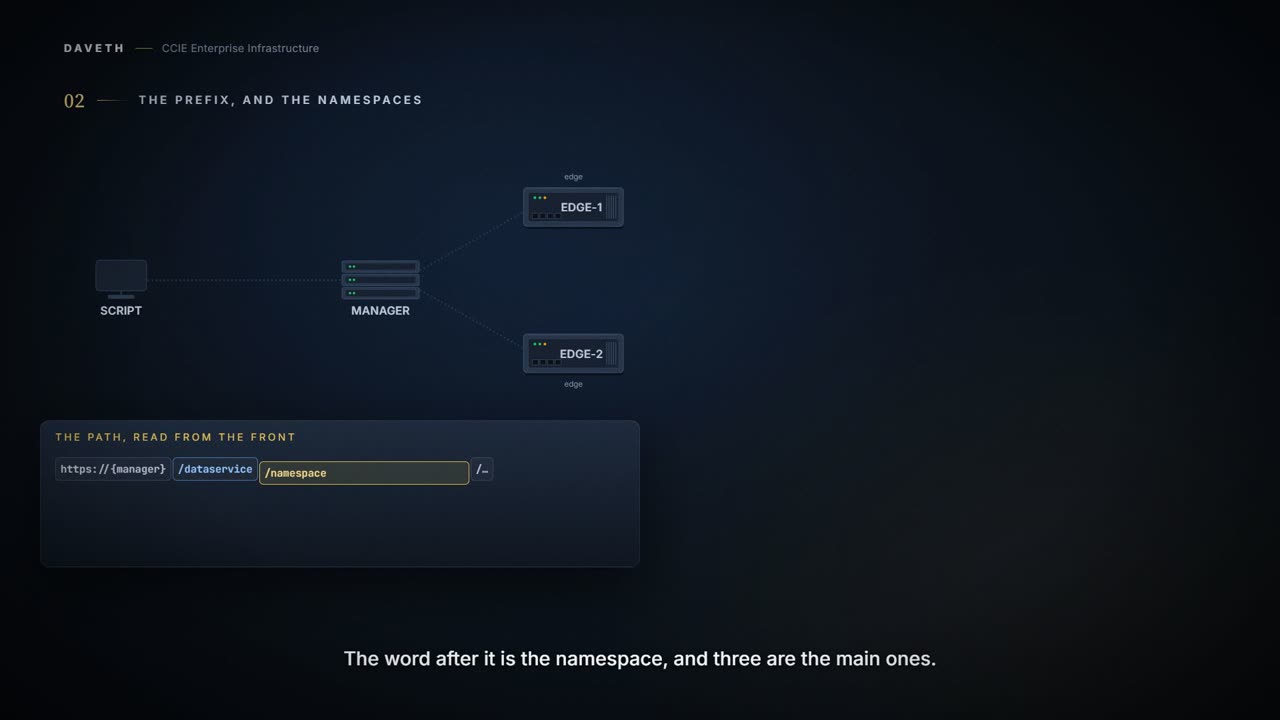
The system prefixes the Cisco Catalyst SD-WAN Manager API URL with /dataservice. Most API name spaces are: /template: Feature template, device template, device policy /statistics: Aggregated device state and statistics /device: Device action and real-time device state
Notice "most": these are the main namespaces, not all of them. Read them as questions rather than folders. /template changes something. /statistics and /device read, which is why the blueprint's two-way split into monitoring and configuration sits across a structure with a third distinction in it: aggregated, or right now.
Reading: who answers?
/statistics is what Manager has aggregated. /device is described as real-time device state, and the realtime page says exactly what that means:
Realtime monitoring APIs query device state and information in realtime.
So a first rule: a /statistics call is answered from what Manager holds; a /device call names a device and asks it. But read the /device list carefully, because Manager's own copy lives there too. Here is one question with two documented paths:
Two documented requests: paths exactly as the 20.15 page prints them.
GET https://{vmanage-ip-address}/dataservice/device/system/status?deviceId=deviceId
GET https://{vmanage-ip-address}/dataservice/device/system/synced/status?deviceId=deviceId
Display time and process information for the device, as well as CPU, memory, and disk usage data. Display time and process information for the device, as well as CPU, memory, and disk usage data (from vManage NMS only).
Same data, different answerer. The path with /synced/ is marked from vManage NMS only: Manager answers from what it has collected. The one without asks the device in realtime. Steps 1 and 2 of the walk send both, and only the second reaches EDGE-1.
Which has a consequence for how you read an answer that looks wrong. A number Manager holds is as current as whenever Manager last collected it, and that moment is not the moment you asked. So a figure that disagrees with what an engineer is looking at on the device may be neither a bug nor a lie: it can be an accurate record of an earlier state. Asking the same call again does not resolve that, because it is answered from the same store. The realtime path is what settles it, and knowing which of the two you called is the difference between a disagreement you can explain and one you argue about.
A caveat on the realtime list
Read the descriptions, not just the paths. Many carry a scope you will miss if you skim:
Display information about the BFD sessions running on a vEdge router (on vEdge routers only). Display statistics about data traffic characteristics for all operational data plane tunnel (on vEdge routers only).
This blueprint's SD-WAN is IOS XE based. A call documented for vEdge routers only is a documented limit, not a typo, and a script built on one can look correct against a fleet it does not apply to.
Where the version hides
Where is the API version in those paths? Nowhere:
The API version does not appear in the URL; instead, you can find it in the vendor-specific accept header, such as: Accept: application/vnd.cisco.2.0+json. The default version is v1.0.
A vendor media type in the Accept header selects the API generation. If your client does not set one, it gets v1.0, which is a decision it made without you. And in a shared deployment:
In a multitenant deployment, the API is available only for
The sentence ends with two views: provider, and provider-and-tenant. A tenant-only view gets no API.
Writing: what does the response say?
Now the other half. You want to attach a device template, the write that actually changes the network:
Attaching a device template puts the device into vManage mode. Attach a configuration template made from feature templates. It is a two-step process:
The documented attach request: the path as the 20.9 page prints it for feature templates.
https://vmanage-ip-address/dataservice/template/device/config/attachfeature
You POST it and get a 2xx. Commit to what is in the body before you read on.
The response contains the process ID for the template attach action:
The documented response, as the 20.9 page prints it.
{"id":"push_feature_template_configuration-01232017T154359940"}Continue the lesson
The whole lesson, with its drawings and its questions. 5 more sections after the ones above.