
EEM applets
A link flaps at three in the morning and the evidence is gone by the time anyone looks. Embedded Event Manager lets the device act on its own. An applet is a policy defined in the CLI: exactly one event, such as a syslog pattern, then actions run in label order. Applets can branch and loop, or call Python. Left alone, an applet runs once for every matching message.
By Arif, founder of Daveth · Updated
The full 5 min walkthrough is in Daveth Pro (Network). See what the plan opens
What this page answers
What is an EEM applet?
A simple Embedded Event Manager policy defined in the CLI configuration: one event and the actions to take when it occurs. A script policy is written in Tcl instead. Read it in “A policy that holds its own event”
How many events can an EEM applet have?
One. Only one event configuration command is allowed within an applet; the actions follow in label order. Read it in “An event, then actions in label order”
How do you see when an EEM applet ran?
show event manager history events lists which events triggered which policy and when; show event manager policy registered lists the policies and their events, but proves nothing fired. Read it in “Registered, running, or triggered?”
What should the device do at three in the morning?
GigabitEthernet1/0/5 flaps at three in the morning. By the time anyone looks, the counters have moved on and whatever would have explained it is gone. This is what the log holds:
*Sep 14 03:00:00.000: %LINEPROTO-5-UPDOWN: Line protocol on Interface GigabitEthernet1/0/5,
                      changed state to down
*Sep 14 03:00:03.411: %LINEPROTO-5-UPDOWN: Line protocol on Interface GigabitEthernet1/0/5,
                      changed state to up

2 line(s) in the log
Could the switch have collected the evidence itself, with nobody awake? Yes. That is what this page builds, and then has to rein in.
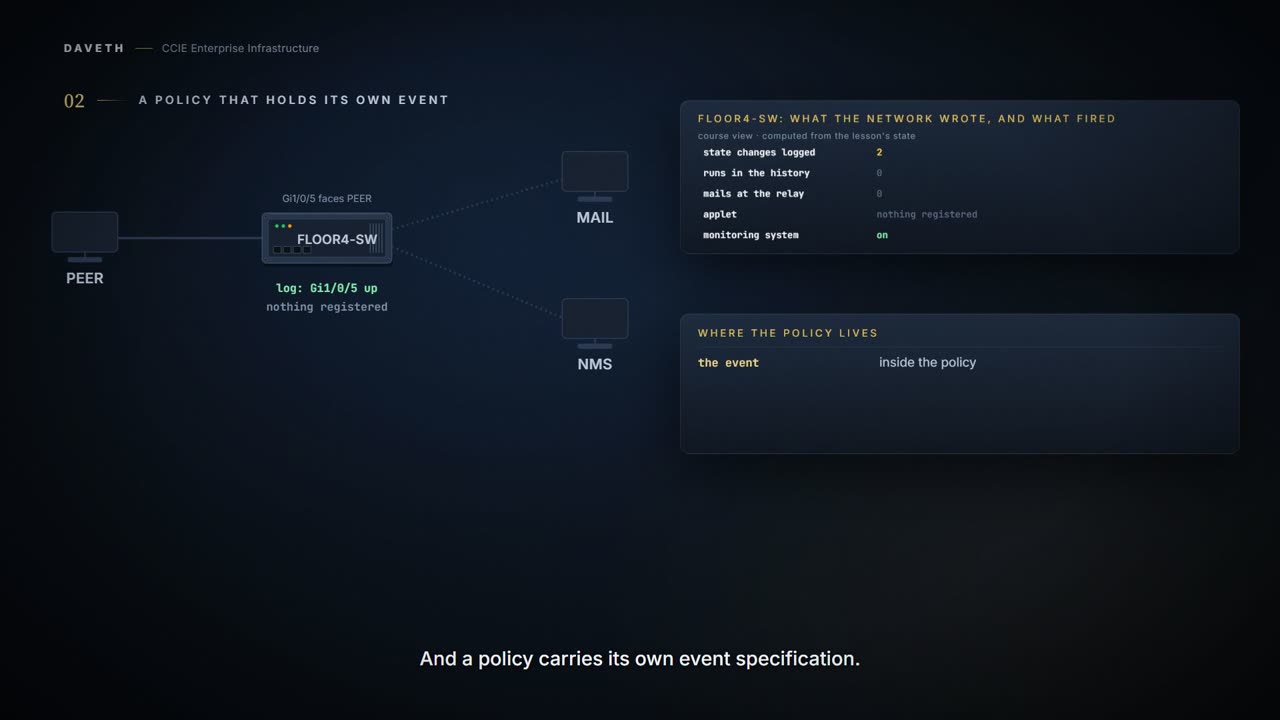
A policy that holds its own event
“Embedded Event Manager (EEM) is a distributed and customized approach to event detection and recovery offered directly in a Cisco IOS device.” An EEM policy is an entity that defines an event and the actions to be taken when that event occurs. There are two types of EEM policies: an applet or a script. An applet is a simple form of policy that is defined within the CLI configuration. A script is a form of policy that is written in Tool Command Language (Tcl).
And the sentence that separates it from the monitoring you already run:
The Embedded Event Manager schedules and runs policies on the basis of an event specification that is contained within the policy itself. When applet configuration mode is exited, EEM examines the event and action commands that are entered and registers the applet to be run when a specified event occurs.
So what does a policy on this switch need from the monitoring system? For a syslog event, nothing. The line is written on the switch, and the policy that screens it is on the switch. On this page the monitoring system is switched off for maintenance from step 2 on, and nothing below depends on it.
An event, then actions in label order
The syslog event detector is the worked example here:
The syslog event detector allows for screening syslog messages for a regular expression pattern match.
What does an applet that captures evidence on a flap look like?
FLOOR4-SW# configure terminal
FLOOR4-SW(config)# event manager applet CAPTURE-FLAP
FLOOR4-SW(config-applet)# event syslog pattern "LINEPROTO-5-UPDOWN.*GigabitEthernet1/0/5"
FLOOR4-SW(config-applet)# action 1.0 cli command "enable"
FLOOR4-SW(config-applet)# action 2.0 cli command "show interface GigabitEthernet1/0/5"
FLOOR4-SW(config-applet)# action 3.0 mail server "10.0.0.25" to "noc@example.com" from "switch@example.com" subject "Gi1/0/5 changed state" body "$_cli_result"
FLOOR4-SW(config-applet)# action 4.0 syslog msg "Evidence mailed for Gi1/0/5"
FLOOR4-SW(config-applet)# exit
FLOOR4-SW(config)# end
One event, and it has to be one: Only one event configuration command is allowed within an applet configuration. Then the actions. cli command enable first, as the guide's own examples begin. Then show interface, whose output the guide's example mails with body $_cli_result, and this applet does the same. Last, a syslog action, so the log says the evidence went. The guide's own example output shows the form such a line takes: %HA_EM-6-LOG: EEM-PIPE-TEST: Pattern matched!.
Why does action 4.0 say Gi1/0/5, and not the line it saw? Because the pattern screens for LINEPROTO-5-UPDOWN followed by the full interface name, and naming either would put the pattern's own text into the applet's message. Quoting $_syslog_msg would do the same: it holds The syslog message that caused the event to be published. Whether the syslog event detector screens the messages EEM's own syslog action writes isn't settled by any page cited, in either direction, so this applet is written so the question never arises.
Why are the labels 1.0 to 4.0, and does the number matter? The label is what orders them, and it orders them as text, not as numbers:
Actions are sorted and run in ascending alphanumeric (lexicographical) key sequence using the label as the sort key. If you are using numbers as labels be aware that alphanumerical sorting will sort 10.0 after 1.0, but before 2.0, and in this situation we recommend that you use numbers such as 01.0, 02.0, and so on, or use an initial letter followed by numbers.
Registered, and the link flaps again. Is the policy known to the switch, and what would it do?
FLOOR4-SW# show event manager policy registered event-type syslog
No.  Type    Event Type          Time Registered           Name
! Computed by this course, in the IOS XE 17.x CLI chapter's event-type syslog sample layout. The 17.9 Python chapter's sample adds Class and Trap columns; which layout a given switch prints is not settled by the samples.
1    applet  syslog              Mon Sep14  03:00:43 2026 CAPTURE-FLAP
 pattern {LINEPROTO-5-UPDOWN.*GigabitEthernet1/0/5}
 ! The event specification, inside the policy.
 action 1.0 cli command "enable"
 action 2.0 cli command "show interface GigabitEthernet1/0/5"
 action 3.0 mail server "10.0.0.25" to "noc@example.com" from
"switch@example.com" subject "Gi1/0/5 changed state" body "$_cli_result"
 action 4.0 syslog msg "Evidence mailed for Gi1/0/5"
! This is what the switch would react to and what it would do, in label order. It does not say whether anything has fired.
And did it fire?
FLOOR4-SW# show event manager history events
No.  Time of Event             Event Type          Name
! Computed by this course, in the guide's sample layout. "syslog" in Event Type is this course's reading: the sample shows snmp and application rows.
1    Mon Sep14  03:10:45 2026  syslog              applet: CAPTURE-FLAP
2    Mon Sep14  03:10:48 2026  syslog              applet: CAPTURE-FLAP
! This is which events triggered which policy, and when. Nothing in it says what the actions did, or which line started each run: the sample has no column for either.
Two firings, not one. A flap is two state changes, down and then up, and the pattern matches both lines. Two mails went to the relay while the monitoring system was off.
When a list of actions isn't enough
What if the policy has to decide something, or repeat something? An applet can branch and loop without leaving the CLI:
Conditional logic introduces a control structure that can change the flow of actions within applets depending on conditional expressions.
And a policy can be Python instead. From the IOS XE 17.9 EEM Python chapter:
An EEM applet can include a Python script with an action command. Embedded Event Manager (EEM) policies support Python scripts. You can register Python scripts as EEM policies, and execute the registered Python scripts when a corresponding event occurs.
FLOOR4-SW# configure terminal
FLOOR4-SW(config)# event manager directory user policy flash:/user_library
FLOOR4-SW(config)# event manager policy eem_script.py
FLOOR4-SW(config)# end
Those two lines are the chapter's own example. Where that script runs, and what it can call, is 5.2.b.
How long may one run take? Twenty seconds unless the event says otherwise: If the maxrun keyword is not specified, the default applet run time is 20 seconds. And one way a run uses all of it: Specification of an incorrect pattern will cause the action cli command to wait forever until the applet execution times out due to the maxrun timer expiration.
When the link won't settle
At half past three the link starts flapping: down, up three seconds later, and down again, six times in under two minutes. The applet hasn't changed, and nobody is awake.
Predict before you read what happened.
time      started by      mail sent
03:30:48  the down line   yes
03:30:51  the up line     yes
03:31:05  the down line   yes
03:31:08  the up line     yes
03:31:22  the down line   yes
03:31:25  the up line     yes
03:31:39  the down line   yes
03:31:42  the up line     yes
03:31:56  the down line   yes
03:31:59  the up line     yes
03:32:13  the down line   yes
03:32:16  the up line     yes

12 run(s) for 12 state change(s) the network logged
shortest gap between two runs: 3 seconds
Twelve runs and twelve mails for twelve state changes. The published EEM troubleshooting note describes exactly this, with a link-flap applet much like this one: "The applet fires each time the syslog is observed." Its example appended to a file, and "The applet ran numerous times over the course of a few minutes, which resulted in an undesirable output file with extraneous data." This one mails, so the relay takes the flood.
Nothing here is broken. Every run is a correct response to a line the network wrote. The applet was written for a flap, and the link is doing something else.
Registered, running, or triggered?
Three commands, three questions, and people reach for whichever one they remember.
Proves: show event manager policy registered: which policies the switch knows about, the event each screens for, and its actions in label order.
Does not prove: that anything has fired.
Proves: show event manager history events: which events triggered which policy, and when.
Does not prove: what the actions did, and which line started each run. The guide's sample has four columns, No., Time of Event, Event Type and Name, and none of them is an outcome: a mail that never arrived, or a cli command that waited until maxrun, has no column to show in.
The third is a different question: is a policy running at this moment? This command displays only the running EEM policies. Cisco's sample, from the CLI chapter, where the same Tcl policy has several runs going at once:
no. job id p s status time of event event type name
1 12598 N A running Mon Oct29 20:49:37 2007 timer watchdog loop.tcl
2 12609 N A running Mon Oct29 20:49:42 2007 timer watchdog loop.tcl
Proves: show event manager policy active: the runs executing at the instant you type it.
Does not prove: anything about runs that already finished. This page doesn't draw it for the switch, because whether a run is still going when you look depends on timing it doesn't model.
A mailbox filling up
Symptom: the relay has taken twelve mails from FLOOR4-SW in under two minutes.
Is the applet broken? That is the first instinct. Read the history before you decide:
FLOOR4-SW# show event manager history events
No.  Time of Event             Event Type          Name
1    Mon Sep14  03:10:45 2026  syslog              applet: CAPTURE-FLAP
2    Mon Sep14  03:10:48 2026  syslog              applet: CAPTURE-FLAP
3    Mon Sep14  03:30:48 2026  syslog              applet: CAPTURE-FLAP
4    Mon Sep14  03:30:51 2026  syslog              applet: CAPTURE-FLAP
5    Mon Sep14  03:31:05 2026  syslog              applet: CAPTURE-FLAP
6    Mon Sep14  03:31:08 2026  syslog              applet: CAPTURE-FLAP
7    Mon Sep14  03:31:22 2026  syslog              applet: CAPTURE-FLAP
8    Mon Sep14  03:31:25 2026  syslog              applet: CAPTURE-FLAP
9    Mon Sep14  03:31:39 2026  syslog              applet: CAPTURE-FLAP
10   Mon Sep14  03:31:42 2026  syslog              applet: CAPTURE-FLAP
11   Mon Sep14  03:31:56 2026  syslog              applet: CAPTURE-FLAP
12   Mon Sep14  03:31:59 2026  syslog              applet: CAPTURE-FLAP
13   Mon Sep14  03:32:13 2026  syslog              applet: CAPTURE-FLAP
14   Mon Sep14  03:32:16 2026  syslog              applet: CAPTURE-FLAP
! The last of twelve rows since the flapping began. This is which events triggered which policy, and when. Nothing in it says what the actions did, or which line started each run: the sample has no column for either.
Twelve rows since the flapping began, and twelve state changes the network logged. One for one. The history can't say which line started which row, but the times line up with the network's: a row two seconds after every state change. The policy is doing exactly what its event says; the rate is the link's.
Continue the lesson
The whole lesson, with its drawings and its questions. The rest of this section and 4 more after it.