
Packet trace and conditional debug
A capture shows a packet going in and nothing coming out; it does not say what the device decided. Packet trace records per-packet process details: accounting, a per-packet summary and per-packet path data. Both it and conditional debug start with debug platform condition, and a separate start command. Drop trace needs no condition. Packet trace runs on QFP routers, not on Catalyst switches.
By Arif, founder of Daveth · Updated
The full 6 min walkthrough is in Daveth Pro (Network). See what the plan opens
What this page answers
What does packet trace show?
Per-packet process details for traffic matching user-defined conditions, at three levels: accounting, a per-packet summary with a state and reason, and per-packet path data. Read it in “Tool one: packet trace”
Does packet trace run on Catalyst switches?
No. It is available on QFP-based routing platforms such as the ASR1000, ISR4000, ISR1000, Catalyst 8000 and Catalyst 8000v, and not on Catalyst series switches. Read it in “Where it runs”
How do you set up a conditional debug on IOS XE?
Define the condition, such as debug platform condition interface name ingress, then start watching with debug platform condition start, a separate command people miss. Read it in “The shared step: conditions”
Why was this packet dropped?
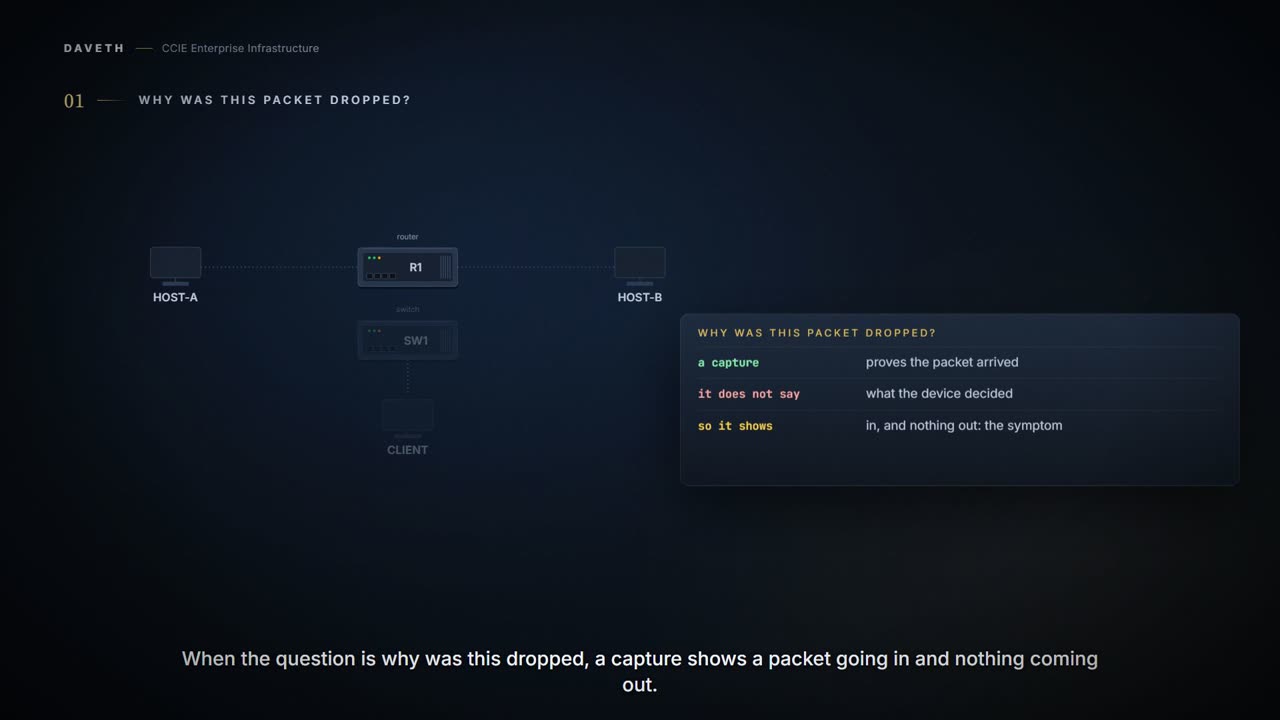
The capture tools in 4.7.a prove a packet arrived and show every byte of it. They do not say what the device then decided. When the question is why was this dropped, a capture shows a packet going in and nothing coming out, which is the symptom you already had.
Two tools answer the real question. They start from the same command, and they part company on what they record and where they run.
The shared step: conditions
What do both tools need first? A description of the traffic you care about, and then, the part everyone misses the first time, a separate command to start watching for it. Here is the TAC document's setup for tracing drops on a router, as it prints it:
TAC 117858's drop-trace setup, as printed, no prompt on the page.
debug platform condition interface Gig 0/0/1 ingress
debug platform condition start
debug platform packet-trace packet 1024 fia-trace
debug platform packet-trace drop
Line two is its own command. The 9300 guide describes the same command the same way:
Starts conditional debugging (this will start radioactive tracing if there is a match on one of the conditions above).
Until that line, the device holds a description of traffic it is not watching for. Step 1 of the walk leaves it out: five drops, nothing traced.
Tool one: packet trace
What would you want to know that a capture cannot tell you?
It provides a field-safe method that is used for accounting and in order to capture the per-packet process details based on a class of user-defined conditions.
Per-packet process details. Not the packet: what the forwarding path did to it, and where it stopped.
Three specific levels of inspection are provided by the packet trace:
- Accounting
- Per-packet summary
- Per-packet path data
Which level answers which question? Accounting counts. The summary gives each packet a state and a reason. Path data lists what the packet went through.
Where it runs
Cisco IOS XE runs on routers and on Catalyst switches. Before you read on, predict: does packet trace run everywhere IOS XE does? Step 5 of the walk asks it about SW1.
The packet-trace feature is available in Cisco IOS-XE version 3.10 and later releases on the QFP (Quantum Flow Processor) based routing platforms, which include the ASR1000, ISR4000, ISR1000, Catalyst 1000, Catalyst 8000, CSR1000v, and Catalyst 8000v series routers. This feature is not supported on the ASR900 series aggregation services routers or the Catalyst series switches that run Cisco IOS-XE software.
Not on Catalyst switches. That includes the Catalyst 9300 this course baselines against.
Which is worth holding as a general habit rather than one fact to memorise: a command does not travel with the badge on the front. The same operating system name across two product lines does not mean the same forwarding hardware underneath, and the tools that read that hardware are the first things to differ.
There is something wry about a blueprint asking for a troubleshooting tool that the course's own reference switch does not have. It is not an error: a CCIE works on routers as well as switches, and on an ISR or a Catalyst 8000 packet trace is one of the best diagnostic tools there is. It is simply not the tool on the switch in front of you, and if you study it on a switch you will not be able to practise it. Knowing that in advance beats discovering it at a console and deciding you misremembered a command.
It is not free either:
The performance impact varies, dependent upon the packet trace options that are enabled.
Drop trace, and reading it
When the only packets you care about are the ones that died:
It enables packet trace only for dropped packets. It can be used without global or interface conditions in order to capture drop events. A drop event capture means that only the drop itself is traced, not the life of the packet.
Notice the second sentence: drop trace is the one case that does not need a condition at all. And the third: it records the drop, not everything before it.
Now the TAC document's own run: five pings from 172.16.10.2 to 172.16.20.2, the setup above, started. The walk's R1 is this scenario. First, what does the router count?
TAC 117858, packet-trace statistics, as printed, leading spaces trimmed.
ASR1000#show platform packet-trace statistics
Packets Summary
Matched  5
Traced   5
Packets Received
Ingress  5
Inject   0
Packets Processed
Forward  0
Punt     0
Drop     5
Count       Code  Cause
5           8     Ipv4Acl
Consume  0
Look at the last rows: five dropped, and all five share one code, 8, whose cause is Ipv4Acl. Which packets, and where were they going?
TAC 117858, the summary, as printed, leading spaces trimmed.
ASR1000#show platform packet-trace summary
Pkt   Input            Output           State  Reason
0     Gi0/0/1          Gi0/0/0          DROP   8   (Ipv4Acl)
1     Gi0/0/1          Gi0/0/0          DROP   8   (Ipv4Acl)
2     Gi0/0/1          Gi0/0/0          DROP   8   (Ipv4Acl)
3     Gi0/0/1          Gi0/0/0          DROP   8   (Ipv4Acl)
4     Gi0/0/1          Gi0/0/0          DROP   8   (Ipv4Acl)
TAC 117858, packet 0: the first lines as printed, after the document's own debug platform condition stop; the path trace below them is not reproduced.
ASR1K#show platform packet-trace packet 0
Packet: 0           CBUG ID: 140
Summary
Input     : GigabitEthernet0/0/1
Output    : GigabitEthernet0/0/0
State     : DROP 8   (Ipv4Acl)
What these prove: the forwarding path's own record of what it did with those packets, including the drop code and its cause. That is a categorically better answer than it went in and did not come out. The path trace below the summary lists the features the packet passed through; this lesson does not read a drop location into that list, because the document does not.
What they do not prove: that the packet you care about was traced. Tracing is bounded by the condition and by the packet count you set. An empty trace is far more often a condition that did not match, or never started, than evidence the traffic was absent.
Continue the lesson
The whole lesson, with its drawings and its questions. The rest of this section and 5 more after it.